Position Sizer (% of Acct & Shares Req)
This indicator calculates % position size and share quantity required based on total capital and user-defined risk percentages
This indicator differs from the Shares Qty indicator in that it is based on %'s rather than a user-defined, fixed dollar amount to risk (for those who prefer to calculate risk in this manner instead)
Tracks real-time Low of Day (LoD) during regular trading hours (RTH) for accurate stop placement
Current price as well as output rows 2 and 3 can be toggled on/off, per preference
Allows stop loss selection between LoD, Low of Week (LoW), and Prior Day Low (PDL)
Keeps data updating intraday to reflect changing LoD and price conditions
Provides a second “Stop Loss Compare” dropdown to compare two stop methods side by side
Displays all results in a dynamic on-chart table that updates with live prices
Shows capital amount, stop type, stop price, and share counts for three risk levels
=========
Risk rows displayed as: Risk of Cap Amt: ,
=========
Disclaimer:
This indicator is for educational and informational purposes only. It should not be used as the sole basis for trading decisions. Always combine with other forms of analysis, proper risk management techniques, and consider your individual trading plan and risk tolerance. All calculations and outputs are provided as-is, and it is your responsibility to verify their accuracy before making any trading decisions.
Total

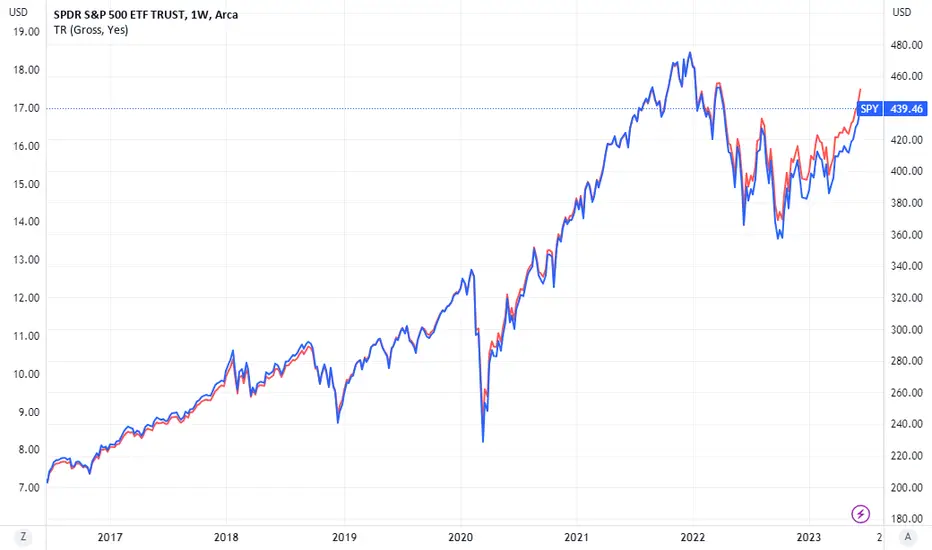
Total ReturnThis script calculates a Total Return index for stocks that shows the total performance of a stock, incorporating returns from both the share price and dividends.
To understand this, consider the situation where you invest in a 5% div stock and hold the position for 10 years. Assume at the end of 10 years, the price has gone up by 50%. A price chart will then show a 50% return, but in reality the investor has also received 50% of the initial investment in dividends, making his total return substantially more. Exactly how much more depends on whether the investor reinvested the dividends in the stock, or just held them as cash. If the former, his total return will be well over 100%; in the latter, his total return will be 100% exactly.
There are 2 input options:
- Dividend type: allows the user to choose "gross" or "net". Note that most stocks will have a "gross" data series whereas many will not have a "net" series.
- Reinvestment: allows the user to choose whether dividends should be reinvested in the stock ("Yes") or held in cash ("No").
Total return formula:
- With reinvestment: log((today's closing price + dividends paid today) / (yesterday's closing price))
- Without reinvestment: log(today's closing price / yesterday's closing price) + log (dividends paid thus far / first closing price)
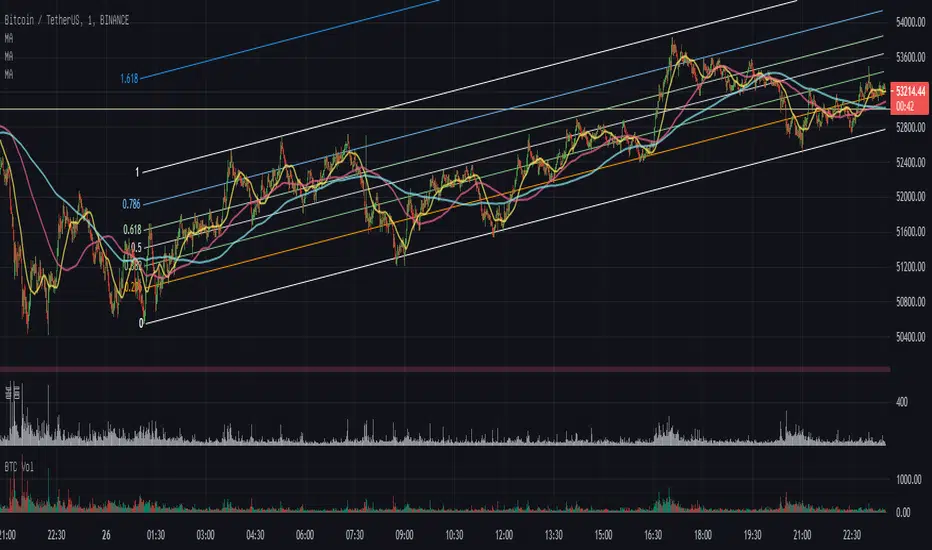
Crypto swing correlation RSI and SMAThis is a crypto swing strategy, designed for long term periods and correlated pairs with crypto market total(or other coins used as correlation, however I recommend total of crypto or btc)
Its components are:
RSI with a very length
Correlation candles
SMA 9
Rules for entry:
For long : RSI is above 51 level and going higher and close of the candle is above the SMA
For short :RSI is below 49 and going lower and close of the candle is below the SMA
Rules for exit:
We exit when we encountered an opposite condition than the entry one, or based on take profit/stop loss levels.
If you have any questions let me know !

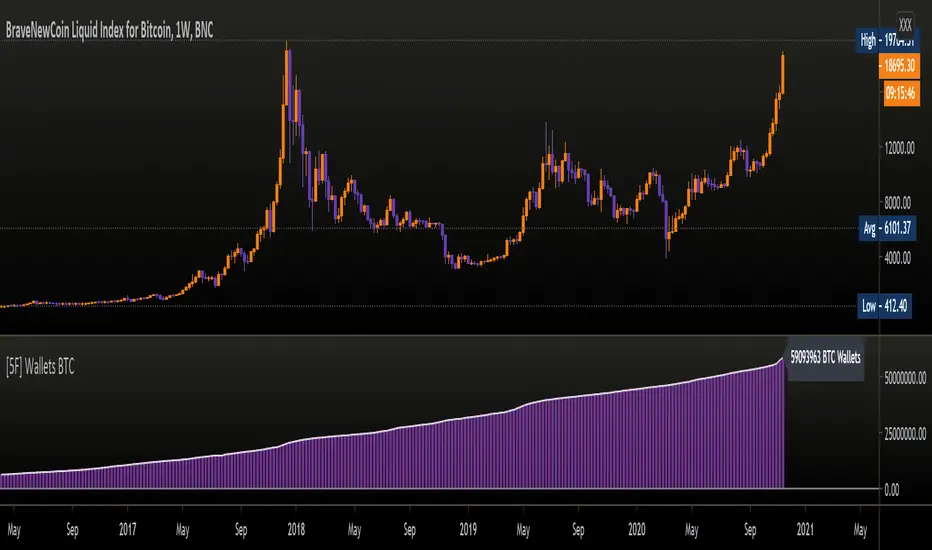
[5F ] Number of Bitcoin wallets-═════════════════════════-
This is a simple script that displays the total number of Bitcoins wallets based on the data provided by Quandl.
Use it in dayli resolution minimum
Refresh every day
Thanks to all Pinecoders who share their work with the community.
-═════════════════════════-