Intraday Toolkit1. Visual Components of the Indicator
Understanding the visual cues is essential for quick decision-making during fast-moving intraday sessions:
Trend Background: The background color represents the Primary Cycle (80-period) bias. Green indicates a bullish trend (price is above the primary cycle), and red indicates a bearish trend (price is below the primary cycle).
The Three Cycles:
Yellow Line: Short Cycle (20) – Used for momentum triggers.
Orange Line: Mid Cycle (40) – Represents the baseline for volatility envelopes.
Red Line: Primary Cycle (80) – Defines the overall trend direction.
Volatility Envelopes: Two green lines plotted at a distance (1.5x ATR) from the Mid Cycle. These act as exhaustion zones where price is likely to revert or consolidate.
Rule 3 Signals (Purple Circles): These appear when a specific 3-candle momentum breakout occurs.
2. Trading Strategy for 5m & 15m
This toolkit is most effective when you use the 15m chart for trend confirmation and the 5m chart for precise entries.
Long (Buy) Setup
Enter a long position when the following alignment occurs:
Bullish Bias: The background must be Green (Price > Primary Cycle).
Cycle Low: A pivot low must have been detected (the indicator identifies a local bottom).
Momentum Trigger: Price must close above the Yellow Short Cycle line while the previous candle was below it.
Rule 3 Confirmation: If a purple circle appears simultaneously, it confirms strong buying momentum.
Short (Sell) Setup
Enter a short position when the following alignment occurs:
Bearish Bias: The background must be Red (Price < Primary Cycle).
Cycle High: A pivot high must have been detected (the indicator identifies a local top).
Momentum Trigger: Price must close below the Yellow Short Cycle line while the previous candle was above it.
Rule 3 Confirmation: A purple circle above the price confirms a bearish momentum shift.
3. Exit and Take-Profit Logic
The script includes "State Control" to manage your exits effectively:
Targeting the Envelopes: The primary profit target is the Outer Green Envelope. If price touches the upper envelope (for longs) or lower envelope (for shorts), the trend may be exhausted.
Momentum Exit: If price crosses back over the Yellow Short Cycle line in the opposite direction of your trade, the toolkit considers the move over and signals an exit.
4. Specific Tips for Day Trading
Avoid "Counter-Trend" Signals: Do not take Buy signals if the background is Red, or Sell signals if the background is Green. The logic is built to filter these out for better win rates.
The "Rule 3" Advantage: Use the purple circles as a "second chance" entry. If you missed the initial Buy/Sell signal, a Rule 3 circle indicates momentum is still strong in that direction.
Timeframe Synergy: * 15m: Best for seeing the "Big Picture" and avoiding noise.
5m: Best for finding entries with smaller stop-losses near the Yellow Short Cycle line.
Trade

Advanced Market Structure [Rogman]Rogman's Advanced Market Structure Indicator
The Ultimate All-in-One Market Structure Analysis Tool for TradingView
Take your technical analysis to the next level with a comprehensive, professional-grade tool designed for traders who demand precision and clarity in their charts.
🎯 Who Is This For?
ICT/SMC Traders seeking liquidity zones and market structure analysis
Day Traders monitoring session-based price action and kill zones
Swing Traders identifying key higher timeframe levels
Price Action Traders analyzing structure breaks and trend changes
Any Serious Trader wanting a clean, comprehensive market structure overlay
✨ Key Features
📊 Market Sessions Visualization
Track the three major trading sessions with our unique bracket-style display:
Asia, London, and New York sessions are clearly marked
Sessions display as SESSION ════════════ below price action
Smart vertical stacking prevents overlapping when sessions have similar lows
Fully customizable session times for any timezone
Perfect for identifying session highs/lows and optimal kill zone timing
📈 Higher Timeframe (HTF) Levels
Never miss a key level again:
Display Daily and Weekly Open, High, and Low levels
Instant visual reference for HTF support and resistance
Separate color controls for lines and labels
Choose from Solid, Dashed, or Dotted line styles
Essential for determining HTF bias and key decision points
🔄 Automatic Swing Detection
Let the indicator do the heavy lifting:
Auto-detection of swing highs (▼) and swing lows (▲)
Configurable lookback period for sensitivity adjustment
Optional horizontal level lines extending from swing points
Customizable colors, widths, and line styles
Identify potential reversal points and structure levels instantly
💧 Liquidity Zone Mapping
See where the money is hiding:
Automatic identification of buy-side liquidity (above swing highs)
Automatic identification of sell-side liquidity (below swing lows)
Visual zones show where stop losses are clustered
Real-time tracking when liquidity gets swept
Swept zones change color — know when liquidity has been taken
📉 Multi-Method Trend Detection
Three powerful methods to confirm trend direction:
Swing Structure — Based on higher highs/lows or lower highs/lows
EMA — Trend based on price position relative to EMA
Supertrend — Uses the popular Supertrend indicator
Features include:
Optional background coloring for at-a-glance trend identification
Real-time trend status label (UPTREND/DOWNTREND/NEUTRAL)
Customizable colors and transparency
🏷️ HH/HL/LH/LL Labels
Automatic market structure labeling:
HH (Higher High) — Bullish continuation signal
HL (Higher Low) — Bullish continuation signal
LH (Lower High) — Bearish continuation signal
LL (Lower Low) — Bearish continuation signal
Color-coded for instant visual recognition
📋 Information Dashboard
All critical data at a glance:
Current ticker symbol
Trend direction and status
Daily and Weekly bias
Last swing high and low prices
Active liquidity zone count
Positionable in any corner of your chart
🔔 Built-in Alerts
Never miss a key event:
Trend change alerts (Bullish/Bearish)
Swing high/low formation alerts
Set up notifications for critical market structure changes
🎨 Fully Customizable
Every feature can be:
Toggled on/off individually via the Feature Toggles menu
Color customized to match your chart theme
Size adjusted for optimal visibility
Fine-tuned with sensitivity parameters
Organized settings groups make configuration intuitive and fast.
🚀 Why Choose This Indicator?
Feature: Benefit: All-in-One Solution. Replace multiple indicators with one comprehensive tool. Clean Design and Thoughtful visual hierarchy keep charts readable. Smart Overlap Prevention. Session bars automatically stack to avoid visual clutter. Real-Time Updates: All elements update dynamically as the price moves. Professional Quality-Built with best practices in Pine Script v6. Extensive Documentation, clear code comments, and an organized structure
📖 How to Use
Add the indicator to your TradingView chart
Enable/disable features using the Feature Toggles menu
Customize colors and settings to match your preferences
Adjust session times for your timezone
Set up alerts for trend changes and swing formations
Pro Tips:
Use session times to identify optimal entry windows during kill zones
Watch for price sweeping liquidity zones before looking for reversals
Combine HTF bias with lower timeframe entries for higher probability trades
Use swing levels as potential support/resistance for entries and targets
Monitor the dashboard for a quick market assessment before trading
⚠️ Disclaimer
This indicator is provided for educational and informational purposes only. It does not constitute financial advice. Trading involves substantial risk and is not suitable for all investors. Past performance is not indicative of future results. Always conduct your own analysis and consider your financial situation before making trading decisions.

A Humbled Trader Strategy + ChecklistHumbled Trader Swing Strategy + Checklist
This indicator is a complete swing trading system based on the high-probability strategies popularized by Humbled Trader. It is designed to help traders identify trend breakouts and low-risk momentum pullbacks on the Daily Timeframe.
The script combines trend filtering, automated resistance lines, and specific entry triggers into a single chart overlay, complete with a real-time Strategy Checklist Dashboard to confirm your setups instantly.
🎯 Core Components
Trend Filter (Purple Line): The 200 Simple Moving Average (SMA). This acts as your long-term trend filter. We only look for long trades when the price is above this line.
Momentum Guide (Orange Line): The 8 Exponential Moving Average (EMA). This tracks short-term momentum. In a strong trend, price will "ride" this line. We look to enter when price pulls back to touch this area.
Multi-Month Resistance (Orange Horizontal Line): Automatically plots the highest price over the last X Months (adjustable). This helps you instantly visualize the key level the stock needs to break out from.
Checklist Dashboard: A real-time table that evaluates Trend, Resistance, and Momentum conditions to give you a clear "✅ ENTER", "🚀 GAP UP", or "⏳ WAIT" signal.
🛠 How It Works
This indicator scans for two specific setups:
1. The Daily Gap Up ("GAP" Label) This signal appears when a stock shows strong momentum by gapping up overnight.
Condition: The stock opens at least 3% higher (adjustable) than the previous day's Close AND opens above the previous day's High.
Trend: Must be above the 200 SMA.
Visual: Marked with a green "GAP" label on the chart.
2. The Trend Pullback ("ENTER" Signal) This is a trend-following entry that lets you join an existing move with lower risk.
Condition: The stock is in an uptrend but dips down to touch or test the 8 EMA.
Validation: The candle must show a "dip" (red candle or lower close) to ensure we are buying a pullback, not chasing a top.
Visual: The Dashboard "Action Signal" will turn orange and display "✅ ENTER".
📋 The Checklist Dashboard
Located in the corner of your chart, this table provides a live status report for the current bar:
Trend (> 200 SMA):
🟢 Bullish: Price is in an uptrend. Safe to look for entries.
🔴 Bearish: Price is below the 200 SMA. Stay away.
Above Resistance?:
🟢 Breakout: Price has cleared the multi-month resistance line.
⚪ ---: Price is currently below the key breakout level.
Near 8 EMA?:
🟢 Yes: Price is near the "value zone" (8 EMA) for a potential pullback entry.
Action Signal:
🚀 GAP UP: Strong momentum gap detected.
✅ ENTER: Valid pullback entry detected.
⏳ WAIT: No clear setup found.
⚙️ Settings
Momentum EMA Length: Default is 8. Controls the sensitivity of the pullback line.
Trend SMA Length: Default is 200. The standard for long-term trend filtering.
Gap Up % Threshold: Default is 3.0%. Minimum overnight gap size required to trigger a signal.
Resistance Lookback (Months): Default is 3. The script will look back this many months to find and draw the key resistance line.
Table Position: Move the checklist to any corner of your screen.
⚠️ Disclaimer
This tool is for educational purposes only and does not constitute financial advice. Always manage your risk and use a stop loss.

Liquidity Gravity Engine [Pineify]```markdown
Liquidity Gravity Engine - Market Structure, Displacement, Liquidity Rails
Overview
Liquidity Gravity Engine is a market structure + liquidity visualization indicator designed to help you read flow , impulse , and liquidity magnets on any symbol and timeframe. Instead of relying on a single moving average, it builds a dynamic “flow ribbon” from confirmed swing structure, highlights displacement candles that create imbalance (FVG-style gaps), and projects unmitigated swing levels as liquidity rails that price often revisits.
Key Features
Liquid Flow Ribbon: a structure-based dynamic band that adapts to volatility.
Displacement Highlighting: flags momentum candles that expand beyond ATR and form an imbalance.
Liquidity Rails: extends unmitigated swing highs/lows as potential targets until swept.
Trend Context: displacement is filtered using the ribbon’s smoothed centerline.
How It Works
Market Structure (Swings) : swing highs/lows are detected using pivot logic over your “Structure Lookback”. Pivots become confirmed only after the lookback window completes, which means historical swing points can update until they are confirmed.
Flow Construction : the most recent confirmed swing high and swing low define a top and bottom boundary. Their midpoint is then smoothed with an EMA to create the “liquid” centerline.
Displacement + Imbalance : a candle is considered displacement when its range expands beyond ATR(14) × Displacement Factor and it creates a simple FVG-style gap (current low above the high two bars back for bullish, or current high below the low two bars back for bearish). The bar is then filtered by being on the correct side of the smoothed flow center.
Liquidity Rails : each new confirmed swing high/low can become a dotted rail. Rails extend forward and are removed once price sweeps beyond the level (mitigation), keeping the chart focused on active liquidity.
Trading Ideas and Insights
Use the ribbon as context : bias is stronger when price holds one side of the flow centerline.
Treat displacement markers as impulse confirmation : they often appear at breakout moments or at the start of expansions.
Use liquidity rails as magnets : unmitigated swing highs/lows can act as targets for continuation or mean-reversion moves.
Combine structure + displacement: a sweep into a rail followed by an opposite displacement can hint at a reversal attempt.
How Multiple Components Work Together
This indicator is intentionally built as a single liquidity-driven workflow:
Swings define structure.
Structure defines the flow ribbon (trend/volatility context).
The ribbon filters displacement so you see momentum that aligns with flow.
Liquidity rails provide objective target zones derived from the same swing structure.
The result is a cohesive view of market structure flow, institutional-style displacement, and liquidity targets without stacking multiple separate indicators.
Unique Aspects
Structure-first ribbon: the band is anchored to confirmed swing points, not just a price average.
Imbalance-aware displacement: requires both range expansion and a gap-style condition, reducing generic “big candle” noise.
Self-cleaning liquidity rails: mitigated levels are removed to keep the chart readable.
How to Use
Start with defaults on a clean chart.
Identify the flow: price above the smoothed centerline favors bullish flow; below favors bearish flow.
Watch for displacement diamonds (“D”): they often validate a push away from structure and can mark the start of a leg.
Plan around rails: treat dotted lines as potential objectives and areas where reactions/sweeps can occur.
Customization
Structure Lookback : smaller values = more sensitive swings; larger values = cleaner, slower structure.
Displacement Factor : higher values = fewer, stronger displacement bars; lower values = more signals.
Show Liquidity Rails + Liquidity Lookback : control whether rails are plotted and how active levels are emphasized.
Visuals : adjust bullish/bearish flow colors and liquidity line styling for your chart theme.
Conclusion
Liquidity Gravity Engine helps you map market structure, highlight displacement and imbalance (FVG-style) momentum, and visualize liquidity targets with rails that stay relevant until swept. Use it for trend context, breakout confirmation, and liquidity-based trade planning on forex, crypto, stocks, and indices.

Liquidation Map [Alpha Extract]A sophisticated liquidity distribution visualization system that identifies potential liquidation zones through pivot-based detection and renders them as an interactive histogram with cumulative distance-to-liquidation curves. Utilizing multi-exchange volume aggregation and ATR-scaled pocket detection, this indicator delivers institutional-grade liquidity mapping with real-time histogram display showing relative concentration of long and short liquidation levels across configurable price ranges. The system's box-based rendering architecture combined with cumulative distribution overlays provides comprehensive visual assessment of asymmetric liquidity positioning for strategic trade planning.
🔶 Advanced Multi-Exchange Aggregation Framework
Implements intelligent ticker detection and multi-source volume aggregation across major exchanges including Binance, Bybit, KuCoin, OKX, and MEXC for accurate liquidity weight calculations. The system automatically identifies base currency (BTC, ETH, SOL) from chart ticker, retrieves volume data from matching perpetual contracts across multiple venues, and aggregates into composite volume metric for enhanced pocket weighting accuracy.
🔶 Pivot-Based Liquidation Pocket Detection
Features sophisticated swing point identification using configurable pivot width with ATR-scaled vertical zone construction for volatility-adaptive pocket sizing. The system detects pivot highs for short liquidation zones (placed above swing) and pivot lows for long liquidation zones (placed below swing), applying 200-period ATR with percentage multipliers to determine pocket heights that adjust to market volatility conditions.
🔶 Interactive Histogram Visualization Engine
Provides real-time box-based histogram rendering in indicator pane with configurable bin counts (up to 400 columns) and adjustable height, displaying liquidity concentration across fixed percentage range above and below current price. The system calculates bin sizes from view range, accumulates pocket weights into price bins, and renders vertical bars with gradient color intensity reflecting relative liquidity concentration at each price level.
🔶 Cumulative Distance Overlay System
Implements innovative cumulative distribution curves showing aggregate liquidity distance from current price for both long (left) and short (right) positions. The system calculates running totals of pocket weights from current price outward in both directions, normalizes against maximum span, and overlays line segments showing how much total liquidity exists at various distances, enabling instant assessment of liquidation cascade potential.
🔶 Dynamic Price Range Adaptation
Features fixed percentage-based view window that maintains consistent price range visualization across all timeframes and instruments, automatically centering histogram on current price with configurable +/- percentage bounds. The system recalculates histogram bins and pocket distributions on each bar close, ensuring visualization adapts to price movement while maintaining interpretable scale regardless of volatility regime.
🔶 Touch Detection and Weight Adjustment
Provides intelligent pocket state tracking that identifies when price trades through liquidation zones and applies configurable weight multipliers to touched pockets for historical context. The system monitors price interaction with pocket midpoints, marks pockets as "hit" when violated, and optionally increases their visual weight (default 5x) to emphasize historical liquidation levels while distinguishing from untouched future zones.
🔶 Gradient Intensity Color System
Implements sophisticated color gradient engine that modulates bar opacity from transparent to opaque based on relative liquidity concentration within each bin. The system normalizes bin values against maximum liquidity, applies color interpolation from faded to vivid hues, and distinguishes long liquidation zones (cyan) from short liquidation zones (yellow/gold) with current price column highlighted in red for instant orientation.
🔶 Performance-Optimized Rendering Architecture
Utilizes efficient box and line object management with dynamic allocation based on histogram configuration, implementing intelligent cleanup and reuse to maintain smooth performance. The system includes adaptive line budget calculations that adjust segment density for cumulative curves based on available object limits, ensuring consistent operation even with maximum histogram resolution settings.
🔶 Asymmetric Distribution Analysis
Calculates separate cumulative distributions for long and short liquidation zones split at current price, enabling identification of imbalanced liquidity positioning. The system normalizes distributions against respective maximums and overlays both curves on single histogram, allowing traders to instantly assess whether more liquidation risk exists above (shorts vulnerable) or below (longs vulnerable) current price levels.
🔶 Configurable Label and Scale System
Provides price axis labeling with adjustable frequency to reduce clutter while maintaining reference points, displaying price values at regular column intervals with configurable offset positioning. The system includes current price label showing exact value and percentile position within view range, offering both absolute price reference and relative positioning context for distribution interpretation.
🔶 Historical Pocket Persistence Framework
Maintains rolling window of liquidation pockets up to 3000 bars with automatic expiration management and optional preservation of touched zones for historical analysis. The system tracks pocket creation time, monitors age against lookback limits, and manages array cleanup to prevent memory overflow while retaining relevant historical liquidation levels for pattern recognition and support/resistance validation.
This indicator delivers sophisticated liquidity distribution analysis through histogram visualization and cumulative distance curves that reveal asymmetric positioning of potential liquidation levels. Unlike simple liquidation heatmaps that show absolute levels, the Liquidation Map's cumulative distribution overlays instantly communicate how much total liquidity exists at various distances from current price, enabling assessment of cascade potential. The system's multi-exchange volume aggregation, touch-weighted historical zones, and fixed-range visualization make it essential for traders seeking strategic positioning around institutional liquidity clusters in cryptocurrency futures markets. The histogram format enables instant identification of price levels where concentrated liquidations may trigger significant volatility or reversal events, while the asymmetric distribution curves reveal whether market structure favors upside or downside cascades.


Adaptive Trend Envelope [BackQuant]Adaptive Trend Envelope
Overview
Adaptive Trend Envelope is a volatility-aware trend-following overlay designed to stay responsive in fast markets while remaining stable during slower conditions. It builds a dynamic trend spine from two exponential moving averages and surrounds it with an adaptive envelope whose width expands and contracts based on realized return volatility. The result is a clean, self-adjusting trend structure that reacts to market conditions instead of relying on fixed parameters.
This indicator is built to answer three core questions directly on the chart:
Is the market trending or neutral?
If trending, in which direction is the dominant pressure?
Where is the dynamic trend boundary that price should respect?
Core trend spine
At the heart of the indicator is a blended trend spine:
A fast EMA captures short-term responsiveness.
A slow EMA captures structural direction.
A volatility-based blend weight dynamically shifts influence between the two.
When short-term volatility is low relative to long-term volatility, the fast EMA has more influence, keeping the trend responsive. When volatility rises, the blend shifts toward the slow EMA, reducing noise and preventing overreaction. This blended output is then smoothed again to form the final trend spine, which acts as the structural backbone of the system.
Volatility-adaptive envelope
The envelope surrounding the trend spine is not based on ATR or fixed percentages. Instead, it is derived from:
Log returns of price.
An exponentially weighted variance estimate.
A configurable multiplier that scales envelope width.
This creates bands that automatically widen during volatile expansions and tighten during compression. The envelope therefore reflects the true statistical behavior of price rather than an arbitrary distance.
Inner hysteresis band
Inside the main envelope, an inner band is constructed using a hysteresis fraction. This inner zone is used to stabilize regime transitions:
It prevents rapid flipping between bullish and bearish states.
It allows trends to persist unless price meaningfully invalidates them.
It reduces whipsaws in sideways conditions.
Trend regime logic
The indicator operates with three regime states:
Bullish
Bearish
Neutral
Regime changes are confirmed using a configurable number of bars outside the adaptive envelope:
A bullish regime is confirmed when price closes above the upper envelope for the required number of bars.
A bearish regime is confirmed when price closes below the lower envelope for the required number of bars.
A trend exits back to neutral when price reverts through the trend spine.
This structure ensures that trends are confirmed by sustained pressure rather than single-bar spikes.
Active trend line
Once a regime is active, the indicator plots a single dominant trend line:
In a bullish regime, the lower envelope becomes the active trend support.
In a bearish regime, the upper envelope becomes the active trend resistance.
In neutral conditions, price itself is used as a placeholder.
This creates a simple, actionable visual reference for trend-following decisions.
Directional energy visualization
The indicator uses layered fills to visualize directional pressure:
Bullish energy fills appear when price holds above the active trend line.
Bearish energy fills appear when price holds below the active trend line.
Opacity gradients communicate strength and persistence rather than binary states.
A subtle “rim” effect is added using ATR-based offsets to give depth and reinforce the active side of the trend without cluttering the chart.
Signals and trend starts
Discrete signals are generated only when a new trend regime begins:
Buy signals appear at the first confirmed transition into a bullish regime.
Sell signals appear at the first confirmed transition into a bearish regime.
Signals are intentionally sparse. They are designed to mark regime shifts, not every pullback or continuation, making them suitable for higher-quality trend entries rather than frequent trading.
Candle coloring
Optional candle coloring reinforces regime context:
Bullish regimes tint candles toward the bullish color.
Bearish regimes tint candles toward the bearish color.
Neutral states remain visually muted.
This allows the chart to communicate trend state even when the envelope itself is partially hidden or de-emphasized.
Alerts
Built-in alerts are provided for key trend events:
Bull trend start.
Bear trend start.
Transition from trend to neutral.
Price crossing the trend spine.
These alerts support hands-off trend monitoring across multiple instruments and timeframes.
How to use it for trend following
Trend identification
Only trade in the direction of the active regime.
Ignore counter-trend signals during confirmed trends.
Entry alignment
Use the first regime signal as a structural entry.
Use pullbacks toward the active trend line as continuation opportunities.
Trend management
As long as price respects the active envelope boundary, the trend remains valid.
A move back through the spine signals loss of trend structure.
Market filtering
Periods where the indicator remains neutral highlight non-trending environments.
This helps avoid forcing trades during chop or compression.
Adaptive Trend Envelope is designed to behave like a living trend structure. Instead of forcing price into static rules, it adapts to volatility, confirms direction through sustained pressure, and presents trend information in a clean, readable form that supports disciplined trend-following workflows.

Goal Setting Strategies Viprasol# 🎯 Goal Setting Strategies Viprasol
A powerful goal tracking tool designed for disciplined traders who want to monitor their trading objectives, milestones, and progress directly on their charts.
## ✨ KEY FEATURES
### 📊 Flexible Goal Management
- Track anywhere from 1 to 20 trading goals simultaneously
- Adjustable goal count via simple input slider
- Each goal has its own unique emoji identifier
- Real-time progress counter
### ✅ Visual Tracking System
- Interactive checkbox system for goal completion
- Clear visual indicators (✅ completed, ⬜️ pending)
- Customizable goal names and descriptions
- Dynamic progress display
### 🎨 Full Customization
- **4 Position Options**: Top Left, Top Right, Bottom Left, Bottom Right
- **5 Font Sizes**: Tiny, Small, Normal, Large, Huge (optimized for all screen sizes)
- **Custom Colors**: Header, labels, background, achievement text
- **Premium Styling**: Modern cyber-themed design with professional appearance
### 💡 Perfect For:
- Daily/Weekly trading goal tracking
- Risk management milestones
- Profit target monitoring
- Trading plan compliance
- Personal development objectives
- Learning milestones
## 🔧 HOW TO USE
1. **Set Your Primary Goal**: Enter your main objective in "Primary Goal" field
2. **Choose Goal Count**: Select how many goals you want (1-20)
3. **Name Your Goals**: Customize each goal name in the "Goal Definitions" section
4. **Track Progress**: Check off goals as you complete them
5. **Customize Display**: Adjust colors, sizes, and position to match your chart setup
## 📐 INPUT GROUPS
### 🎯 Viprasol Goal Configuration
- Primary Goal Name
- Number of Goals (1-20)
### 📋 Goal Definitions
- All 20 goals with individual names and checkboxes
- Only enabled goals (based on count) will display
### 🌈 Premium Styling
- Goal Header Color
- Label Color
- Panel Background Color
- Achievement Color
- Header Font Size
- Milestone Font Size (Tiny/Small optimized for space)
### 📍 Elite Display
- Dashboard Position selector
## 💎 UNIQUE FEATURES
- **Space Efficient**: Tiny and Small font options for compact displays
- **Scalable**: Grow from 1 goal to 20 as your needs evolve
- **Non-Intrusive**: Overlay indicator that doesn't interfere with price action
- **Professional Design**: Clean, modern interface with cyber aesthetic
## 🎓 USE CASES
**Day Traders**: Track daily profit targets, trade count limits, max loss thresholds
**Swing Traders**: Monitor weekly/monthly goals, position management rules
**New Traders**: Learning milestones, strategy development checkpoints
**Experienced Traders**: Advanced risk management, portfolio objectives
## ⚙️ TECHNICAL DETAILS
- Version: Pine Script v5
- Type: Overlay Indicator
- Max Labels: 500
- Table-based display system
- No repainting
- Lightweight performance
## 🚀 GETTING STARTED
1. Add indicator to your chart
2. Set "Number of Goals" to your desired count (start small, scale up)
3. Customize goal names
4. Check boxes as you achieve goals
5. Watch your progress build!
## 📊 DISPLAY OPTIMIZATION
- Use "Tiny" or "Small" for maximum goals on small screens
- Use "Normal" or "Large" for standard monitors
- Use "Huge" for presentation or large displays
- Adjust position to avoid chart overlap
## 🎯 TRADING DISCIPLINE
This tool helps reinforce:
- Goal-oriented trading mindset
- Progress tracking accountability
- Milestone celebration
- Structured approach to trading development
---
**© viprasol**
*Designed for traders who take their goals seriously.*

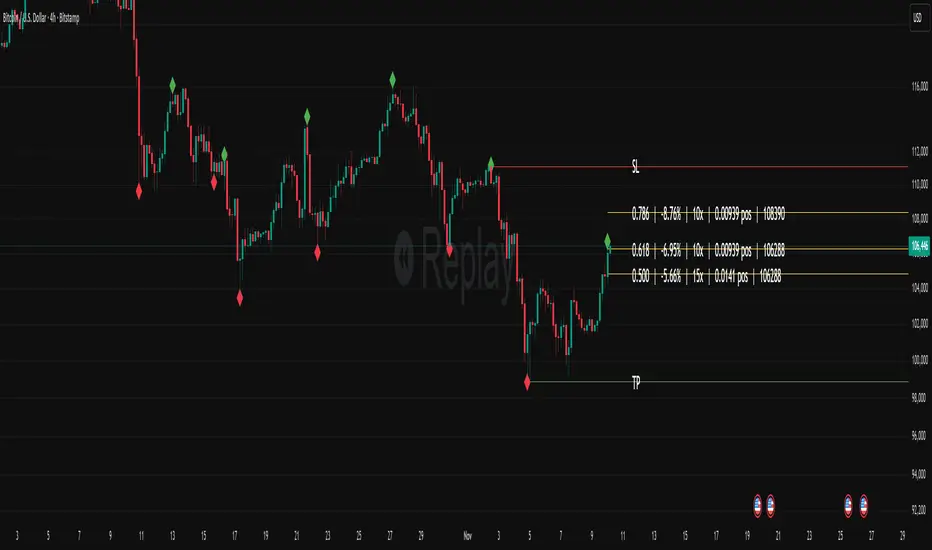
Fibonacci Set-upThe indicator plots Fibonacci retracements based on recent lows and highs.
Additionally it calculates position size, max leverage, max drawdown and pricelevels.
AG Pro Dynamic ChannelsAG Pro Dynamic Channels V2
Discover a new lens through which to view market structure with the AG Pro Dynamic Channels V2. This advanced indicator moves beyond simple trendlines, automatically identifying, classifying, and drawing eight distinct types of support and resistance channels directly on your chart.
Built on a sophisticated pivot-point detection engine, this script intelligently distinguishes between Major and Minor price structures, as well as Internal and External channels. This provides a comprehensive and multi-dimensional map of the market's flow, helping you identify trend continuations, corrections, and potential reversals.
The indicator is complete with a powerful, fully customizable alert system designed to notify you of the two most critical events: channel breakouts and price reactions.
Key Features
Fully Automatic Channels: The script automatically analyzes price action to find pivot highs and lows, using them to construct relevant channels without any manual drawing required.
8-Channel Classification: Gain deep market insight by viewing eight distinct channel types:
Major External (Up/Down)
Major Internal (Up/Down)
Minor External (Up/Down)
Minor Internal (Up/Down)
Advanced Pivot Engine: The core logic classifies pivots into categories like Higher Highs (MHH/mHH), Lower Lows (MLL/mLL), Higher Lows (MHL/mHL), and Lower Highs (MLH/mLH) to determine the precise start and end points for each channel.
Deep Customization: Take full control of your chart's appearance. You can individually toggle the visibility, color, line style (solid, dashed, dotted), and line width for all eight channel types.
Chart Clarity: A "Delete Previous" option is available for each channel type, allowing you to keep your chart clean and focused on only the most current and relevant market structures.
Comprehensive Alert System
Never miss a key price interaction. The AG Pro Dynamic Channels V2 features a robust, built-in alert module.
Dual-Alert Conditions: Get notifications for two distinct events:
Break Alert: Triggers when price confirms a close outside of a channel, signaling a potential breakout.
React Alert: Triggers when price touches or interacts with a channel line before closing back inside, signaling a test or rejection.
16 Unique Alerts: You have full control to enable or disable "Break" and "React" alerts for all 8 channel types individually, giving you 16 unique alert conditions to monitor.
Professional Alert Messages: The embedded alert sender provides detailed messages that include the asset, timeframe, and the specific event, such as "Break Major External Up Channel" or "React Minor Internal Down Channel".
Alert Configuration: Easily set your global Alert Name, Message Frequency (e.g., Once Per Bar, Once Per Bar Close), and Alert Time Zone from the script's settings.
How to Use
Trend Identification: Use the Major External Channels (drawn from MHH and MLL pivots) to identify the primary, long-term trend direction.
Pullback & Entry Zones: Use the Internal Channels (drawn from MHL and MLH pivots) to spot corrections and potential entry zones within an established trend.
Breakout Trading: Set Break Alerts on Major channels to be notified of significant, structure-shifting moves.
Short-Term & Counter-Trend: Utilize the Minor Channels to identify shorter-term price swings and potential reversal points.

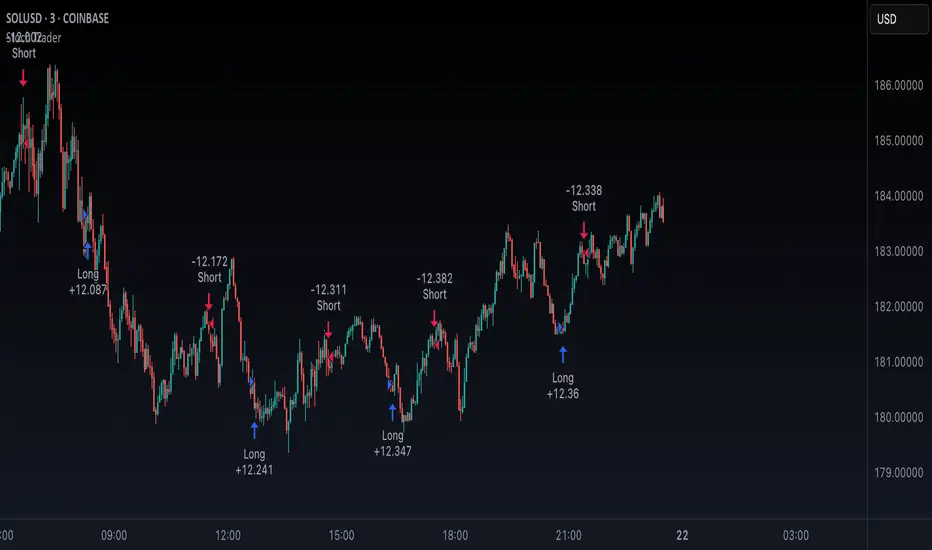
Stoch TraderSimple example strategy that has greater than 60% win rate on 1m, 3m, and 5m views. Using something as simple as this with leverage can produce decent returns within 15-30min. It's also very easy to lose money doing this.
Session Visualizer by Timezone (Fixed)Session Visualizer by Timezone (Asia, London, New York)
This indicator highlights the Asian, London, and New York trading sessions directly on your chart — adjusted to your local timezone (via UTC offset).
🔧 Key Features:
Session times automatically adjust based on your chosen UTC offset
Toggle each session on/off individually
Custom background colors for each session
Designed for all intraday timeframes (1m – 4H)
📍 Sessions Covered:
Asian Session – Generally lower volatility and slower price movement; ideal for range traders and pre-positioning
London Session – Marked increase in volatility as European markets open
New York Session – Highest volume and volatility, especially during the London-New York overlap
🕓 Time Offset Setting:
Input your local UTC offset (e.g., UTC+10 for Sydney, UTC+1 for Berlin, UTC-5 for New York). The indicator adjusts session display accordingly.

TradePlanner ProPlan smarter. Trade with precision.
TradePlanner Pro is a professional-grade overlay tool designed to streamline your trading decisions by visually organizing your trade plans directly on the chart. Built for traders who value preparation and clarity, this script enables precise entry planning, risk management, and target visualization—all tailored per symbol.
Core Purpose
TradePlanner Pro helps you map out potential trades using pre-defined symbol-based presets. It dynamically calculates position sizes based on your account size or fixed risk, then visualizes key trade levels (Entry, Take Profits, Stop Loss) with profit/loss metrics in both dollar and percentage terms. It's the perfect companion for traders who prepare their setups in advance and want their plans clearly represented on the chart.
Key Features
🔹 Per-Symbol Presets: Define entries, up to 3 take-profit levels, and stop-losses for each ticker.
🔹 Dynamic Risk Sizing: Choose between percentage-based risk or fixed dollar risk per trade.
🔹 Visual Trade Mapping: Automatically plots Entry, TP1–TP3, and SL lines on your chart.
🔹 Real-Time P&L Labels: Displays profit/loss amounts and percentages, with optional R/R ratios.
🔹 Custom Investment Display: Shows how much capital is allocated per trade.
🔹 Clean, Configurable UI: Adjust label positions, font sizes, opacity, and label visibility to match your style.
Whether you're swing trading or day trading, TradePlanner Pro helps you stay disciplined, organized, and confident in your execution.
How to Use TradePlanner Pro – Step-by-Step Guide
TradePlanner Pro is designed to be easy to set up while giving you full control over how your trades are visualized and calculated. Here’s how to get started:
1. Start with Default Settings
By default, the script assumes:
Account Size: $10,000
Max Money per Trade (%): 1.0%
Max Risk (USD): 0 (disabled; only percentage risk is used)
This means the script will size each trade to risk 1% of your account balance per trade unless you override it with a fixed USD risk amount.
2. Set Up Your Symbol Presets
The "Symbol Presets" input is a flexible text area where you define trade setups for each ticker.
Format (one per line):
SYMBOL:Entry,TP1 ,SL
Example:
AAPL:250,260,270,240
MSFT:100,110,90
TSLA:180,200,170
You can include 1 to 3 take-profit levels.
The script will only activate for the current chart’s symbol, matching what's listed.
3. Customize Risk Parameters
You can use:
Account % Risk – Based on account size and % risk.
Fixed USD Risk – When a dollar amount is entered (>0), it takes priority and calculates share size based on the risk per share.
There's also an option to round share quantities down to whole units, which is useful for stock or crypto trading platforms that only allow whole-number units.
4. Choose What to Display
Toggle on/off these elements as needed:
Show Entry/TP/SL Lines
Show P&L Labels – Profit/loss amounts at each target and SL.
Show Amount Invested – Includes total dollar value in the quantity label.
Show Percentages – Adds % gain/loss to each label.
Show Risk/Reward Ratios – Optionally displayed beside or below TP labels.
You can further adjust:
Font size and label opacity
Label position offset – In percent of price range, so they don’t overlap the actual levels.
5. Read the Visual Outputs
Once the preset matches the current chart symbol:
Lines will appear for Entry, TP1-TP3, and Stop Loss.
Labels will display your:
Trade quantity (and invested amount)
Dollar and % profit at each target
Total loss at stop loss
Optional R/R ratios
Everything updates dynamically and adjusts to your current chart scale and bar availabilit

Bollinger Bounce Reversal Strategy – Visual EditionOverview:
The Bollinger Bounce Reversal Strategy – Visual Edition is designed to capture potential reversal moves at price extremes—often termed “bounce points”—by using a combination of technical indicators. The strategy integrates Bollinger Bands, MACD, and volume analysis, and it provides rich on‑chart visual cues to help traders understand its signals and conditions. Additionally, the strategy enforces a maximum of 5 trades per day and uses fixed risk management parameters. This publication is intended for educational purposes and offers a systematic, transparent approach that you can further adjust to fit your market or risk profile.
How It Works:
Bollinger Bands:
A 20‑period simple moving average (SMA) and a user‑defined standard deviation multiplier (default 2.0) are used to calculate the Bollinger Bands.
When the price reaches or crosses these bands (i.e. falls below the lower band or rises above the upper band), it suggests that the price is in an extreme, potentially oversold or overbought, state.
MACD Filter:
The MACD (calculated with standard lengths, e.g. 12, 26, 9) provides momentum information.
For a bullish (long) signal, the MACD line should be above its signal line; for a bearish (short) signal, the MACD line should be below.
Volume Confirmation:
The strategy uses a 20‑period volume moving average to determine if current volume is strong enough to validate a signal.
A signal is confirmed only if the current volume is at or above a specified multiple (by default, 1.0×) of this moving average, ensuring that the move is supported by increased market participation.
Visual Cues:
Bollinger Bands and Fill: The basis (SMA), upper, and lower Bollinger Bands are plotted, and the area between the upper and lower bands is filled with a semi‑transparent color.
Signal Markers: When a long or short signal is generated, corresponding markers (labels) appear on the chart.
Background Coloring: The chart’s background changes color (green for long signals and red for short signals) on the bars where signals occur.
Information Table: An on‑chart table displays key indicator values (MACD, signal line, volume, average volume) and the number of trades executed that day.
Entry Conditions:
Long Entry:
A long trade is triggered when the previous bar’s close is below the lower Bollinger Band and the current bar’s close crosses above it, combined with a bullish MACD condition and strong volume.
Short Entry:
A short trade is triggered when the previous bar’s close is above the upper Bollinger Band and the current bar’s close crosses below it, with a bearish MACD condition and high volume.
Risk Management:
Daily Trade Limit: The strategy restricts trading to no more than 5 trades per day.
Stop-Loss and Take-Profit:
For each position, a stop loss is set at a fixed percentage away from the entry price (typically 2%), and a take profit is set to target a 1:2 risk-reward ratio (typically 4% from the entry price).
Backtesting Setup:
Initial Capital: $10,000
Commission: 0.1% per trade
Slippage: 1 tick per bar
These realistic parameters help ensure that backtesting results reflect the conditions of an average trader.
Disclaimer:
Past performance is not indicative of future results. This strategy is experimental and provided solely for educational purposes. It is essential to backtest extensively and paper trade before any live deployment. All risk management practices are advisory, and you should adjust parameters to suit your own trading style and risk tolerance.
Conclusion:
By combining Bollinger Bands, MACD, and volume analysis, the Bollinger Bounce Reversal Strategy – Visual Edition provides a clear, systematic method to identify potential reversal opportunities at price extremes. The added visual cues help traders quickly interpret signals and assess market conditions, while strict risk management and a daily trade cap help keep trading disciplined. Adjust and refine the settings as needed to better suit your specific market and risk profile.

Volatility Momentum Breakout StrategyDescription:
Overview:
The Volatility Momentum Breakout Strategy is designed to capture significant price moves by combining a volatility breakout approach with trend and momentum filters. This strategy dynamically calculates breakout levels based on market volatility and uses these levels along with trend and momentum conditions to identify trade opportunities.
How It Works:
1. Volatility Breakout:
• Methodology:
The strategy computes the highest high and lowest low over a defined lookback period (excluding the current bar to avoid look-ahead bias). A multiple of the Average True Range (ATR) is then added to (or subtracted from) these levels to form dynamic breakout thresholds.
• Purpose:
This method helps capture significant price movements (breakouts) while ensuring that only past data is used, thereby maintaining realistic signal generation.
2. Trend Filtering:
• Methodology:
A short-term Exponential Moving Average (EMA) is applied to determine the prevailing trend.
• Purpose:
Long trades are considered only when the current price is above the EMA, indicating an uptrend, while short trades are taken only when the price is below the EMA, indicating a downtrend.
3. Momentum Confirmation:
• Methodology:
The Relative Strength Index (RSI) is used to gauge market momentum.
• Purpose:
For long entries, the RSI must be above a mid-level (e.g., above 50) to confirm upward momentum, and for short entries, it must be below a similar threshold. This helps filter out signals during overextended conditions.
Entry Conditions:
• Long Entry:
A long position is triggered when the current closing price exceeds the calculated long breakout level, the price is above the short-term EMA, and the RSI confirms momentum (e.g., above 50).
• Short Entry:
A short position is triggered when the closing price falls below the calculated short breakout level, the price is below the EMA, and the RSI confirms momentum (e.g., below 50).
Risk Management:
• Position Sizing:
Trades are sized to risk a fixed percentage of account equity (set here to 5% per trade in the code, with each trade’s stop loss defined so that risk is limited to approximately 2% of the entry price).
• Stop Loss & Take Profit:
A stop loss is placed a fixed ATR multiple away from the entry price, and a take profit target is set to achieve a 1:2 risk-reward ratio.
• Realistic Backtesting:
The strategy is backtested using an initial capital of $10,000, with a commission of 0.1% per trade and slippage of 1 tick per bar—parameters chosen to reflect conditions faced by the average trader.
Important Disclaimers:
• No Look-Ahead Bias:
All breakout levels are calculated using only past data (excluding the current bar) to ensure that the strategy does not “peek” into future data.
• Educational Purpose:
This strategy is experimental and provided solely for educational purposes. Past performance is not indicative of future results.
• User Responsibility:
Traders should thoroughly backtest and paper trade the strategy under various market conditions and adjust parameters to fit their own risk tolerance and trading style before live deployment.
Conclusion:
By integrating volatility-based breakout signals with trend and momentum filters, the Volatility Momentum Breakout Strategy offers a unique method to capture significant price moves in a disciplined manner. This publication provides a transparent explanation of the strategy’s components and realistic backtesting parameters, making it a useful tool for educational purposes and further customization by the TradingView community.

Advanced Multi-Timeframe Trading System (Risk Managed)Description:
This strategy is an original approach that combines two main analytical components to identify potential trade opportunities while simulating realistic trading conditions:
1. Market Trend Analysis via an Approximate Hurst Exponent
• What It Does:
The strategy computes a rough measure of market trending using an approximate Hurst exponent. A value above 0.5 suggests persistent, trending behavior, while a value below 0.5 indicates a tendency toward mean-reversion.
• How It’s Used:
The Hurst exponent is calculated on both the chart’s current timeframe and a higher timeframe (default: Daily) to capture both local and broader market dynamics.
2. Fibonacci Retracement Levels
• What It Does:
Using daily high and low data from a selected timeframe (default: Daily), the script computes key Fibonacci retracement levels.
• How It’s Used:
• The 61.8% level (Golden Ratio) serves as a key threshold:
• A long entry is signaled when the price crosses above this level if the daily Hurst exponent confirms a trending market.
• The 38.2% level is used to identify short-entry opportunities when the price crosses below it and the daily Hurst indicates non-trending conditions.
Signal Logic:
• Long Entry:
When the price crosses above the 61.8% Fibonacci level (Golden Ratio) and the daily Hurst exponent is greater than 0.5, suggesting a trending market.
• Short Entry:
When the price crosses below the 38.2% Fibonacci level and the daily Hurst exponent is less than 0.5, indicating a less trending or potentially reversing market.
Risk Management & Trade Execution:
• Stop-Loss:
Each trade is risk-managed with a stop-loss set at 2% below (for longs) or above (for shorts) the entry price. This ensures that no single trade risks more than a small, sustainable portion of the account.
• Take Profit:
A take profit order targets a risk-reward ratio of 1:2 (i.e., the target profit is twice the amount risked).
• Position Sizing:
Trades are executed with a fixed position size equal to 10% of account equity.
• Trade Frequency Limits:
• Daily Limit: A maximum of 5 trades per day
• Overall Limit: No more than 510 trades during the backtesting period (e.g., since 2019)
These limits are imposed to simulate realistic trading frequency and to avoid overtrading in backtest results.
Backtesting Parameters:
• Initial Capital: $10,000
• Commission: 0.1% per trade
• Slippage: 1 tick per bar
These settings aim to reflect the conditions faced by the average trader and help ensure that the backtesting results are realistic and not misleading.
Chart Overlays & Visual Aids:
• Fibonacci Levels:
The key Fibonacci retracement levels are plotted on the chart, and the zone between the 61.8% and 38.2% levels is highlighted to show a key retracement area.
• Market Trend Background:
The chart background is tinted green when the daily Hurst exponent indicates a trending market (value > 0.5) and red otherwise.
• Information Table:
An on-chart table displays key parameters such as the current Hurst exponent, daily Hurst value, the number of trades executed today, and the global trade count.
Disclaimer:
Past performance is not indicative of future results. This strategy is experimental and provided solely for educational purposes. It is essential that you backtest and paper trade using your own settings before considering any live deployment. The Hurst exponent calculation is an approximation and should be interpreted as a rough gauge of market behavior. Adjust the parameters and risk management settings according to your personal risk tolerance and market conditions.
Additional Notes:
• Originality & Usefulness:
This script is an original mashup that combines trend analysis with Fibonacci retracement methods. The description above explains how these components work together to provide trading signals.
• Realistic Results:
The strategy uses realistic account sizes, commission rates, slippage, and risk management rules to generate backtesting results that are representative of real-world trading.
• Educational Purpose:
This script is intended to support the TradingView community by offering insights into combining multiple analysis techniques in one strategy. It is not a “get-rich-quick” system but rather an educational tool to help traders understand risk management and trade signal logic.
By using this script, you acknowledge that trading involves risk and that you are responsible for testing and adjusting the strategy to fit your own trading environment. This publication is fully open source, and any modifications should include proper attribution if significant portions of the code are reused.

Ultra Trade JournalThe Ultra Trade Journal is a powerful TradingView indicator designed to help traders meticulously document and analyze their trades. Whether you're a novice or an experienced trader, this tool offers a clear and organized way to visualize your trading strategy, monitor performance, and make informed decisions based on detailed trade metrics.
Detailed Description
The Ultra Trade Journal indicator allows users to input and visualize critical trade information directly on their TradingView charts.
.........
User Inputs
Traders can specify entry and exit prices , stop loss levels, and up to four take profit targets.
.....
Dynamic Plotting
Once the input values are set, the indicator automatically plots horizontal lines for entry, exit, stop loss, and each take profit level on the chart. These lines are visually distinct, using different colors and styles (solid, dashed, dotted) to represent each element clearly.
.....
Live Position Tracking
If enabled, the indicator can adjust the exit price in real-time based on the current market price, allowing traders to monitor live positions effectively.
.....
Tick Calculations
The script calculates the number of ticks between the entry price and each exit point (stop loss and take profits). This helps in understanding the movement required for each target and assessing the potential risk and reward.
.....
Risk-Reward Ratios
For each take profit level, the indicator computes the risk-reward (RR) ratio by comparing the ticks at each target against the stop loss ticks. This provides a quick view of the potential profitability versus the risk taken.
.....
Comprehensive Table Display
A customizable table is displayed on the chart, summarizing all key trade details. This includes the entry and exit prices, stop loss and take profit levels, tick counts, and their respective RR ratios.
Users can adjust the table's Position and text color to suit their preferences.
.....
Visual Enhancements
The indicator uses adjustable background shading between entry and stop loss/take profit lines to visually represent potential trade outcomes. This shading adjusts based on whether the trade is long or short, providing an intuitive understanding of trade performance.
.........
Overall, the Ultra Trade Journal combines visual clarity with detailed analytics, enabling traders to keep a well-organized record of their trades and enhance their trading strategies through insightful data.

Alert Kabi Family Unlimited Alarm indicator for any time frame and any type of currency, stock and index
اندییکاتور آلارم نامحدود برای هر تایم فریم و هر شاخص و ارز و سهام
Settings :
1- Before starting, clear all alarms in the trading view alarm section
2- Specify your alarm areas and currency pairs in the indicator settings section
3- Go to the trading view alarm section, click create alert, select the name of the indicator and click OK
4- Good Luck
T e L : @Ar3781
1- قبل از شروع تمام آلارم های تریدینگ ویو را پاک کنید
2- در قسمت تنظیمات اندیکاتور نواحی آلارم و جفت ارز خود را مشخص کنید
3- به قسمت الارم تریدینگ ویو رفته ایجاد هشدار را زده و اسم اندیکاتور را انتخاب کنید و اوکی کنید
4- مـــــــوفق بــــــاشـید

Confirmed market structure buy/sell indicatorOverview
The Swing Point Breakout Indicator with Multi-Timeframe Dashboard is a TradingView tool designed to identify potential buy and sell signals based on swing point breakouts on the primary chart's timeframe while simultaneously providing a snapshot of the market structure across multiple higher timeframes. This dual approach helps traders make informed decisions by aligning short-term signals with broader market trends.
Key Features
Swing Point Breakout Detection
Swing Highs and Lows: Identifies significant peaks and troughs based on a user-defined lookback period.
Breakout Signals:
Bullish Breakout (Buy Signal): Triggered when the price closes above the latest swing high.
Bearish Breakout (Sell Signal): Triggered when the price closes below the latest swing low.
Visual Indicators: Highlights breakout bars with colors (lime for bullish, red for bearish) and plots buy/sell markers on the chart.
Multi-Timeframe Dashboard
Timeframes Monitored: 1m, 5m, 15m, 1h, 4h, 1D, and 1W.
Market Structure Status:
Bullish: Indicates upward market structure.
Bearish: Indicates downward market structure.
Neutral: No clear trend.
Visual Table: Displays each timeframe with its current status, color-coded for quick reference (green for bullish, red for bearish, gray for neutral).
Operational Workflow
Initialization:
Sets up a dashboard table on the chart's top-right corner with headers "Timeframe" and "Status".
Swing Point Detection:
Continuously scans the main timeframe for swing highs and lows using the specified lookback period.
Updates the latest swing high and low levels.
Signal Generation:
Detects when the price breaks above the last swing high (bullish) or below the last swing low (bearish).
Activates potential buy/sell setups and confirms signals based on subsequent price movements.
Dashboard Update:
For each defined higher timeframe, assesses the market structure by checking for breakouts of swing points.
Updates the dashboard with the current status for each timeframe, aiding in trend confirmation.
Visualization:
Colors the bars where breakouts occur.
Plots buy and sell signals directly on the chart for easy identification.

Adaptive VWAP [QuantAlgo]Introducing the Adaptive VWAP by QuantAlgo 📈🧬
Enhance your trading and investing strategies with the Adaptive VWAP , a versatile tool designed to provide dynamic insights into market trends and price behavior. This indicator offers a flexible approach to VWAP calculations by allowing users to adapt it based on lookback periods or fixed timeframes, making it suitable for a wide range of market conditions.
🌟 Key Features:
🛠 Customizable VWAP Settings: Choose between an adaptive VWAP that adjusts based on a rolling lookback period, or switch to a fixed timeframe (e.g., daily, weekly, monthly) for a more structured approach. Adjust the VWAP to suit your trading or investing style.
💫 Dynamic Bands and ATR Filter: Configurable deviation bands with multipliers allow you to visualize price movement around VWAP, while an ATR-based noise filter helps reduce false signals during periods of market fluctuation.
🎨 Trend Visualization: Color-coded trend identification helps you easily spot uptrends and downtrends based on VWAP positioning. The indicator fills the areas between the bands for clearer visual representation of price volatility and trend strength.
🔔 Custom Alerts: Set up alerts for when price crosses above or below the VWAP, signaling potential uptrend or downtrend opportunities. Stay informed without needing to monitor the charts constantly.
✍️ How to Use:
✅ Add the Indicator: Add the Adaptive VWAP to your favourites and apply to your chart. Choose between adaptive or timeframe-based VWAP calculation, adjust the lookback period, and configure the deviation bands to your preferred settings.
👀 Monitor Bands and Trends: Watch for price interaction with the VWAP and its deviation bands. The color-coded signals and band fills help identify potential trend shifts or price extremes.
🔔 Set Alerts: Configure alerts for uptrend and downtrend signals based on price crossing the VWAP, so you’re always informed of significant market movements.
⚙️ How It Works:
The Adaptive VWAP adjusts its calculation based on the user’s chosen configuration, allowing for a flexible approach to market analysis. The adaptive setting uses a rolling lookback period to continuously adjust the VWAP, while the fixed timeframe option anchors VWAP to key timeframes like daily, weekly, or monthly periods. This flexibility enables traders and investors to use the tool in various market environments.
Deviation bands, calculated with customizable multipliers, provide a clear visual of how far the price has moved from the VWAP, helping you gauge potential overbought or oversold conditions. To reduce false signals, an ATR-based filter can be applied, ensuring that only significant price movements trigger trend confirmations.
The tool also includes a fast exponential smoothing function for the VWAP, helping smooth out price fluctuations without sacrificing responsiveness. Trend confirmation is reinforced by the number of bars that price stays above or below the VWAP, ensuring a more consistent trend identification process.
Disclaimer:
The Adaptive VWAP is designed to enhance your market analysis but should not be relied upon as the sole basis for trading or investing decisions. Always combine it with other analytical tools and practices. No statements or signals from this indicator constitute financial advice. Past performance is not indicative of future results.

Volatility-Adjusted DEMA Supertrend [QuantAlgo]Introducing the Volatility-Adjusted DEMA Supertrend by QuantAlgo 📈💫
Take your trading and investing strategies to the next level with the Volatility-Adjusted DEMA Supertrend , a dynamic tool designed to adapt to market volatility and provide clear, actionable trend signals. This innovative indicator is ideal for both traders and investors looking for a more responsive approach to market trends, helping you capture potential shifts with greater precision.
🌟 Key Features:
🛠 Customizable Trend Settings: Adjust the period for trend calculation and fine-tune the sensitivity to price movements. This flexibility allows you to tailor the Supertrend to your unique trading or investing strategy, whether you're focusing on shorter or longer timeframes.
📊 Volatility-Responsive Multiplier: The Supertrend dynamically adjusts its sensitivity based on real-time market volatility. This could help filter out noise in calmer markets and provide more accurate signals during periods of heightened volatility.
✨ Trend-Based Color-Coding: Visualize bullish and bearish trends with ease. The indicator paints candles and plots trend lines with distinct colors based on the current market direction, offering quick, clear insights into potential opportunities.
🔔 Custom Alerts: Set up alerts for key trend shifts to ensure you're notified of significant market changes. These alerts would allow you to act swiftly, potentially capturing opportunities without needing to constantly monitor the charts.
📈 How to Use:
✅ Add the Indicator: Add the Volatility-Adjusted DEMA Supertrend to your chart. Customize the trend period, volatility settings, and price source to match your trading or investing style. This ensures the indicator aligns with your market strategy.
👀 Monitor Trend Shifts: Watch the color-coded trend lines and candles as they dynamically shift based on real-time market conditions. These visual cues help you spot potential trend reversals and confirm your entries and exits with greater confidence.
🔔 Set Alerts: Configure alerts for key trend shifts, allowing you to stay informed of potential market reversals or continuation patterns, even when you're not actively watching the market.
⚙️ How It Works:
The Volatility-Adjusted DEMA Supertrend is designed to adapt to changes in market conditions, making it highly responsive to price volatility. The indicator calculates a trend line based on price and volatility, dynamically adjusting it to reflect recent market behavior. When the market experiences higher volatility, the trend line becomes more flexible, potentially allowing for greater sensitivity to rapid price movements. Conversely, during periods of low volatility, the indicator tightens its range, helping to reduce noise and avoid false signals.
The indicator includes a volatility-responsive multiplier, which further enhances its adaptability to market conditions. This means the trend direction would always be based on the latest market data, potentially helping you stay ahead of shifts or continuation trends. The Supertrend's visual color-coding simplifies the process of identifying bullish or bearish trends, while customizable alerts ensure you can stay on top of significant changes in market direction.
This tool is versatile and could be applied across various markets and timeframes, making it a valuable addition for both traders and investors. Whether you’re trading in fast-moving markets or focusing on longer-term investments, the Volatility-Adjusted DEMA Supertrend could help you remain aligned with the current market environment.
Disclaimer:
This indicator is designed to enhance your analysis by providing trend information, but it should not be used as the sole basis for making trading or investing decisions. Always combine it with other forms of analysis and risk management practices. No statements or claims aim to be financial advice, and no signals from us or our indicators should be interpreted as such. Past performance is not indicative of future results.

Fibonacci-Only StrategyFibonacci-Only Strategy
This script is a custom trading strategy designed for traders who leverage Fibonacci retracement levels to identify potential trade entries and exits. The strategy is versatile, allowing users to trade across multiple timeframes, with built-in options for dynamic stop loss, trailing stops, and take profit levels.
Key Features:
Custom Fibonacci Levels:
This strategy calculates three specific Fibonacci retracement levels: 19%, 82.56%, and the reverse 19% level. These levels are used to identify potential areas of support and resistance where price reversals or breaks might occur.
The Fibonacci levels are calculated based on the highest and lowest prices within a 100-bar period, making them dynamic and responsive to recent market conditions.
Dynamic Entry Conditions:
Touch Entry: The script enters long or short positions when the price touches specific Fibonacci levels and confirms the move with a bullish (for long) or bearish (for short) candle.
Break Entry (Optional): If the "Use Break Strategy" option is enabled, the script can also enter positions when the price breaks through Fibonacci levels, providing more aggressive entry opportunities.
Stop Loss Management:
The script offers flexible stop loss settings. Users can choose between a fixed percentage stop loss or an ATR-based stop loss, which adjusts based on market volatility.
The ATR (Average True Range) stop loss is multiplied by a user-defined factor, allowing for tailored risk management based on market conditions.
Trailing Stop Mechanism:
The script includes an optional trailing stop feature, which adjusts the stop loss level as the market moves in favor of the trade. This helps lock in profits while allowing the trade to run if the trend continues.
The trailing stop is calculated as a percentage of the difference between the entry price and the current market price.
Multiple Take Profit Levels:
The strategy calculates seven take profit levels, each at incremental percentages above (for long trades) or below (for short trades) the entry price. This allows for gradual profit-taking as the market moves in the trade's favor.
Each take profit level can be customized in terms of the percentage of the position to be closed, providing precise control over exit strategies.
Strategy Backtesting and Results:
Realistic Backtesting:
The script has been backtested with realistic account sizes, commission rates, and slippage settings to ensure that the results are applicable to actual trading scenarios.
The backtesting covers various timeframes and markets to ensure the strategy's robustness across different trading environments.
Default Settings:
The script is published with default settings that have been optimized for general use. These settings include a 15-minute timeframe, a 1.0% stop loss, a 2.0 ATR multiplier for stop loss, and a 1.5% trailing stop.
Users can adjust these settings to better fit their specific trading style or the market they are trading.
How It Works:
Long Entry Conditions:
The strategy enters a long position when the price touches the 19% Fibonacci level (from high to low) or the reverse 19% level (from low to high) and confirms the move with a bullish candle.
If the "Use Break Strategy" option is enabled, the script will also enter a long position when the price breaks below the 19% Fibonacci level and then moves back up, confirming the break with a bullish candle.
Short Entry Conditions:
The strategy enters a short position when the price touches the 82.56% Fibonacci level and confirms the move with a bearish candle.
If the "Use Break Strategy" option is enabled, the script will also enter a short position when the price breaks above the 82.56% Fibonacci level and then moves back down, confirming the break with a bearish candle.
Stop Loss and Take Profit Logic:
The stop loss for each trade is calculated based on the selected method (fixed percentage or ATR-based). The strategy then manages the trade by either trailing the stop or taking profit at predefined levels.
The take profit levels are set at increments of 0.5% above or below the entry price, depending on whether the position is long or short. The script gradually exits the trade as these levels are hit, securing profits while minimizing risk.
Usage:
For Fibonacci Traders:
This script is ideal for traders who rely on Fibonacci retracement levels to find potential trade entries and exits. The script automates the process, allowing traders to focus on market analysis and decision-making.
For Trend and Swing Traders:
The strategy's flexibility in handling both touch and break entries makes it suitable for trend-following and swing trading strategies. The multiple take profit levels allow traders to capture profits in trending markets while managing risk.
Important Notes:
Originality: This script uniquely combines Fibonacci retracement levels with dynamic stop loss management and multiple take profit levels. It is not just a combination of existing indicators but a thoughtful integration designed to enhance trading performance.
Disclaimer: Trading involves risk, and it is crucial to test this script in a demo account or through backtesting before applying it to live trading. Users should ensure that the settings align with their individual risk tolerance and trading strategy.

TradeLibrary "Trade"
A Trade Tracking Library
Monitor conditions with less code by using Arrays. When your conditions are met in chronologically, a signal is returned and the scanning starts again.
Create trades automatically with Stop Loss, Take Profit and Entry. The trades will automatically track based on the market movement and update when the targets are hit.
Sample Usage
Enter a buy trade when RSI crosses below 70 then crosses above 80 before it crosses 40.
Note: If RSI crosses 40 before 80, No trade will be entered.
rsi = ta.rsi(close, 21)
buyConditions = array.new_bool()
buyConditions.push(ta.crossunder(rsi, 70))
buyConditions.push(ta.crossover(rsi, 80))
buy = Trade.signal(buyConditions, ta.crossunder(rsi, 40))
trade = Trade.new(close-(100*syminfo.mintick), close +(200*syminfo.mintick), condition=buy)
plot(trade.takeprofit, "TP", style=plot.style_circles, linewidth=4, color=color.lime)
alertcondition(trade.tp_hit, "TP Hit")
method signal(conditions, reset)
Signal Conditions
Namespace types: bool
Parameters:
conditions (bool )
reset (bool)
Returns: Boolean: True when all the conditions have occured
method update(this, stoploss, takeprofit, entry)
Update Trade Parameters
Namespace types: Trade
Parameters:
this (Trade)
stoploss (float)
takeprofit (float)
entry (float)
Returns: nothing
method clear(this)
Clear Trade Parameters
Namespace types: Trade
Parameters:
this (Trade)
Returns: nothing
method track(this, _high, _low)
Track Trade Parameters
Namespace types: Trade
Parameters:
this (Trade)
_high (float)
_low (float)
Returns: nothing
new(stoploss, takeprofit, entry, _high, _low, condition, update)
New Trade with tracking
Parameters:
stoploss (float)
takeprofit (float)
entry (float)
_high (float)
_low (float)
condition (bool)
update (bool)
Returns: a Trade with targets and updates if stoploss or takeprofit is hit
new()
New Empty Trade
Returns: an empty trade
Trade
Fields:
stoploss (series__float)
takeprofit (series__float)
entry (series__float)
sl_hit (series__bool)
tp_hit (series__bool)
open (series__integer)
