Easy MA SignalsEasy MA Signals
Overview
Easy MA Signals is a versatile Pine Script indicator designed to help traders visualize moving average (MA) trends, generate buy/sell signals based on crossovers or custom price levels, and enhance chart analysis with volume-based candlestick coloring. Built with flexibility in mind, it supports multiple MA types, crossover options, and customizable signal appearances, making it suitable for traders of all levels. Whether you're a day trader, swing trader, or long-term investor, this indicator provides actionable insights while keeping your charts clean and intuitive.
Configure the Settings
The indicator is divided into three input groups for ease of use:
General Settings:
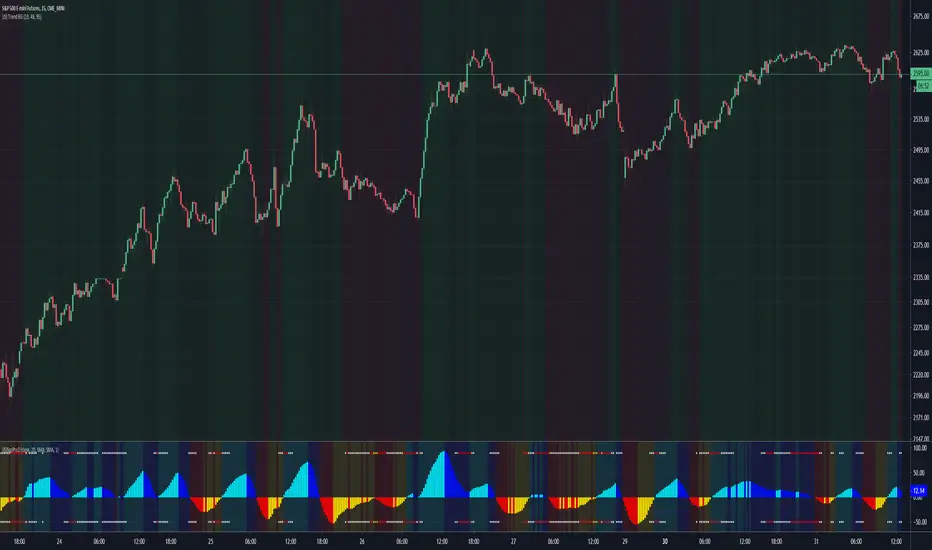
Candlestick Color Scheme: Choose from 10 volume-based color schemes (e.g., Sapphire Pulse, Emerald Spark) to highlight high/low volume candles. Select “None” for TradingView’s default colors.
Moving Average Length: Set the MA period (default: 20). Adjust for faster (lower values) or slower (higher values) signals.
Moving Average Type: Choose between SMA, EMA, or WMA (default: EMA).
Show Buy/Sell Signals: Enable/disable signal plotting (default: enabled).
Moving Average Crossover: Select a crossover type (e.g., MA vs VWAP, MA vs SMA50) for signals or “None” to disable.
Volume Influence: Adjust how volume impacts candlestick colors (default: 1.2). Higher values make thresholds stricter.
Signal Appearance Settings:
Buy/Sell Signal Shape: Choose shapes like triangles, arrows, or labels for signals.
Buy/Sell Signal Position: Place signals above or below bars.
Buy/Sell Signal Color: Customize colors for better visibility (default: green for buy, red for sell).
Custom Price Alerts:
Custom Buy/Sell Alert Price: Set specific price levels for alerts (default: 0, disabled). Enter a non-zero value to enable.
Set Up Alerts
To receive notifications (e.g., sound, popup, email) when signals or custom price levels are hit:
Click the Alert button (alarm clock icon) in TradingView.
Select Easy MA Signals as the condition and choose one of the four alert types:
MA Crossover Buy Alert: Triggers on MA crossover buy signals.
MA Crossover Sell Alert: Triggers on MA crossover sell signals.
Custom Buy Alert: Triggers when price crosses above the custom buy price.
Custom Sell Alert: Triggers when price crosses below the custom sell price.
Enable Play Sound and select a sound (e.g., “Bell”).
Set the frequency (e.g., Once Per Bar Close for confirmed signals) and create the alert.
Analyze the Chart
Moving Average Line: Displays the selected MA with color changes (green for bullish, red for bearish, gray for neutral) based on price position relative to the MA.
Buy/Sell Signals: Appear as shapes or labels when crossovers or custom price levels are hit.
Candlestick Colors: If a color scheme is selected, candles change color based on volume strength (high, low, or neutral), aiding in trend confirmation.
Why Use Easy MA Signals?
Easy MA Signals is designed to simplify technical analysis while offering advanced customization. It’s ideal for traders who want:
A clear visualization of MA trends and crossovers.
Flexible signal generation based on MA crossovers or custom price levels.
Volume-enhanced candlestick coloring to identify market strength.
Easy-to-use settings with tooltips for beginners and pros alike.
This script is particularly valuable because it combines multiple features into one indicator, reducing chart clutter and providing actionable insights without overwhelming the user.
Benefits of Easy MA Signals
Highly Customizable: Supports SMA, EMA, and WMA with adjustable lengths.
Offers multiple crossover options (VWAP, SMA10, SMA20, etc.) for tailored strategies.
Custom price alerts allow precise targeting of key levels.
Volume-Based Candlestick Coloring: 10 unique color schemes highlight volume strength, helping traders confirm trends.
Adjustable volume influence ensures adaptability to different markets.
Flexible Signal Visualization: Choose from various signal shapes (triangles, arrows, labels) and positions (above/below bars).
Customizable colors improve visibility on any chart background.
Alert Integration: Built-in alert conditions for crossovers and custom prices support sound, email, and app notifications.
Easy setup for real-time trading decisions.
User-Friendly Design: Organized input groups with clear tooltips make configuration intuitive.
Suitable for beginners and advanced traders alike.
Example Use Cases
Swing Trading with MA Crossovers:
Scenario: A trader wants to trade Bitcoin (BTC/USD) on a 4-hour chart using an EMA crossover strategy.
Setup:
Set Moving Average Type to EMA, Length to 20.
Set Moving Average Crossover to “MA vs SMA50”.
Enable Show Buy/Sell Signals and choose “arrowup” for buy, “arrowdown” for sell.
Select “Emerald Spark” for candlestick colors to highlight volume surges.
Usage: Buy when the EMA20 crosses above the SMA50 (green arrow appears) and volume is high (dark green candles). Sell when the EMA20 crosses below the SMA50 (red arrow). Set alerts for real-time notifications.
Scalping with Custom Price Alerts:
Scenario: A day trader monitors Tesla (TSLA) on a 5-minute chart and wants alerts at specific support/resistance levels.
Setup:
Set Custom Buy Alert Price to 150.00 (support) and Custom Sell Alert Price to 160.00 (resistance).
Use “labelup” for buy signals and “labeldown” for sell signals.
Keep Moving Average Crossover as “None” to focus on price alerts.
Usage: Receive a sound alert and label when TSLA crosses 150.00 (buy) or 160.00 (sell). Use volume-colored candles to confirm momentum before entering trades.
When NOT to Use Easy MA Signals
High-Frequency Trading: Reason: The indicator relies on moving averages and volume, which may lag in ultra-fast markets (e.g., sub-second trades). High-frequency traders may need specialized tools with real-time tick data.
Alternative: Use order book or market depth indicators for faster execution.
Low-Volatility or Sideways Markets:
Reason: MA crossovers and custom price alerts can generate false signals in choppy, range-bound markets, leading to whipsaws.
Alternative: Use oscillators like RSI or Bollinger Bands to trade within ranges.
This indicator is tailored more towards less experienced traders. And as always, paper trade until you are comfortable with how this works if you're unfamiliar with trading! We hope you enjoy this and have great success. Thanks for your interested in Easy MA Signals!
Tradesignals

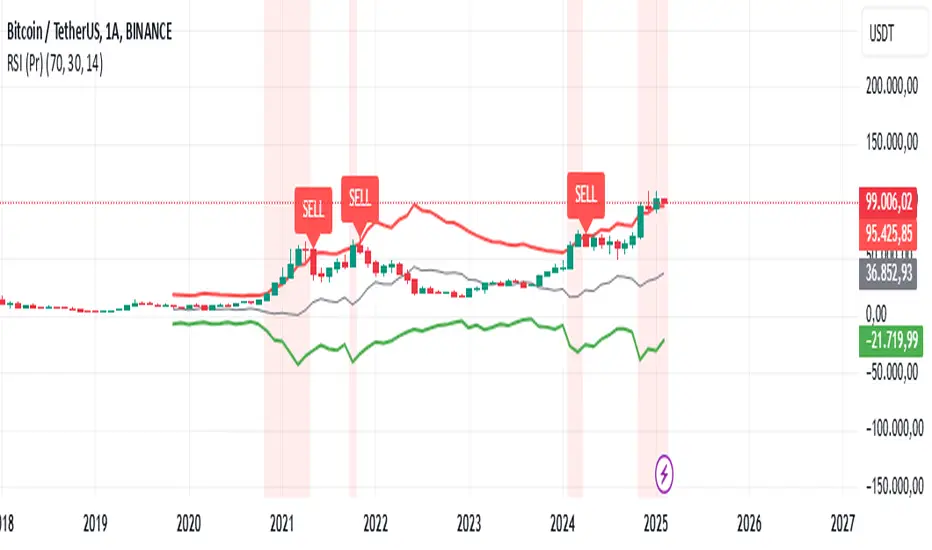
RSI (Pr)The "RSI (Pr)" indicator enhances the traditional Relative Strength Index (RSI) by incorporating dynamic bands and highlighting extreme market conditions directly on the price chart. This approach offers traders a more intuitive visualization of potential overbought and oversold zones, facilitating timely decision-making.
Key Features:
Dynamic RSI Bands: The indicator calculates upper and lower bands based on user-defined overbought and oversold levels. These bands adjust in real-time, providing a responsive measure of market extremes.
Visual Alerts: Background colors change when the price moves outside the RSI bands, offering immediate visual cues of potential market reversals.
Buy/Sell Signals: The script places "BUY" and "SELL" labels on the chart when the price crosses above or below the RSI bands, assisting traders in identifying potential entry and exit points.
How It Works:
RSI Calculation: The script computes the RSI based on the closing price and a user-defined length (default is 14 periods).
Exponential Moving Averages (EMA): It calculates the EMA of the maximum gains and losses to smooth out the data, enhancing the reliability of the RSI bands.
Upper and Lower Bands: Using the smoothed data, the script determines the upper (resistance) and lower (support) bands, which represent dynamic overbought and oversold levels.
Visual Indicators: The script plots the upper and lower bands, as well as a midline, directly on the price chart. Background colors change when the price exceeds these bands, and "BUY" or "SELL" labels appear at crossover points.
Usage:
Overbought Conditions: When the price crosses above the upper band, it may indicate an overbought condition, suggesting a potential selling opportunity.
Oversold Conditions: When the price crosses below the lower band, it may indicate an oversold condition, suggesting a potential buying opportunity.
Customization:
Users can adjust the following parameters to suit their trading preferences:
RSI Overbought Level: Default is 70.
RSI Oversold Level: Default is 30.
RSI Length: Default is 14 periods.
Disclaimer:
This indicator is designed for educational purposes and should not be construed as financial advice. Trading involves significant risk, and it's essential to conduct thorough research and consider your financial situation before making trading decisions. Past performance is not indicative of future results.
By integrating dynamic RSI bands and clear visual signals directly onto the price chart, this indicator aims to provide traders with actionable insights into market conditions, enhancing the traditional RSI analysis.
(JS) Squeeze Pro 2This is my version of the updated classic indicator created by John Carter. I plan on adding a Squeeze Overlay script in the future that will pair with this one as well for additional signals.
So to break down the Squeeze, what it is, how it works, etc - you have to look at the components that make it up.
1. Bollinger Bands
2. Keltner Channels
3. Momentum
The momentum in this indicator is smoothed out using linear regression (shout out to Lazy Bear, it's a much simpler way to do it, imo).
The momentum is what is displayed on the indicator as a histogram, its purpose is obvious (to show momentum).
Now what is a Squeeze? A squeeze occurs when Bollinger Bands tighten up enough to slip inside of Keltner Channels.
This is interpreted as price is compressing and building up energy before releasing it and making a big move.
Traditionally, John Carter's version uses 20 period SMAs as the basis lines on both the BB and the KC.
In my version, I've given the freedom to change this and try out different types of moving averages.
His original squeeze indicator had one Squeeze setting, though this new one has three .
The white dot Squeeze , call it a "low squeeze", an "early squeeze", whatever you'd like - this is the easiest Squeeze to form based on its settings.
The red dot Squeeze is the original from the first Squeeze indicator.
And finally, the yellow dot squeeze , call it a "high squeeze", "power squeeze", once again whatever you want - is the most difficult to form and suggests price is under extreme levels of compression.
From what I've witnessed John Carter say in the past, the squeeze is meant to be used for continuation.
Now to explain the parameters:
Squeeze Input - This is just the source for the Squeeze to use, default value is closing price.
Length - This is the length of time used to calculate the Bollinger Bands and Keltner Channels.
Bollinger Bands Calculation Type - Selects the type of moving average used to create the Bollinger Bands.
Keltner Channel Calculation Type - Selects the type of moving average used to create the Keltner Channel.
Color Format - I have created 5 different color schemes, this allows you to choose one.
Draw Divergence - Self explanatory here, this will auto-draw divergence on the indicator.
Gray Background for Dark Mode - This is something I put on all my indicators to make them more visually appealing.
Moving on to the alerts, I have made some basic alerts to notify certain indicator conditions (I had to revise it back from the prior version, as V4 of PineScript limits outputs).
6th Dot Alerts - This will inform you when a certain Squeeze makes it 6 dots in. Why 6 dots? That is what John Carter said to be his preference.
12th Dot Alerts - Think of this as a "prolonged Squeeze" alert. I feel like if they do run this long you likely need to go up in resolution, but some traders prefer certain time increments so this is for them.
End of Squeeze Alerts - Self explanatory again - once a Squeeze has concluded this will provide you with a notification.
Start of Squeeze Alerts - Opposite of the alert above, notifications come when a Squeeze begins.
Zero Line Alerts - This will inform you of when the momentum makes a bullish or bearish move across the zero line.
I hope that I've done well enough explaining the indicator and how it works, for any further information on it I suggest you check out Simpler Trading and get linked up with John Carter over there.
He does lots of videos, webinars, and of course you can always get the official indicator and his signals there too.