Dimensional Support ResistanceDimensional Support Resistance
Overview
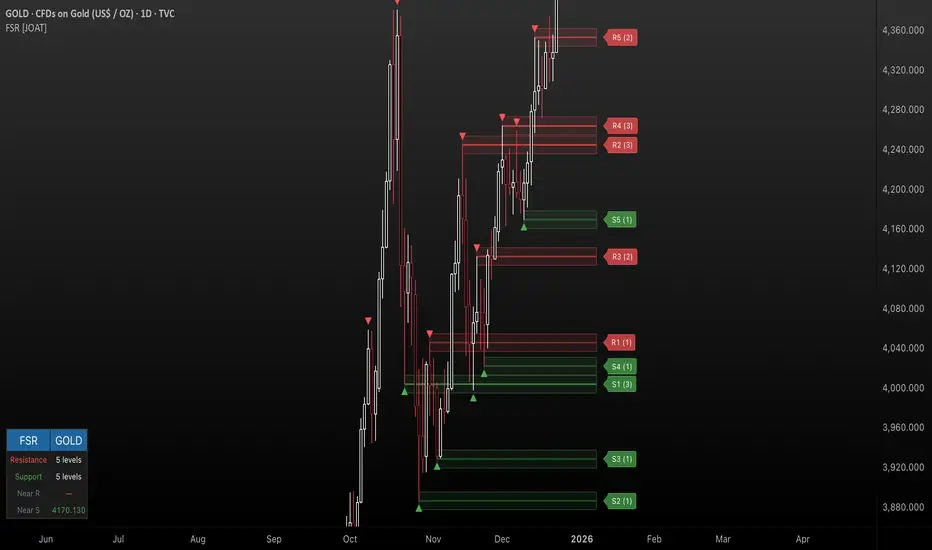
Dimensional Support Resistance is an open-source overlay indicator that automatically detects and displays clean, non-overlapping support and resistance levels using pivot-based analysis with intelligent filtering. It identifies significant swing highs and lows, filters them by minimum distance to prevent visual clutter, and provides volume-confirmed bounce signals.
What This Indicator Does
The indicator calculates and displays:
Dynamic Pivot Levels - Automatically detected swing highs and lows based on configurable pivot strength
Distance Filtering - Ensures levels are spaced apart by a minimum percentage to prevent overlap
S/R Zones - Visual zones around each level showing the price area of significance
Bounce Detection - Identifies when price reverses at support or resistance levels
Volume Confirmation - Strong signals require above-average volume for confirmation
How It Works
Pivot detection scans for swing highs and lows using a configurable strength parameter. A pivot low requires the low to be lower than all surrounding bars within the strength period.
Signal Generation
The indicator generates bounce signals using TradingView's built-in pivot detection combined with candle reversal confirmation:
Support Bounce: Pivot low forms with bullish close (close > open)
Resistance Bounce: Pivot high forms with bearish close (close < open)
Strong Bounce: Bounce occurs with volume 1.5x above 20-period average
A cooldown period of 15 bars prevents signal spam.
Dashboard Panel
A compact dashboard displays:
Support - Count of active support levels
Resistance - Count of active resistance levels
Dashboard position is configurable (Top Left, Top Right, Bottom Left, Bottom Right).
Visual Elements
Support Lines - Green horizontal lines at support levels
Resistance Lines - Red horizontal lines at resistance levels
S/R Zones - Semi-transparent boxes around levels showing zone width
Price Labels - S: and R: labels showing exact price of nearest levels
BOUNCE Markers - Triangle shapes with text when price bounces at a level
STRONG Markers - Label shapes when bounce occurs with high volume
Input Parameters
Lookback Period (default: 100) - Historical bars to scan for pivots
Pivot Strength (default: 8) - Bars on each side required for valid pivot (higher = fewer but stronger levels)
Max Levels Each Side (default: 2) - Maximum support and resistance levels displayed
Zone Width % (default: 0.15) - Width of zones around each level as percentage of price
Min Distance Between Levels % (default: 1.0) - Minimum spacing between levels to prevent overlap
Show S/R Zones (default: true) - Toggle zone visualization
Show Bounce Signals (default: true) - Toggle signal markers
Support Color (default: #00ff88) - Color for support elements
Resistance Color (default: #ff3366) - Color for resistance elements
Suggested Use Cases
Identify key support and resistance levels for entry and exit planning
Use bounce signals as potential reversal confirmation
Combine with other indicators for confluence-based trading decisions
Monitor strong signals for high-probability setups with volume confirmation
Timeframe Recommendations
Works on all timeframes. Higher timeframes (4H, Daily) provide more significant levels with fewer signals. Lower timeframes show more granular structure but may produce more noise.
Limitations
Pivot detection requires lookback bars, so very recent pivots may not be immediately visible
Bounce signals are based on pivot formation and may lag by the pivot strength period
Levels are recalculated on each bar, so they may shift as new pivots form
Open-Source and Disclaimer
This script is published as open-source under the Mozilla Public License 2.0 for educational purposes. It does not constitute financial advice. Past performance does not guarantee future results. Always use proper risk management and conduct your own analysis before trading.
- Made with passion by officialjackofalltrades
Penunjuk Pine Script®