TCSE24TCSE24 or Trendband Cycle Special Edition is designed to help create a simple trading plan by identifying potential Entry, Exit, Target Price, and Stop Loss. I use TCSE24 as a guide for short-term swing trading!
Please note, TCSE24 is not a directional indicator but fits better in Trend Following Strategy.
Only work with chart that have volume by default
Signals for Bullish Trade
1. Trendband Below Candlestick
Filled Red with a Purple Line.
2. Cycle Begin
Bar Color: Vivid Green.
Green Circle Above Candlestick: Target Price.
Green Circle Below Candlestick: Pullback Entry.
Red Circle Below Candlestick: Stop Loss.
3. Breakout
Bar Color: Lemon Green.
Green Circle Below Candlestick: Pullback Entry.
Red Circle Below Candlestick: Stop Loss.
4. Broken Minor Support
Bar Color: Yellow.
Price closes below the lowest low of the last 4 candles.
5. Volume Test
Green Triangle-Up below Candlestick.
Current bar shows 3 consecutive falling volumes.
6. Inside Bar
Orange Triangle-Up below Candlestick.
High and low are within the high and low of the previous candlestick.
7. Box Trading
Purple Diamond
8. Cycle End
Bar Color: Red.
Red Triangle-Up below Candlestick.
9. Info Panel
Background Green, turning Yellow after 20 bars from Cycle Begin.
Background Red when Cycle Ends.
Displays info such as Current Price, Target Price, Pullback Price, Stop Loss.
________________________________________
Signals for Bearish Trade
1. Trendband Above Candlestick
Filled with Blue.
2.Short Selling Begin
Bar Color: Blue.
Blue Circle Above Candlestick: Stop Loss.
Blue Circle Below Candlestick: Target Price.
3. Breakdown
Blue Circle Above Candlestick: Stop Loss.
4. Short Selling End
Bar Color: White.
Blue Triangle-Down above Candlestick.
5. Info Panel
Background Blue throughout the trade.
________________________________________
Bullish Trade Entry Suggestions
1. Ensure Cycle Begin is confirmed:
Buy near the closing price.
Use a Buy Stop 2 ticks higher than Cycle Begin's highest price.
Use a Buy Limit at the pullback price.
Wait for a signal candlestick, then Buy the next day if the price rises above the signal candlestick’s high.
2. Ensure Breakout is confirmed:
Buy near the closing price.
Use a Buy Stop 2 ticks higher than Breakout’s highest price.
Use a Buy Limit at the pullback price.
3. Box Trading:
Buy on the third day (T3).
Buy above the Box Trading line.
4. Candlestick Signal:
Ensure the signal candlestick is confirmed:
Look for Doji, Spinning Top, or Hammer patterns.
Buy the next day if the price rises above the signal candle's high.
________________________________________
Bullish Trade Exit Suggestions
1. Target Sell
Sell when the Target Price (TP) is reached or hold as long as Stop Loss isn’t hit.
Sell if the price doesn’t move, doesn’t reach the target, or doesn’t hit the Stop Loss after 20 candles from Cycle Begin.
Sell if the price closes below the Stop Loss.
2. Candlestick Signal
Look for Doji, Spinning Top, or Hammer patterns.
Sell the next day if the price drops below the signal candle's low.
________________________________________
Bearish Trade Suggestions
Ensure Short Selling Signal or Breakdown is confirmed:
Sell near the closing price.
Close the position at Target 1, Target 2, Target 3.
Close the position if Stop Loss is hit or when Short Selling End appears.
________________________________________
Any alert() function call freq
Once_per_bar_close
Cycle Begin, Inside Bar, Doji, Hammer, Spinning Top, Box Trading, Volume Test, Short Selling
Once_per_bar
Breakout, Cycle End
For educational purposes only and should not be taken as advice on how to invest your capital. Always speak with a professional financial planner or advisor before making any investment decisions.
Tradingplans

Trading Strategy - Follow The Plan"Trading Strategy - Follow The Plan" is a TradingView indicator specifically crafted for traders dedicated to adhering to a structured approach. It emphasizes the elimination of emotional decision-making by providing clear, actionable steps. This tool allows you to articulate and visually embed your trading strategy directly onto your charts, encompassing your entry plan, exit plan, and any additional notes crucial for maintaining focus and discipline. It's designed to aid in sustaining consistency in your trading executions, ensuring that you remain steadfastly aligned with your predetermined trading methodology.
Features
1. Entry Plan: Allows traders to outline specific criteria for market entry. This could include conditions like divergences on multiple timeframes, specific pattern recognitions, or other entry triggers. The flexibility of this section caters to various trading styles and strategies.
2. Exit Plan: Dedicated to defining exit strategies, this section can include details on profit targets, stop-loss levels, or conditions for position reversal. It serves as a constant reminder of exit strategies during active trades.
3. Notes: A customizable space for traders to jot down essential rules, observations, or reminders. This section is particularly useful for reinforcing risk management practices and maintaining focus on broader trading goals.
4. Visibility Controls: Each section of the trading plan (Entry Plan, Exit Plan, Notes) can be toggled on or off, allowing traders to manage on-screen information and reduce chart clutter.
5. Layout Customization: Users can choose the placement of the trading plan on their chart, with options including Top Right, Top Left, Bottom Right, and Bottom Left. This caters to individual preferences and screen setups.
6. Appearance Customization: The indicator allows for adjustments in text and background colors, and text sizes for titles and content, enhancing readability and personal preference alignment.

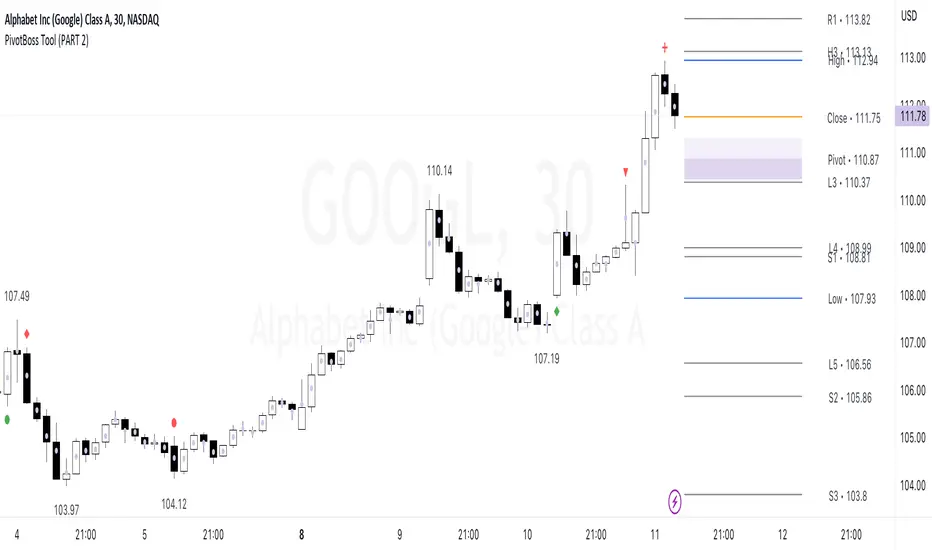
PivotBoss Tool (PART 2)Hello Everyone,
This indicator is being published on TradingView to help traders solve their multiframe EOD analysis issue and at the same time get additional information of other crucial information - CandleStick Patterns, Candlestick Midpoint and ATR Trails for trailing your SL's all under one single frame.
This indicator is based on the concepts of Secrets of Pivot Boss by Mr.Frank Ochoa and strives to provide more insightful information of pivot points and other general indicators being used by traders on day-to-day basis in the simplest format possible so that traders of all kinds can relate to the same.
And, this is purely dedicated to EOD analysis.
What is the moat of this Indicator?
This particular indicator is designed to help the traders in their EOD analysis as this indicator is well equipped to provide the next session trading pivot points well in advance at the end of the current day trading session. A trader has everything required for an EOD analysis in this particular indicator.
Below is the brief information of the indicator table you see in the layout of the above chart -
#Next Session Pivots
One can plot this feature to find out the developing pivot levels for upcoming D/W/M/Q/Y alongside it's additional pivot levels such as:
- Future Camarilla Pivots (H3/H4/H5 & L3/L4/L5)
- Future Floor Pivots (R1/R2/R3 & S1/S2/S3)
- Future CPR levels (TC/PIVOT/BC)
#Developing Pivot Cloud
One can check the developing CPR in Intraday itself by enabling the pivot cloud feature which can tell you multiple information to be with the trend and it's participants.
Basically a live extension of the current trading CPR according with the progress of the trading day.
#CandleStick Mid-Point
This can plot the midpoint of each candlestick on any timeframe for better understanding of buyer/seller's absorption!
#Candlestick Pattern Scans
So one can now easily filter out the candlesticks patterns which helps in decoding the chart in a better format for entry and exits. There are 4 candlesticks patterns included -
- Wick Reversal Pattern -
This pattern basically tells the wick strength which is actually a liquidity absorption by the stronger hand and the intensity and further direction of the move depends on the position of wick candle being formed indicated by green (bull) or red (bear) signal.
- Doji Reversal Pattern -
This pattern basically is used to identify the biasness of the market participants and further identifies a pause in the ongoing trend or a pause for the trend to get further liquidity for broader strength.
- Outside Reversal Pattern -
This pattern depicts the range of the previous candle of a specific timeframe has been tested at both the extreme and probably the price will consolidate in the that visible range for a while.
- Extreme Reversal Pattern -
This pattern basically points at a setup that looks for an extreme pattern of selling pressure and then looks to fade this behavior to capture a bullish move higher (reverse for shorts) and vice versa .
#ATR Trails
This a just a supertrend indicator sourced with ATR to track a short/long term trend change and can be used for trailing SL's when they are kept tight for big positions!
#CPR Trails
This is the most interesting feature with multiple permutations & combinations and can be used to analyse intraday as well as EOD and positional trends. Moreover, THIS FEATURE CAN ALSO INDENTIFY MICRO INTRADAY TREND AS SMALL AS EACH 5M TREND!!
This indicator will be updated with time and depending on community's feedback and requirements.
Credits -
- Mr. Frank Ochoa (Concepts and ideas from the book 'Secrets of PivotBoss' )
- TradingView (Providing a platform to traders to simply their trading through 'PineScript')
Regards,
Mukkull
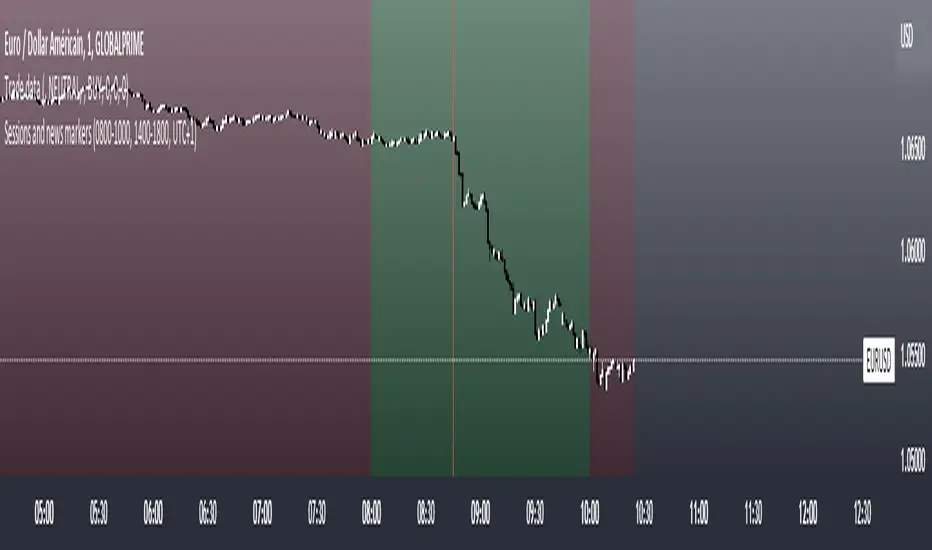
Sessions and news markersHello,
I use this script daily so I thought it might help some of you guys out!
WHAT IS THE SCRIPT
This script can show two custom trading sessions and up to three specific dates and hours to keep in mind while trading (for example a news release).
WHY USE THE SCRIPT
My trading plan tells me to trade from 08:00am to 10:00am (GMT+1) and not to let open trades during a high impact news release, this script allows me to show my trading session and mark the news releases on the chart before trading so I don't forget about them while in the heat of trading.
HOW TO USE THE SCRIPT
It is very straightforward:
How to set up the TRADING SESSIONS:
- Tick the trading sessions that you want to use (one or two)
- Specify the trading hours
- Choose the color of the trading sessions
- Choose the color to fill outside of the trading sessions
- Choose the time zone (GMT, GMT+1, UTC, UTC+2...)
How to set up the NEWS MARKERS:
- Tick the news markers you want to use (up to three)
- Specify the date and hours of the news
- Choose the color of the news markers
- No need to choose the time zone, it will use the timezone of the chart
PS: As you can see in the settings, each session and news marker can have their own color
I hope this helps you out as much as it helps me! If you have any recommendations I would be glad to hear them :)