BullBear with Volume-Percentile TP - Strategy [presentTrading] Happy New Year, everyone! I hope we have a fantastic year ahead.
It's been a while since I published an open script, but it's time to return.
This strategy introduces an indicator called Bull Bear Power, combined with an advanced take-profit system, which is the main innovative and educational aspect of this script. I hope all of you find some useful insights here. Welcome to engage in meaningful exchanges. This is a versatile tool suitable for both novice and experienced traders.
█ Introduction and How it is Different
Unlike traditional strategies that rely solely on price or volume indicators, this approach combines Bull Bear Power (BBP) with volume percentile analysis to identify optimal entry and exit points. It features a dynamic take-profit mechanism based on ATR (Average True Range) multipliers adjusted by volume and percentile factors, ensuring adaptability to diverse market conditions. This multifaceted strategy not only improves signal accuracy but also optimizes risk management, distinguishing it from conventional trading methods.
BTCUSD 6hr performance
Disable the visualization of Bull Bear Power (BBP) to clearly view the Z-Score.
█ Strategy, How it Works: Detailed Explanation
The BBP Strategy with Volume-Percentile TP utilizes several interconnected components to analyze market data and generate trading signals. Here's an overview with essential equations:
🔶 Core Indicators and Calculations
1. Exponential Moving Average (EMA):
- **Purpose:** Smoothens price data to identify trends.
- **Formula:**
EMA_t = (Close_t * (2 / (lengthInput + 1))) + (EMA_(t-1) * (1 - (2 / (lengthInput + 1))))
- Usage: Baseline for Bull and Bear Power.
2. Bull and Bear Power:
- Bull Power: `BullPower = High_t - EMA_t`
- Bear Power: `BearPower = Low_t - EMA_t`
- BBP:** `BBP = BullPower + BearPower`
- Interpretation: Positive BBP indicates bullish strength, negative indicates bearish.
3. Z-Score Calculation:
- Purpose: Normalizes BBP to assess deviation from the mean.
- Formula:
Z-Score = (BBP_t - bbp_mean) / bbp_std
- Components:
- `bbp_mean` = SMA of BBP over `zLength` periods.
- `bbp_std` = Standard deviation of BBP over `zLength` periods.
- Usage: Identifies overbought or oversold conditions based on thresholds.
🔶 Volume Analysis
1. Volume Moving Average (`vol_sma`):
vol_sma = (Volume_1 + Volume_2 + ... + Volume_vol_period) / vol_period
2. Volume Multiplier (`vol_mult`):
vol_mult = Current Volume / vol_sma
- Thresholds:
- High Volume: `vol_mult > 2.0`
- Medium Volume: `1.5 < vol_mult ≤ 2.0`
- Low Volume: `1.0 < vol_mult ≤ 1.5`
🔶 Percentile Analysis
1. Percentile Calculation (`calcPercentile`):
Percentile = (Number of values ≤ Current Value / perc_period) * 100
2. Thresholds:
- High Percentile: >90%
- Medium Percentile: >80%
- Low Percentile: >70%
🔶 Dynamic Take-Profit Mechanism
1. ATR-Based Targets:
TP1 Price = Entry Price ± (ATR * atrMult1 * TP_Factor)
TP2 Price = Entry Price ± (ATR * atrMult2 * TP_Factor)
TP3 Price = Entry Price ± (ATR * atrMult3 * TP_Factor)
- ATR Calculation:
ATR_t = (True Range_1 + True Range_2 + ... + True Range_baseAtrLength) / baseAtrLength
2. Adjustment Factors:
TP_Factor = (vol_score + price_score) / 2
- **vol_score** and **price_score** are based on current volume and price percentiles.
Local performance
🔶 Entry and Exit Logic
1. Long Entry: If Z-Score crosses above 1.618, then Enter Long.
2. Short Entry: If Z-Score crosses below -1.618, then Enter Short.
3. Exiting Positions:
If Long and Z-Score crosses below 0:
Exit Long
If Short and Z-Score crosses above 0:
Exit Short
4. Take-Profit Execution:
- Set multiple exit orders at dynamically calculated TP levels based on ATR and adjusted by `TP_Factor`.
█ Trade Direction
The strategy determines trade direction using the Z-Score from the BBP indicator:
- Long Positions:
- Condition: Z-Score crosses above 1.618.
- Short Positions:
- Condition: Z-Score crosses below -1.618.
- Exiting Trades:
- Long Exit: Z-Score drops below 0.
- Short Exit: Z-Score rises above 0.
This approach aligns trades with prevailing market trends, increasing the likelihood of successful outcomes.
█ Usage
Implementing the BBP Strategy with Volume-Percentile TP in TradingView involves:
1. Adding the Strategy:
- Copy the Pine Script code.
- Paste it into TradingView's Pine Editor.
- Save and apply the strategy to your chart.
2. Configuring Settings:
- Adjust parameters like EMA length, Z-Score thresholds, ATR multipliers, volume periods, and percentile settings to match your trading preferences and asset behavior.
3. Backtesting:
- Use TradingView’s backtesting tools to evaluate historical performance.
- Analyze metrics such as profit factor, drawdown, and win rate.
4. Optimization:
- Fine-tune parameters based on backtesting results.
- Test across different assets and timeframes to enhance adaptability.
5. Deployment:
- Apply the strategy in a live trading environment.
- Continuously monitor and adjust settings as market conditions change.
█ Default Settings
The BBP Strategy with Volume-Percentile TP includes default parameters designed for balanced performance across various markets. Understanding these settings and their impact is essential for optimizing strategy performance:
Bull Bear Power Settings:
- EMA Length (`lengthInput`): 21
- **Effect:** Balances sensitivity and trend identification; shorter lengths respond quicker but may generate false signals.
- Z-Score Length (`zLength`): 252
- **Effect:** Long period for stable mean and standard deviation, reducing false signals but less responsive to recent changes.
- Z-Score Threshold (`zThreshold`): 1.618
- **Effect:** Higher threshold filters out weaker signals, focusing on significant market moves.
Take Profit Settings:
- Use Take Profit (`useTP`): Enabled (`true`)
- **Effect:** Activates dynamic profit-taking, enhancing profitability and risk management.
- ATR Period (`baseAtrLength`): 20
- **Effect:** Shorter period for sensitive volatility measurement, allowing tighter profit targets.
- ATR Multipliers:
- **Effect:** Define conservative to aggressive profit targets based on volatility.
- Position Sizes:
- **Effect:** Diversifies profit-taking across multiple levels, balancing risk and reward.
Volume Analysis Settings:
- Volume MA Period (`vol_period`): 100
- **Effect:** Longer period for stable volume average, reducing the impact of short-term spikes.
- Volume Multipliers:
- **Effect:** Determines volume conditions affecting take-profit adjustments.
- Volume Factors:
- **Effect:** Adjusts ATR multipliers based on volume strength.
Percentile Analysis Settings:
- Percentile Period (`perc_period`): 100
- **Effect:** Balances historical context with responsiveness to recent data.
- Percentile Thresholds:
- **Effect:** Defines price and volume percentile levels influencing take-profit adjustments.
- Percentile Factors:
- **Effect:** Modulates ATR multipliers based on price percentile strength.
Impact on Performance:
- EMA Length: Shorter EMAs increase sensitivity but may cause more false signals; longer EMAs provide stability but react slower to market changes.
- Z-Score Parameters:*Longer Z-Score periods create more stable signals, while higher thresholds reduce trade frequency but increase signal reliability.
- ATR Multipliers and Position Sizes: Higher multipliers allow for larger profit targets with increased risk, while diversified position sizes help in securing profits at multiple levels.
- Volume and Percentile Settings: These adjustments ensure that take-profit targets adapt to current market conditions, enhancing flexibility and performance across different volatility environments.
- Commission and Slippage: Accurate settings prevent overestimation of profitability and ensure the strategy remains viable after accounting for trading costs.
Conclusion
The BBP Strategy with Volume-Percentile TP offers a robust framework by combining BBP indicators with volume and percentile analyses. Its dynamic take-profit mechanism, tailored through ATR adjustments, ensures that traders can effectively capture profits while managing risks in varying market conditions.
Tradingsystem

Bollinger Bands - Breakout StrategyThe Bollinger Bands - Breakout Strategy is a trend-following optimized for short-term trading in the crypto market. This strategy employs the Bollinger Bands, a widely recognized technical indicator, as its primary instrument for pinpointing potential trades. It is capable of executing both long and short positions, depending on whether the market is in a spot or futures, and is particularly effective in trending markets.
The strategy boasts a high degree of configurability, allowing users to set the Bollinger Bands period and deviation, trend filter, volatility filter, trade direction filter, rate of change filter, and date filter. Furthermore, it offers options for Take Profit, Stop Loss, and Trailing Stop for both long and short positions, ensuring a comprehensive risk management approach. The inclusion of a maximum intraday loss feature adds another layer of protection, making this strategy a valuable tool for traders seeking a professional and adaptable trading system.
Name : Bollinger Bands - Breakout Strategy
Category : Trend Follower based on Bollinger Bands
Operating mode : Long and Short on Futures or Long on Spot
Trade duration : Intraday
Timeframe : 2H, 3H, 4H, 5H
Market : Crypto
Suggested usage : Trending Markets
Entry : When the price crosses above or below the Bollinger Bands
Exit : Opposite Cross or Profit target, Trailing stop or Stop loss
Configuration :
- Bollinger Bands period and deviation
- Trend Filter
- Volatility Filter
- Trade direction filter
- Rate of Change filter
- Date Filter (for backtesting purposes)
- Take Profit, Stop Loss and Trailing Stop for long and short positions
- Risk Management: Max Intraday Loss
Backtesting :
⁃ Exchange: BINANCE
⁃ Pair: BTCUSDT.P
⁃ Timeframe: 4H
⁃ Fee: 0.025%
⁃ Slippage: 1
- Initial Capital: 10000 USDT
- Position sizing: 10% of Equity
- Start : 2019-09-19 (Out Of Sample from 2022-12-23)
- Bar magnifier: on
Credits :
- LucF of Pine Coders for f_security function to avoid repainting using security.
- QuantNomad for Monthly Table.
Disclaimer : Risk Management is crucial, so adjust stop loss to your comfort level. A tight stop loss can help minimise potential losses. Use at your own risk.
How you or we can improve? Source code is open so share your ideas!
Leave a comment and smash the boost button!
Thanks for your attention, happy to support the TradingView community.

Yesterday’s High Breakout - Trend Following StrategyYesterday’s High Breakout it is a trading system based on the analysis of yesterday's highs, it works in trend-following mode therefore it opens a long position at the breakout of yesterday's highs even if they occur several times in one day.
There are several methods for exiting a trade, each with its own unique strategy. The first method involves setting Take-Profit and Stop-Loss percentages, while the second utilizes a trailing-stop with a specified offset value. The third method calls for a conditional exit when the candle closes below a reference EMA.
Additionally, operational filters can be applied based on the volatility of the currency pair, such as calculating the percentage change from the opening or incorporating a gap to the previous day's high levels. These filters help to anticipate or delay entry into the market, mitigating the risk of false breakouts.
In the specific case of NULS, a 9% Take-Profit and a 3% Stop-Loss were set, with an activated trailing-stop percentage. To postpone entry and avoid false breakouts, a 1% gap was added to the price of yesterday's highs.
Name : Yesterday's High Breakout - Trend Follower Strategy
Author : @tumiza999
Category : Trend Follower, Breakout of Yesterday's High.
Operating mode : Spot or Futures (only long).
Trade duration : Intraday.
Timeframe : 30M, 1H, 2H, 4H
Market : Crypto
Suggested usage : Short-term trading, when the market is in trend and it is showing high volatility.
Entry : When there is a breakout of Yesterday's High.
Exit : Profit target or Trailing stop, Stop loss or Crossunder EMA.
Configuration :
- Gap to anticipate or postpone the entry before or after the identified level
- Rate of Change for Entry Condition
- Take Profit, Stop Loss and Trailing Stop
- EMA length
Backtesting :
⁃ Exchange: BINANCE
⁃ Pair: NULSUSDT
⁃ Timeframe: 2H
⁃ Fee: 0.075%
⁃ Slippage: 1
- Initial Capital: 10000 USDT
- Position sizing: 10% of Equity
- Start : 2018-07-26 (Out Of Sample from 2022-12-23)
- Bar magnifier: on
Credits : LucF for Pine Coders (f_security function to avoid repainting using security)
Disclaimer : Risk Management is crucial, so adjust stop loss to your comfort level. A tight stop loss can help minimise potential losses. Use at your own risk.
How you or we can improve? Source code is open so share your ideas!
Leave a comment and smash the boost button!
Thanks for your attention, happy to support the TradingView community.

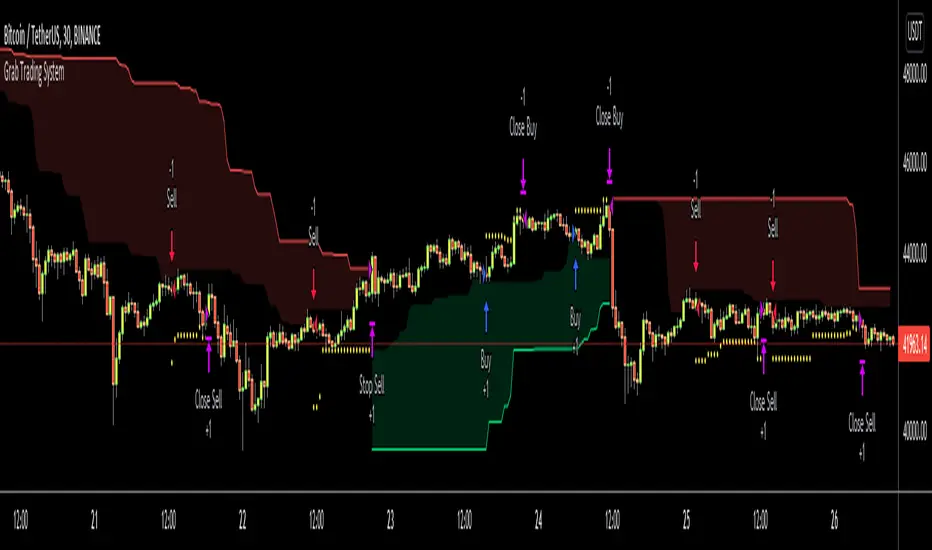
Grab Trading SystemHello All,
This is "Grab Trading System" script defined in the book "Trend Following" by Michael W. Covel. also named as "Two-box system". I made small changes and I guess that it can be improved more.
The definition: Far box defines major trend; system trades only in same direction as major trend, meanwhile fading the signals of near box. Last trade in each trend exits at break of far box - at the same time as the trend reverses. All trades, except the last in the trend, use a limit order, as they are fading the near box. The last trade exits on a stop, as the trend changes.
As you can see there is Longterm Period and Shortterm Period in the indicator options. Longterm period is used for major trend and shortterm period is used to take position according to major trend. in my test I got better performance in small time frames. you need to set longterm/shortterm periods by your trading strategies.
Enjoy!
Simple Price Momentum - How To Create A Simple Trading StrategyThis script was built using a logical approach to trading systems. All the details can be found in a step by step guide below. I hope you enjoy it. I am really glad to be part of this community. Thank you all. I hope you not only succeed on your trading career but also enjoy it.
docs.google.com
Cowabunga System from babypips.comPlease do read the information below as well, especially if you are new to Forex.
The Cowabunga System is a type of Mechanical Trading System that filters trades based on the trend of the 4 hour chart with EMAs and some other familiar indicators (RSI, Stochastics and MACD) while entering trades base on 15 minute chart.
I have coded (quite amateurishly) the basic system onto a 15 minute chart (the 4 hour settings are coded as well). The author says the system is to be traded off the 15 minute chart with the 4 hour chart only as a reference for trend direction.
4 Hour Chart Settings
5 EMA
10 EMA
Stochastics (10,3,3)
RSI (9)
Then we move onto the 15 minute chart, where he gives us the trade entry rules.
15 Minute Chart Settings
5 EMA
10 EMA
Stochastics (10,3,3)
RSI (9)
MACD (12,26,9)
Entry Rules - long entry rules used, obviously reverse these for shorting.
1. EMA must cross above the 10 EMA.
2. RSI must be greater than 50 and not overbought.
3. Stochastic must be headed up and not be in overbought territory.
4. MACD histogram must go from negative to positive OR be negative and start to increase in value.
What I did.
1. Set the RSI and Stochastic levels to avoid entries when they indicate overbought conditions for long and oversold conditions for short (80 and 20 levels).
2. Users can input specific times they want to backtest.
3. User's can configure profit targets, trailing stops and stops. Default is set it to was 100 pips profit target with a 40 pip trailing stop. (Note, when you are changing these values, please note that each pip is worth 10, so 100 pips is entered as 1000.)
The Cowabunga System from babypips.com is another popular and active system. The author, Pip Surfer, continues to post wins and losses with this system. It shows there is a lot of honesty and integrity with this system if the author keeps up to date even 10 years later and is not afraid of sharing the times the system causes losses.
As an example of this, here is post he shared just last week . It's almost like a journal, he gives specific times and reasons why he entered, lets the readers know when he was stopped out, etc. I think that what he does is equally important as his system.
To read more about this system, visit the thread on babypips.com, click here.
