J2S Backtest: Steven Primo`s Big Trend StrategyIs it possible to benefit from big trend moves? In this study I present you a strategy that aims to capture big trend moves.
Created by trader Steven Primo, The Big Trend strategy is advocates and shared through his YouTube channel without restrictions.
Note:
This is not an investment recommendation. The purpose of this study is only to share knowledge with the community on TradingView.
What is the purpose of the strategy?
The strategy focuses on capturing the movement of trends, providing an entry signal for both LONG and SHORT positions.
To which time-frame of a chart is it applicable to?
According to the author, it is applicable to any chart in different markets.
What about risk management?
The author does not establish a risk management model for strategy. This is left to the definition of each trader.
How are the trends identified in this strategy?
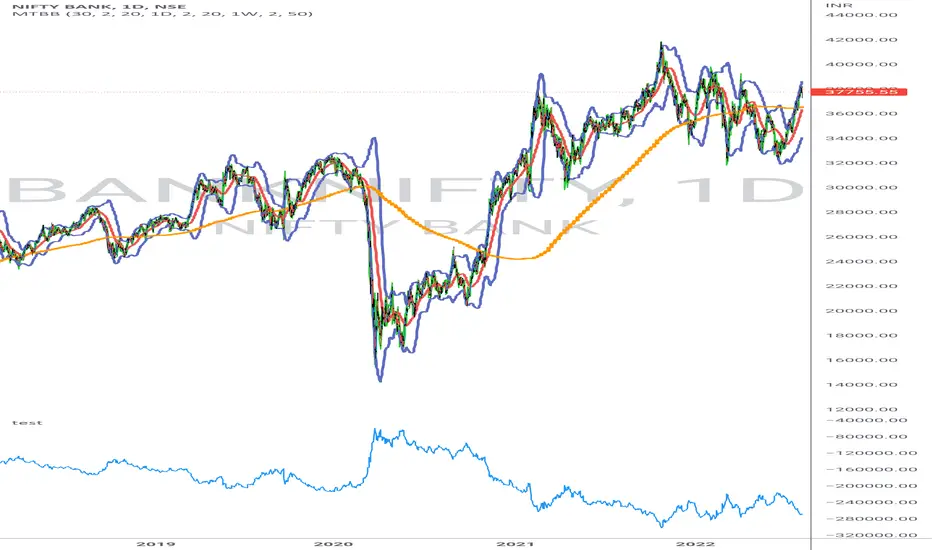
A 20-periods Bollinger Bands with 0.382 deviation should be plotted on the chart. Prices above the upper band indicate an uptrend, on the other hand, prices below the lower band indicate an downtrend. Finally, prices between the two bands indicate sideways trend.
How to identify a signal for LONG entry?
The signal is given after five consecutive closes above the upper Bollinger band. After that, you must enter the trade after the first trade occurs above the high of the signal bar.
How to identify a signal for SHORT entry?
The signal is given after five consecutive closes below the lower Bollinger band. After that, you must enter the trade after the first trade occurs below the low of the signal bar.
Tips and tricks
In my backtest, I tried to prove the strategy from a position trading perspective, so I proposed use fixed stop-loss and take-profits. The stop-loss is defined as being low of the first bar that generated the movement until the signal bar. The value range from the stop-loss to the signal bar is used in determining the profit target. Given any trade, position closing will be triggered when the bar trading limit is reached.
Backtest features
Backtest parameters are fully customizable, for instance: number of bars inside a trend indicating trend maturity for entry, bar limit for trading entry (after a buy or sell signals). Also, the user chooses to validate only LONG or SHORT entries, or both. It is also possible to determine the specific time period for running the backtests.
Final message
In my tests, I noticed excellent results for other crypto pairs, for example: ETH/USDT, BNB/USDT, FIL/USDT, GALA/USDT and ILV/USDT. Of course, no one strategy works perfectly for every asset, crypto, and bond out there. That's why we should explore each trading model and carry out our backtests. Please, feel free to provide me with any improvement suggestions for the backtest script. Bear in mind, feel free to use the ideas in my script in your studies.
Analisis Trend

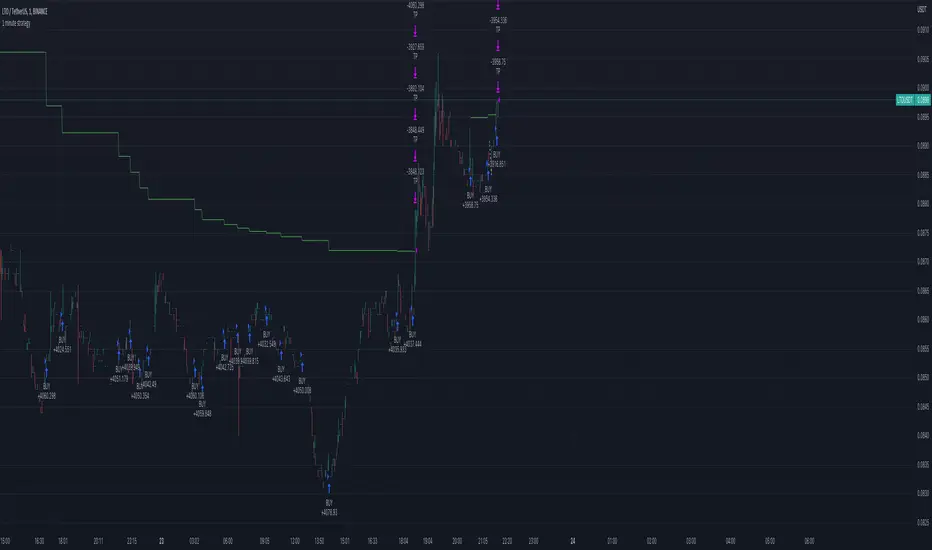
1 minute crypto strategy (MTF ZigZag)Please read the following explanation and notes before using this strategy.
This strategy is based on pyramiding. It uses two trend indicators(zigzag) in two different timeframes. One can be used to identify trend in higher timeframe and the other can be used to identify trend in smaller time frame. You can change them according to your preference. The default timeframes are set the same so the strategy only opens the trades according to one timeframe (20min). You can change the timeframe of the trend indicators to any timeframe in the settings but first you should add that timeframe to your chart timeframe so you can see that timeframe in the settings.
The first timeframe is for lower timeframe trend identification and the second timeframe is for higher timeframe identification in the settings.
IMPORTANT NOTES:
1. This strategy works best with low cap high volatile Cryptos. It is riskier on big cap cryptos in long term since it takes longer for them to recover from a big drop.
2. This strategy works in any timeframe. The lower the TF the higher profit.
3. This strategy is LONG only (spot).
4. It is very important to run a deep backtest (for example 1 year) and change the settings accordingly on the cryptos you want to trade to see how it performs in longterm.
5. The default pyramiding value is 30 and 3.33% of the portfolio (100/30=3.33%) is used for each trade. It means the strategy opens maximum 30 trades before the TP is hit. If you change the pyramiding you should also change order size as well in order for the strategy to show the exact calculation (your portfolio amount percentage/pyramiding value=ordersize percentage). If you increase pyramiding value the strategy performs safer in long term.
6. The default TP is 1% and the default SL is 80%. You can change the settings according to the backtest on the coins you want to trade. But it is better not to increase the TP.
7. The indicators don't repaint.
8. Please make sure to backtest and fully understand the way this strategy works before using it.
Range Strat - MACD/RSIThis strategy uses a trend based indicator (MACD) for entry/exit signals with a momentum oscillator (RSI) to act as confirmation. Although relying on a trend based indicator this has been created for range bound crypto markets, which have been in a period of chop since June 2022.
Long/Short signals are generated from MACD with the RSI oscillator thresholds suppressing entries at price extremes. This is not a mean reversion RSI strategy! As the indicators are contrary to each other you will need to be generous with the RSI settings in order for signals to trigger.
Strategy is designed for use on the 4h timeframe, it may work well on higher timeframes, but lower time frames will lead to false signals. Use fixed percentage of equity for order size to capture the compounding effect. As a reversal strategy bear in mind that should market trend strongly in either direction stops will be required.
The RSI thresholds can be tailored to provide higher frequency or safer signals. Similarly tweaking MACD settings will provide earlier/more frequent or safer signals. As this is intended to enter near range high / low you should check the visual cues to ensure a ping-pong effect is observed, so that peaks and troughs are captured. Once an observable range is established the strategy works well across a range of crypto markets,
The script is open source, so feel free to amend as you wish. Using a different momentum oscillator may provide better results. I have prior coding experience, but first time using PineScript was last night, so it's not very tidy. I will update this with some additional customisation and TP/SL in the near future.
Usage: Range bound markets
Markets: Cryptocurrency Alts/BTC/ETH
Timeframe: 4h

Longbithello Traders !
Inspired by the indicator Range Filter Buy and Sell 5min by guikroth , namely calculation and works price movement range filter .
And Inspired by the indicator by the indicator VuManChu Cipher B + Divergences by vumanchu namely calculation and working out divergences and convergences , i was inspired to create a strategy .
This is indicator - strategy - ( Longbit ) - aggregate and my modification indicators : Range Filter Buy and Sell 5min by guikroth , VuManChu Cipher B + Divergences by vumanchu , and diferent exponential moving average .
The strategy - ( Longbit ) works on the basis of the price movement range filter , first a smooth average price range is calculated for the basis of the filter and multiplied by a specified amount by indicator Range Filter Buy and Sell 5min by guikroth , and some calculations working out divergences and convergences by indicator VuManChu Cipher B + Divergences by vumanchu . And diferent exponential moving averages for zones Bull / Bear trend for trend trading , and using take and diferent stop loss : algo , user or percentage .
Thus, using my strategy, we get the best entry point to open trades after confirming divergences
example in the picture
or
And when these trend signals are much stronger
example in the picture
Actual Version recommended used for BTCUSDC / BTCUSDT 4 hours time frame and used default settings and stop loss - algo , take profit 6 %
example in the picture
But it can also be used on all time frame with these settings: MaxMin3 Data Sampling period 6 Range Multiplier 2 and Take profit 2.3 % , stop loss algo
DISCLAIMER: This informational planning script / strategy is strictly for individual use and educational purposes only. This is not financial or investment advice. Investments are always made at your own risk and are based on your personal judgement. I am not responsible for any losses you may incur.
Привет, Трейдеры ! Вдохновленный индикатором Range Filter Buy and Sell 5min by guikroth , а именно работой и вычеслением диапазона фильтра движения цены . А также вдохновленный индикатором VuManChu Cipher B + Divergences by vumanchu, а именно дивергенций и конвергенций , я был вдохновлен создать эту стратегию
Эта тратегия - (Longbit) - это совокупность индикаторов : Range Filter Buy and Sell 5min by guikroth , VuManChu Cipher B + Divergences by vumanchu, и разние виды экспоненциальных средних .
Стратегия - (Longbit) работает на основе фильтра диапазона изменения цен, сначала рассчитывается гладкий средней диапазон цен для базы фильтра и умножается на оговоренную сумму по индикатору Range Filter Buy and Sell 5min by guikroth модифицированой версии , а также некоторые расчеты вычислений дивергенций и конвергенции по показателю индикатора VuManChu Cipher B+ Divergences by vumanchu. И различные экспоненциальные среднее и их зон для определения тенденции либо трендов для торговли по тренду , и с использованием стоп лоса : алго, пользовательский или процентный .
Таким образом, используя мою стратегию, мы получим лучшую точку для открытия сделок после подтверждения дивергенций или конвергенций
А когда эти сигналы по тренду они намного сильнее на рисунке , примеры на картинках выше
Рекомендуемую для 4-часового тм BTCUSDC/BTCUSDT , и работать с помощью algo stop loss , и take в 6 % с настройками по умолчанию , но можно также на использовать на всех тм с такой вот настройкой :
Данные МакМин3
Sampling period 6
Range Multiplier 2
Примеры на картинках выше
Предупреждаю : Эта стратегия информационного планирования предназначен исключительно для индивидуального пользования и образовательных целей. Это не финансовая или инвестиционная консультация. Инвестиции всегда осуществляются на собственном риске и основываются на вашем личном суждении. Я не отвечаю за потери, которые вы можете понести.

VXMA BotThis strategy is separated version of Cloud MA form VXD Cloud Edition, Let called it "VXMA".
what's changed?
renew TP/SL Work
Simplify code and clean look.
Risk:Reward Calculation
Risk of Ruin Setting can now selected between Fixed $ or %
if Buy your Stoploss will be Swing low
if Sell your Stoploss will be Swing high and can be setting at Pivot Setting
then Auto Position Sizing and TP line will be calculated form there and will show in Orange color line (Draw Position Box is available)
Alert Setting
{{strategy.order.alert_message}}
Python-Bot
github.com
There are 2 mode : one-way mode and hedge mode is different script on my Github profile.
read README. MD and there's video tutorial.
Pls study app.py and it's script before deploy for your own safty and your own risk, I'm NOT responsible for your loss.
GOODLUCK

VIPThis indicator is using the modified "SSS".
This strategy uses combined indicators to create LONG entry points, the strategy was first found by saudALThaidy.
How to use: Open your asset and pick a timeframe between 5min and 2hours (recommended: 30min, 45min), the strategy will give entry points itself, you can monitor and take profit manually(recommended), or you can use the exit setup.
exit setup:
Take Profit : close the trade and take profit after the specified percentage from the entry point gets hit.
Use Stop Percentage : if false, trade will be closed if it gets below MA line, if true it will use the next set up.
StopLose Percentage : specify a percentage to close the trade if the asset price goes below it.
Important Notes:
As saudALThaidy states that the strategy must be used with -heiken ashi- candles for the best result.
for best use of the strategy, use (Take Profit = 1,Use Stop Percentage=false) to get every trade, and take profit manually when ever you see the best.
For any notes on the strategy to be edited, or for another strategies ideas please comment.

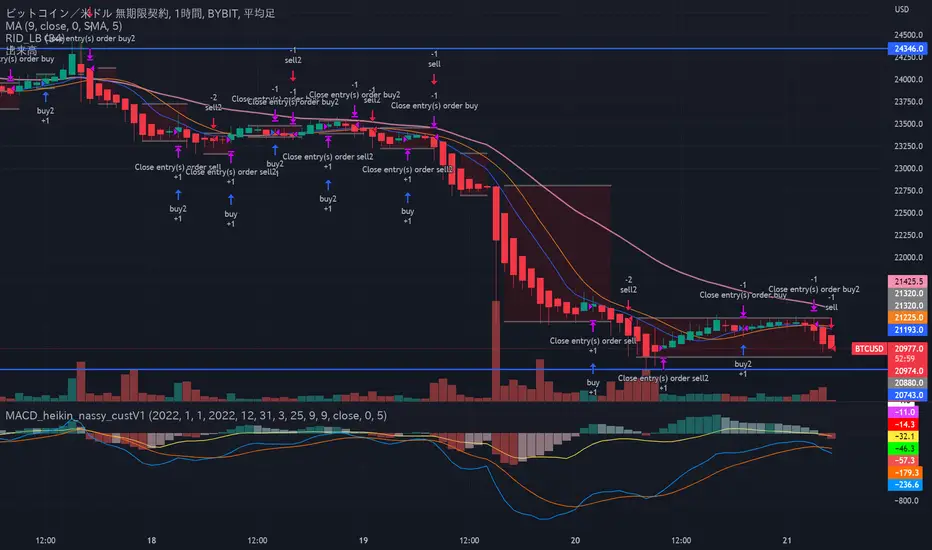
Customized MACD strategy with heikin_ashi chart V1Based on MACD strategy and using "heikin ashi" bar on chart.
It is optimized for BTCUSD and backtested from Jan, 2022.
BYBIT:BTCUSD
・Use crossover/under trigger
・Watch price and macd grow up/down
・Judge trend changing point
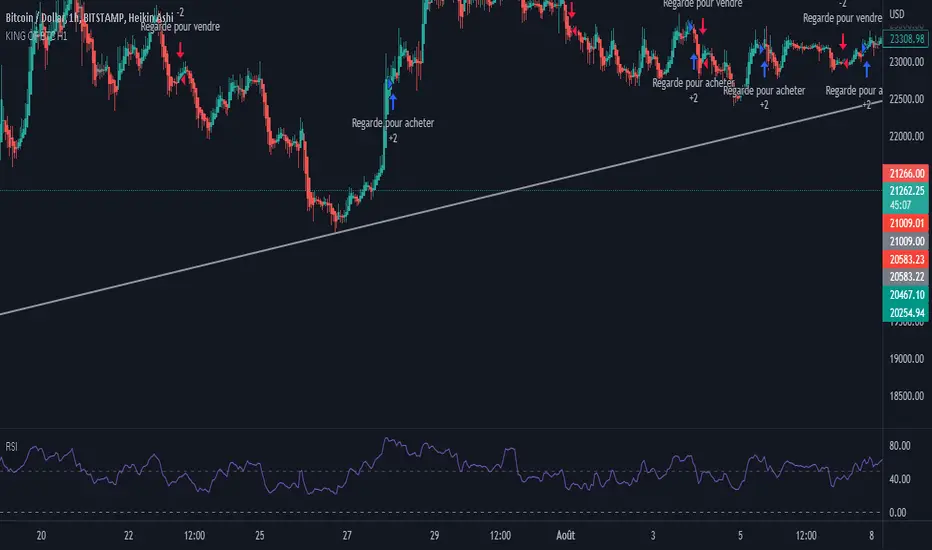
Ultimate Bitcoin StrategyThis is my masterpiece.
I recommend using it following strict rules:
Buy = Wait for the next green Heikein Ashi candle and RSI above 50
Sell: Wait for the next red Heikein Ashi candle and RSI below 50
Use it in H1
Enjoy.
歐咪茄1號策略 ETH2此策略依照曲線不同包含了macd、 ADX 、RSI等作為數據綜合判斷 當然也包含成交量去做預判
不做止損為設定 將行情可能發生的誘多誘空行為規避達到更好的盈利
此策略針對ETH 30MIN為主 其他時框幣種不可以
Strategies include macd, ADX, RSI..., which are judged according to different curves as comprehensive data. Of course, it also includes trading volumes for forecasting.
Do not set stop loss to avoid possible long and short market behavior in the market to obtain better profits
This strategy is based on ETH 30MIN, other time frame currencies are not allowed

Ichimoku Cloud with MACD (By Coinrule)The Ichimoku Cloud is a collection of technical indicators that show support and resistance levels, as well as momentum and trend direction. It does this by taking multiple averages and plotting them on a chart. It also uses these figures to compute a “cloud” that attempts to forecast where the price may find support or resistance in the future.
The Ichimoku Cloud was developed by Goichi Hosoda, a Japanese journalist, and published in the late 1960s. It provides more data points than the standard candlestick chart. While it seems complicated at first glance, those familiar with how to read the charts often find it easy to understand with well-defined trading signals.
The Ichimoku Cloud is composed of five lines or calculations, two of which comprise a cloud where the difference between the two lines is shaded in.
The lines include a nine-period average, a 26-period average, an average of those two averages, a 52-period average, and a lagging closing price line.
The cloud is a key part of the indicator. When the price is below the cloud, the trend is down. When the price is above the cloud, the trend is up.
The above trend signals are strengthened if the cloud is moving in the same direction as the price. For example, during an uptrend, the top of the cloud is moving up, or during a downtrend, the bottom of the cloud is moving down.
The MACD is a trend following momentum indicator and provides identification of short-term trend direction. In this variation it utilises the 12-period as the fast and 26-period as the slow length EMAs, with signal smoothing set at 9.
This strategy combines the Ichimoku Cloud with the MACD indicator to better enter trades.
Long/Short orders are placed when three basic signals are triggered.
Long Position:
Tenkan-Sen is above the Kijun-Sen
Chikou-Span is above the close of 26 bars ago
Close is above the Kumo Cloud
MACD line crosses over the signal line
Short Position:
Tenkan-Sen is below the Kijun-Sen
Chikou-Span is below the close of 26 bars ago
Close is below the Kumo Cloud
MACD line crosses under the signal line
The script is backtested from 1 June 2022 and provides good returns.
The strategy assumes each order is using 30% of the available coins to make the results more realistic and to simulate you only ran this strategy on 30% of your holdings. A trading fee of 0.1% is also taken into account and is aligned to the base fee applied on Binance.
This script also works well on MATIC (1h timeframe), AVA (45m timeframe), and BTC (30m timeframe).

VXD Cloud Edition for Python-Binance-bots.VXD Cloud Edition for Python-Binance-bots.
to overcome sideways market conditions this cloud configured for low timeframe.
every TA is same as VXD Cloud Edition but custom alert message for bots.
Risk:Reward Calculation
Risk of Ruin Setting can now selected between Fixed $ or %
if Buy your Stoploss will be Swing low
if Sell your Stoploss will be Swing high and can be setting at Pivot Setting
then Auto Position Sizing and TP line will be calculated form there and will show in Orange color line (Draw Position Box is available)
Tailing SL when price greater than RR=1
Alert Setting
{{strategy.order.alert_message}}
Python-Bot
github.com
There are 2 mode : one-way mode and hedge mode is different script in my Github profile.
read README.MD and there's video tutorial in thai language.
Pls study app.py and it's script before deploy for your own safty and your own risk, I'm NOT responsible for your loss.

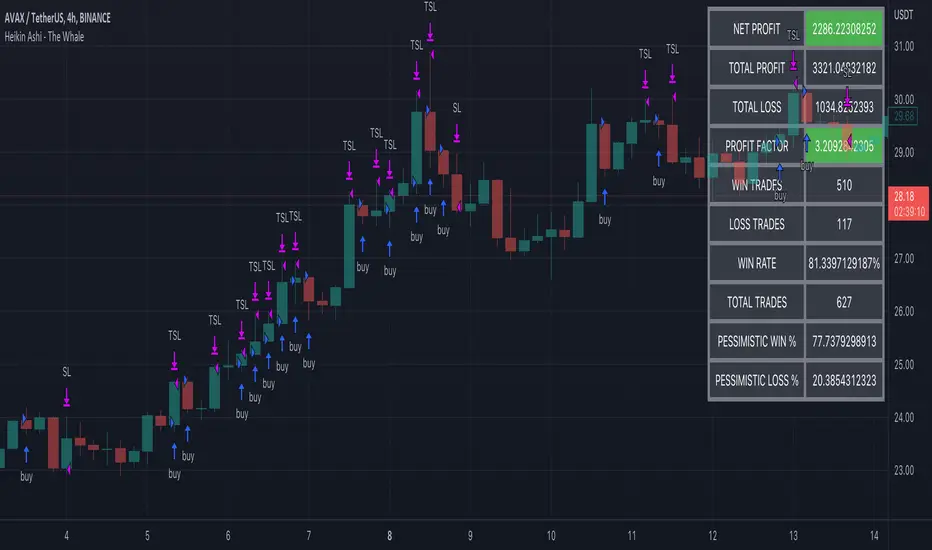
Heikin Ashi - The WhaleThe strategy is based on Heikin Ashi calculation, you do not need to switch the candle to HA.
The HA is used as a base entry, if a candle or two candles are bullish, then is valid to open a position, you can select the validation, one or two candles.
Also, the strategy mainly uses volume indicators as a confluence, you can select VWAP , VWMA , and Volume Oscillator, in addition to ADX which has two ways to validate the entry.
Base entry: One or two bullish HA candles (candles without a lower wick)
Confluence Indicators:
ADX: Will give a positive signal only if ADX is above the threshold, or if +DI is above -DI, or both.
VWAP: will give a positive signal if HA close is above VWAP.
VWMA: composite of 3 MA (20, 25, 50). There are multiple options to set it as confluence, the first option is to check if the short is bigger than the long and long is bigger than the base. The other options are to check the close status, which is bigger than which MA. You can find the description of each option in the strategy box
The sell is based on trailing stop loss (TSL), while the stop loss is based lowest X candle, the strategy will look back to the lowest number of the HA candles and set it as stop loss.
DCA Average Arbitrage - The Quant ScienceDCA Average Arbitrage - The Quant Science™ is a quantitative algorithm based on a DCA model that uses averaging to create a statistical arbitrage system.
DESCRIPTION
The algorithm can be set long or short.
1. Long algorithm: opens long positions with 100% of the capital every time the price deviates negatively for a certain percentage distance from the average.
2. Short algorithm: opens short positions with 100% of capital every time the price deviates positively for a certain percentage distance from the average.
The closing of positions depends on the parameters activated by the user. The user can set the closing on the reverse condition and/or add functions such as stop loss, take profit and closing after a certain bar period.
USER INTERFACE SETTING
The user chooses the long or short direction and sets the parameters for average as length, source and percent distance.
AUTO TRADING COMPLIANT
With the user interface, the trader can easily set up this algorithm for automatic trading. Automating it is very simple, activate the alert functions and enter the links generated by your broker.
BACKTESTING INCLUDED
With the user interface, the trader can adjust the backtesting period of the strategy before putting it live. You can analyze large periods such as years or months or focus on short-term periods.
NO LIMIT TIMEFRAME
This algorithm can be used on all timeframes and is ideal for lower timeframes.
GENERAL FEATURES
Multi-strategy: the algorithm can apply either the long strategy or the short strategy.
Built-in alerts: the algorithm contains alerts that can be customized from the user interface.
Integrated indicator: the quantity indicator is included.
Backtesting included: automatic backtesting of the strategy is generated based on the values set.
Auto-trading compliant: functions for auto trading are included.
ABOUT THE BACKTEST
Backtesting refers to the period 1 January 2022 - today, ticker: ICP/USDT, timeframe 5 minutes.
Initial capital: $1000.00
Commission per trade: 0.03%

The Impeccable by zyberalThis strategy works differently than others, it uses the IchimokuTenkan, Kijun, and Senkou periods to compute a general sense of market trend. Then I used the MACD fast, slow, and smooth with custom inputs to compute a optimum cross for finding macro bottoms and tops for any asset. This strategy doesn't trade on weekends and does not have a set TP (take profit) for each long or short.

[B_2] 15min Crypto (Based on Technical Analysis)Republish.
HOW IT WORKS:
+ Open Long: When price close above Kumo Cloud 15m, SuperTrend 15m, RSI > 50, MACD signal (12,26,19) >0, break up Pivot High previous. Dont open long when price close just below resistants in higher timeframe (SuperTrend 2H, 4H).
+ Exit Long: When price hit TPs or SL or having Short Signals.
+ Open Short: When price close below Kumo Cloud 15m, SuperTrend 15m, RSI < 50, MACD signal (12,26,19) <0, break down Pivot Low previous.
+ Exit Short: When price hit TPs or SL or having Long Signals.
HOW TO DO IT:
Very easy to use this script. It only has 2 parts: SETUP ENTRY and SETUP EXIT.
1. SETUP ENTRY:
This strategy uses the rule of dividing capital to enter multiple orders. For example, a common rule 5-3-2 (ie: total capital is 100%, entry 1 is 50%, entry 2 is 30% and entry 3 is 20%). In this strategy, I split my capital into 4 entries. You can customize the capital percentage and price deviation for each entry.
2. SETUP EXIT:
+ Multi profit.
+ Stoploss: you have two options: Stoploss based on percentage or ATR.
+ When price hit TP1, you have two options: only move Stoploss to entry or active trailing.
BACKTEST: You can backtest this strategy on coins: ETH, CRV , RUNE, MATIC, SRM and some like: MKRUSDTPERP , AAVEUSDTPERP , SOLUSDTPERP , ETCUSDTPERP , FILUSDTPERP , BALUSDTPERP , NEARUSDTPERP , SRMUSDTPERP , ALPHAUSDTPERP , DGBUSDTPERP, ...
If you want use this scripts with setup alert or open code, please inbox to me, you are always welcome.

Ichimoku Cloud with RSI (By Coinrule)The Ichimoku Cloud is a collection of technical indicators that show support and resistance levels, as well as momentum and trend direction. It does this by taking multiple averages and plotting them on a chart. It also uses these figures to compute a “cloud” that attempts to forecast where the price may find support or resistance in the future.
The Ichimoku Cloud was developed by Goichi Hosoda, a Japanese journalist, and published in the late 1960s. It provides more data points than the standard candlestick chart. While it seems complicated at first glance, those familiar with how to read the charts often find it easy to understand with well-defined trading signals.
The Ichimoku Cloud is composed of five lines or calculations, two of which comprise a cloud where the difference between the two lines is shaded in.
The lines include a nine-period average, a 26-period average, an average of those two averages, a 52-period average, and a lagging closing price line.
The cloud is a key part of the indicator. When the price is below the cloud, the trend is down. When the price is above the cloud, the trend is up.
The above trend signals are strengthened if the cloud is moving in the same direction as the price. For example, during an uptrend, the top of the cloud is moving up, or during a downtrend, the bottom of the cloud is moving down.
This strategy combines the Ichimoku Cloud with the RSI indicator to better enter trades.
Long/Short orders are placed when three basic signals are triggered.
Long Position:
Tenkan-Sen is above the Kijun-Sen
Chikou-Span is above the close of 26 bars ago
Close is above the Kumo Cloud
RSI is greater less than 50
Short Position:
Tenkan-Sen is below the Kijun-Sen
Chikou-Span is below the close of 26 bars ago
Close is below the Kumo Cloud
RSI is greater than 50
The script is backtested from 1 June 2022 and provides good returns.
The strategy assumes each order is using 30% of the available coins to make the results more realistic and to simulate you only ran this strategy on 30% of your holdings. A trading fee of 0.1% is also taken into account and is aligned to the base fee applied on Binance.
This script also works well on SOL (45m timeframe), BNB (1h timeframe), and ETH (1h timeframe).

AlphaTrend StrategyThe strategy version of AlphaTrend indicator for backtesting and optimisation purposes for TradingView users:
Screener / Explorer version and an English explantion video will be published soon...
AlphaTrend's parameters are designed for daily and 4H charts, feel free to optimize on all time frames.
Hope you all use Alphatrend in your profitable trades.
Kıvanç

Swing Trend StrategyThis script is a trend following system which uses a long term Moving Average to spot the trend in combination with the Average True Range to filter out Fakeouts, limiting the overall drawdown.
Default Settings and Calculation:
- The trend is detected using the Exponential Moving Average on 200 periods.
- The Average True Range is calculated on 10 periods.
- The Market is considered in an Uptrend when the price closes above the EMA + ATR.
- The Market is considered in a Downtrend when the price closes below the EMA - ATR.
- The strategy will open a LONG position when the market is in an Uptrend.
- The strategy will close its LONG positions when the price closes below the EMA.
- The strategy will open a SHORT position when the market is in a Downtrend.
- The strategy will close its SHORT positions when the price closes above the EMA.
This script is best suited for the 4h timeframe, and shows good results on BTC and ETH especially.
The options allow to modify the type of moving average to use, the period of the moving average, the ATR multiplier to add as well as the possibility to open short trades or not.

Trade HourThis script is just finds the best hour to buy and sell hour in a day by checking chart movements in past
For example if the red line is on the 0.63 on BTC/USDT chart it mean the start of 12AM hour on a day is the best hour to buy (all based on
It's just for 1 hour time-frame but you can test it on other charts.
IMPORTANT: You can change time Zone in strategy settings.to get the real hours as your location timezone
IMPORTANT: Its for now just for BTC/USDT but you can optimize and test for other charts...
IMPORTANT: A green and red background color calculated for show the user the best places of buy and sell (green : positive signal, red: negative signals)
settings :
timezone : We choice a time frame for our indicator as our geo location
source : A source to calculate rate of change for it
Time Period : Time period of ROC indicator
About Calculations:
1- We first get a plot that just showing the present hour as a zigzag plot
2- So we use an indicator ( Rate of change ) to calculate chart movements as positive and negative numbers. I tested ROC is the best indicator but you can test close-open or real indicator or etc as indicator.
3 - for observe effects of all previous data we should indicator_cum that just a full sum of indicator values.
4- now we need to split this effects to hours and find out which hour is the best place to buy and which is the best for sell. Ok we should just calculate multiple of hour*indicator and get complete sum of it so:
5- we will divide this number to indicator_cum : (indicator_mul_hour_cum) / indicator_cum
6- Now we have the best hour to buy! and for best sell we should just reverse the ROC indicator and recalculate the best hour for it!
7- A green and red background color calculated for show the user the best places of buy and sell that dynamically changing with observing green and red plots(green : positive signal, red: negative signals) when green plot on 15 so each day on hour 15 the background of strategy indicator will change to 15 and if its go upper after some days and reached to 16 the background green color will move to 16 dynamically.

Bitcoin Scalping Strategy (Sampled with: PMARP+MADRID MA RIBBON)
DISCLAIMER:
THE CONTENT WITHIN THIS STRATEGY IS CREATED FROM TWO INDICATORS CREATED BY TWO PINESCRIPTER'S. THE STRATEGY WAS EXECUTED BY MYSELF AND REVERSE-ENGINEERED TO MEET THE CONDITIONS OF THE INTENDED STRATEGY REQUESTOR. I DO NOT TAKE CREDIT FOR THE CONTENT WITHIN THE ESTABLISHED LINES MADE CLEAR BY MYSELF.
The Sampled Scripts and creators:
PMAR/PMARP by @The_Caretaker Link to original script:
Madrid MA RIBBON BAR by @Madrid Link to original script:
Cheat Code's strategy notes:
This sampled strategy (Requested by @elemy_eth) is one combining previously created studies. I reverse-engineered the local scope for the Madrid moving average color plots and set entry and exit conditions for certain criteria met. This strategy is meant to deliver an extremely high hit rate on a daily time frame. This is made possible because of the very low take profit percentage, during the context of a macro downtrend it is made easier to hit 1-3% scalps which is made visible with the strategy using sampled scripts I created here.
How it works:
Entry Conditions:
-Enter Long's if the lime color conditions are met true using the script detailed by Marid's MA
- No re-entry into positions needs to be met true (this prevents pyramiding of orders due to conditions being met true) applicable to both long and short side entries.
- To increase hit rate and prevent traps both the parameters of rsi being sub 80 and no previously engulfing candles need to be met true to enter a long position.
- Enter Short's if the red color conditions of Madrid's moving average are met true.
- Closing Long positions are typically not met within this indicator, however, it still sometimes triggers if necessary. This consists of a pmarp sub 99 and a position size greater than 0.0
- Closing Short positions are typically not met within this indicator, however, it still sometimes triggers if necessary. This consists of a pmarp over 01 and a position size less than 0.0
- Stop Loss: 27.75% Take Profit: 1% (Which does not trigger on ticks over 1% so you will see average trade profits greater than 1%)
BYBIT:BTCUSDT BINANCE:BTCUSDT COINBASE:BTCUSD
Best Of Luck :)
-CheatCode1

RSI Improved strategySet a Horizontal Ray at the price that relates highest / lowest RSI .
It 's more clear to decide when to open long / short position manually.
It's a scalping strategy that works in 15min chart(basically works in most of timeframe , if you don't look it as a scalping strategy), when RSI hits Highest / Lowest value , the strategy will open a Long / Short position.
The Default Risk Reward Ratio was 1 (1600 points : 1600 points) you can adjust it in settings
You guys can look it as a RSI alert indicator
Think before you do , use it wisely. Thanks a lot!
There is a lot of useless words in Pine if you wanna look it please ignore it.

Trend Ravi TrialTrial for trend analysis
it was not difficult to convert to look like and work like Trend Trader Karan's Tool, who invested " Lakho Rupaya" and works on the basis of price action trading also.
Let me tell you guys, this is nothing but an ATR based system which people already traded as Half Trend, Super Trend and various names. Half Trend is no more a copyrighted indicator, which stopped marketing after being exposed, but people are still cheating with such indicators.
3LS | 3 Line Strike Strategy [Kintsugi Trading]What is the 3LS | 3 Line Strike Strategy?
Incorporating the 3 Line Strike candlestick pattern into our strategy was inspired by Arty at The Moving Average and the amazing traders at TheTrdFloor .
The Three Line Strike is a trend continuation candlestick pattern consisting of four candles. Depending on their heights and collocation, a bullish or a bearish trend continuation can be predicted.
In a symphony of trend analysis, price action, and volume we can find and place high-probability trades with the 3LS Strategy.
How to use it!
----- First, start by choosing a Stop-Loss Strategy, Stop PIP Size, and Risk/Reward Ratio -----
- Stop-Loss Strategy
Fixed PIP Size – This uses the top/bottom of the indicator candle and places a TP based on the chosen Risk:Reward ratio.
ATR Trail (No set Target Profit, only uses ATR Stop)
ATR Trail-Stop (Has set Target Profit, however, stop is based on ATR inputs)
**If you choose an ATR Stop-Loss Strategy - input the desired ATR period and Multiple you would like the stop to be calculated at**
**ATR Stop-Loss Strategies have a unique alert setup for Auto-Trading. See Auto-Trading Section**
- Risk/Reward Ratio = If you have a .5 risk/reward, it means you are risking $100 to make $50.
- Additional Stop PIP Size = Number of PIPs over the default stop location of the top or bottom of the indicator candle.
----- Next, we set the Session Filter -----
Set the Timezone and Trade Session you desire. If no specific session is desired, simply set the Trade Session to 00:00 - 00:00.
----- Next, we set the Moving Average Cloud Fill -----
Enter the Fast and Slow Moving Average Length used to calculate trend direction:
MA Period Fast
MA Period Slow
These inputs will determine whether the strategy looks for Long or Short positions.
----- Next, we set the VSA – Volume Spread Analysis Settings -----
Check the box to show the indicator at the bottom of the chart if desired.
This is just a different visual output of the VSA | Volume Spread Analysis indicator available for free under the community indicators tab. You can add that indicator to your chart and see the same output in candle format.
In combination with the Moving Average Cloud, the Volume Spread Analysis will help us determine when to take a trade and in what direction.
The strategy is essentially looking for small reversals going against the overall trend and placing a trade once that reversal ends and the price moves back in the direction of the overall trend.
The 3LS Strategy utilizes confirmation between trend, volume, and price action to place high probability trades.
The VSA is completely customizable by:
Moving Average Length
MA-1 Multiplier
MA-2 Multiplier
MA-3 Multiplier
Check out the VSA | Volume Spread Analysis indicator in the community scripts section under the indicators tab to use this awesome resource on other strategies.
----- Next, we have the option to view the automated KT Bull/Bear Signals -----
Check the boxes to show the buy-sell signal on the chart if desired.
----- Next, we set the risk we want to use if Auto Trading the strategy -----
I always suggest using no more than 1-3% of your total account balance per trade. Remember, if you have multiple strategies triggering per day with each using 1%, the total percent at risk will be much larger.
For Example – if you have 10 strategies each risking 1% your total risk is 10% of your account, not 1%! Be mindful to only use 1-3% of your total account balance across all strategies, not just each individual one.
----- Finally, we backtest our ideas -----
After using the 'Strategy Tester' tab on TradingView to thoroughly backtest your predictions you are ready to take it to the next level - Automated Trading!
This was my whole reason for creating the script. If you work a full-time job, live in a time zone that is hard to trade, or just don't have the patience, this will be a game-changer for you as it was for me.
Auto-Trading
When it comes to auto-trading this strategy I have included two options in the script that utilize the alert messages generated by TradingView.
*Note: Please trade on a demo account until you feel comfortable enough to use real money, and then please stick to 1%-2% of your total account value in risk per trade.*
AutoView
PineConnector
**ATR Auto-Trading Alert Setup**
How to create alerts on 3 Line Strike Strategy
For Trailing Stops:
1) Adjust autoview/pineconnector settings
2) Click "add alert"
3) Select "Condition" = Strategy Name
4) Select "Order Fills Only" from the drop-down
3) Remove template message text from "message" box and place the exact text. '{{strategy.order.alert_message}}'
4) Click "create"
For Fixed Pip Stop:
1) Adjust autoview/pineconnector settings
2) Click "add alert"
3) Select "Condition" = Strategy Name
4) Select "alert() function calls only"
5) I like to title my Alert Name the same thing I named it as an Indicator Template to keep track
Good luck with your trading!
