David Varadi Intermediate OscillatorThe David Varadi Intermediate Oscillator (DVI) is a composite momentum oscillator designed to generate trading signals based on two key factors: the magnitude of returns over different time windows and the stretch, which measures the relative number of up versus down days. By combining these factors, the DVI aims to provide a reliable and objective assessment of market trends and momentum.
Methodology:
To calculate the DVI, a specific formula is applied. The magnitude component involves averaging smoothed returns over various lengths, weighted according to user-defined parameters. This calculation helps determine the magnitude of price changes. The stretch component follows a similar process, averaging smoothed returns over different lengths to gauge market momentum. Users have the flexibility to adjust the weights and lengths to suit their trading preferences and styles.
Utility:
The DVI offers versatility in its applications. It can be used for both momentum trading and trend analysis due to its smooth and consistent signals. Unlike some other oscillators, the DVI provides longer and uncorrelated signals, allowing traders to effectively combine trend-following and mean-reversion strategies. For example, the DVI is adept at identifying overbought levels above the 200-day moving average, serving as a useful tool for determining exit points during price strength and even potential shorting opportunities. Traders can develop simple trading systems based on the DVI, buying above the 200-day moving average and selling when the DVI exceeds a specified threshold. Conversely, they can consider short positions below the 200-day moving average and cover when the DVI falls below a specific threshold. The DVI's objective approach to analyzing market momentum makes it a valuable resource for traders seeking to identify trading opportunities.
Key Features:
Bar coloring: based on Trend, Extremeties or Reversions
Reversions: Potential reversal points marked with triangles above\below oscillator
Extremity Hues: Highlighting oxcillator reaching traditional OB\OS levels
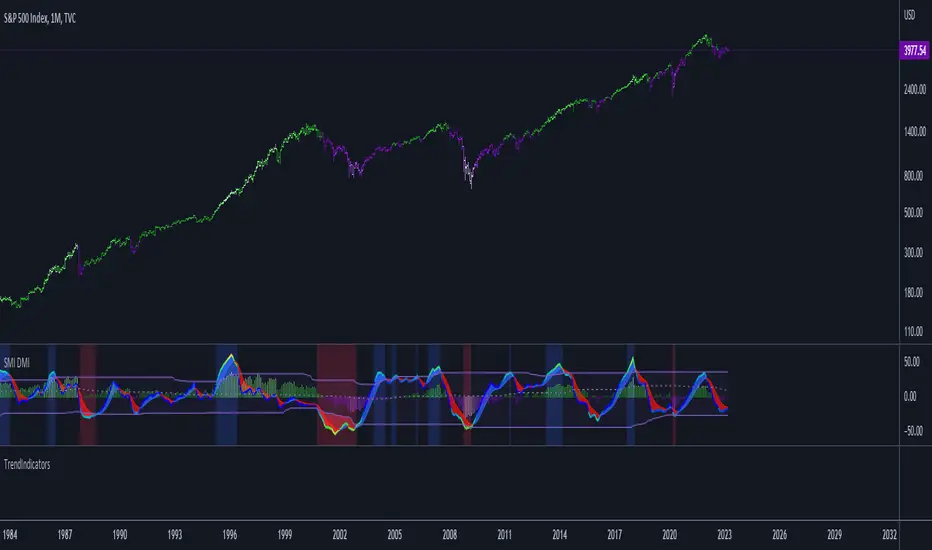
Example Charts:
Trendindicator

SuperBollingerTrend (Expo)█ Overview
The SuperBollingerTrend indicator is a combination of two popular technical analysis tools, Bollinger Bands, and SuperTrend. By fusing these two indicators, SuperBollingerTrend aims to provide traders with a more comprehensive view of the market, accounting for both volatility and trend direction. By combining trend identification with volatility analysis, the SuperBollingerTrend indicator provides traders with valuable insights into potential trend changes. It recognizes that high volatility levels often accompany stronger price momentum, which can result in the formation of new trends or the continuation of existing ones.
█ How Volatility Impacts Trends
Volatility can impact trends by expanding or contracting them, triggering trend reversals, leading to breakouts, and influencing risk management decisions. Traders need to analyze and monitor volatility levels in conjunction with trend analysis to gain a comprehensive understanding of market dynamics.
█ How to use
Trend Reversals: High volatility can result in more dramatic price fluctuations, which may lead to sharp trend reversals. For example, a sudden increase in volatility can cause a bullish trend to transition into a bearish one, or vice versa, as traders react to significant price swings.
Volatility Breakouts: Volatility can trigger breakouts in trends. Breakouts occur when the price breaks through a significant support or resistance level, indicating a potential shift in the trend. Higher volatility levels can increase the likelihood of breakouts, as they indicate stronger market momentum and increased buying or selling pressure. This indicator triggers when the volatility increases, and if the price is near a key level when the indicator alerts, it might trigger a great trend.
█ Features
Peak Signal Move
The indicator calculates the peak price move for each ZigZag and displays it under each signal. This highlights how much the market moved between the signals.
Average ZigZag Move
All price moves between two signals are stored, and the average or the median is calculated and displayed in a table. This gives traders a great idea of how much the market moves on average between two signals.
Take Profit
The Take Profit line is placed at the average or the median price move and gives traders a great idea of what they can expect in average profit from the latest signals.
-----------------
Disclaimer
The information contained in my Scripts/Indicators/Ideas/Algos/Systems does not constitute financial advice or a solicitation to buy or sell any securities of any type. I will not accept liability for any loss or damage, including without limitation any loss of profit, which may arise directly or indirectly from the use of or reliance on such information.
All investments involve risk, and the past performance of a security, industry, sector, market, financial product, trading strategy, backtest, or individual's trading does not guarantee future results or returns. Investors are fully responsible for any investment decisions they make. Such decisions should be based solely on an evaluation of their financial circumstances, investment objectives, risk tolerance, and liquidity needs.
My Scripts/Indicators/Ideas/Algos/Systems are only for educational purposes!

Trend IndicatorThis indicator has different features:
1. Ichimoku = this indicator can plot Ichimoku calculated both in the common formula and with the volume average, you can choose the calculator method for each line.
2. Channel and Bands = this mode allows the user to choose from channel and band, "channel" shows the Keltner channel, and "band" shows the Bollinger bands. Both the indicators are calculated including the volume in the formula of the average midpoint.
3. Color candle = this function allows the user to see two different colors of candles on the chart, the positive color occurs when both the long-term average and the short team average of price calculated using the volume is above the two averages calculated without the volume. This function is great to analyze the volume pressure, useful to identify trend continuation and exhaustion.
4. Extreme reversal zones = this is a version of the Keltner channels calculated over a high number of candles and with high deviation, to identify the potential zones of reversal.
Note that in the "Ichimoku" indicator, the backline is the T.R.A.M.A. indicator, created and published open source by Lux Algo, which I thank for the script.

TrendIndicatorsLibrary "TrendIndicators"
This is a library of 'Trend Indicators'.
It aims to facilitate the grouping of this category of indicators, and also offer the customized supply of
the source, not being restricted to just the closing price.
Indicators (this is a work in progress):
1. Absolute DI (Directional Moviment Index) (Difference between DI+ and DI-).
Used in 'DMI Stochastic Extreme' by Barbara Star.
2. DMI
DI_Abs(lengthDI, smoothDI, typeMA, lengthMA)
@description Absolute DI (Directional Moviment Index).
Used in 'DMI Stochastic Extreme' by Barbara Star.
Difference between DI+ and DI-
Parameters:
lengthDI : (int) Length of DI+/DI-
smoothDI : (bool) Sets whether absolute DI should be smoothed
typeMA : (int) Type of moving average of smoothing
lengthMA : (int) Length for moving average of smoothing
Returns: (float) Absolute value of DI
dmi(diLength, adxSmoothing)
@description DMI (Directional Movement Index)
Same as ta.dmi()
Parameters:
diLength : (int) Length of DI+/DI-
adxSmoothing : (int) ADX Smoothing
Returns: Tuple of three DMI series: Positive Directional
Movement (+DI), Negative Directional Movement (-DI) and Average Directional Movement Index (ADX).
dmi(source, diLength, adxSmoothing)
@description DMI (Directional Movement Index)
Customized version of ta.dmi(), with custom source
Parameters:
source : (float) Source for DI+/DI-
diLength : (int) Length of DI+/DI-
adxSmoothing : (int) ADX Smoothing
Returns: Tuple of three DMI series: Positive Directional
Movement (+DI), Negative Directional Movement (-DI) and Average Directional Movement Index (ADX).
Multi indicators tableThis is a comprehensive trading tool that presents an overview of the market in a tabular format. It consists of five distinct categories of trading indicators : Volatility, Trend, Momentum, Reversal, and Volume. Each category includes a series of indicators that are widely used in the trading communauty.
The Volatility category includes the Average True Range (ATR) and Bollinger Bands indicators. The Trend category comprises the Average Directional Index (ADX), four Exponential Moving Averages (EMAs), Aroon, Parabolic SAR, and the Supertrend. The Momentum category includes the Stochastic Relative Strength Index (StochRSI), Money Flow Index (MFI), Williams %R, Relative Strength Index (RSI), and Commodity Channel Index (CCI). The Reversal category includes Parabolic SAR, Moving Average Convergence Divergence (MACD), and PP Supertrend. Finally, the Volume category includes the Volume Exponential Moving Average (EMA) indicator.
The indicators states are easily readable, the indicator case is colored based on his actual state. A bullish color (green by default), a bearish color (red by default),
a very bullish color (dark green by default), a very bearish color (dark red by default) and a neutral color (gray by default) displayed when the indicator doesn't give us a clear signal. Some indicators do not have a very bullish or very bearish state. Concerning volatility indicators, the bullish color indicates high volatility, the bearish color indicates low volatility, and the neutral color indicates normal volatility.
Most of the indicators displayed in the table are customizable, and traders can choose to hide the categories they don't want to use. The Indicator provides a quick and easily readable view on the market and allows traders to reduce the number of indicators on their chart making it lighter and more readable.

Trend and Momentum DashboardI created this indicator to tell me when it's time to trade (going long) and when it's time to wait (or going short).
You can enter up to 13 ticker (default is S&P500 and key market segments).
For each ticker, fibonacci levels are calculated and represented either in 5 color or 3 color mode as single lines.
(Thanks to eykpunter for the fibonacci level implementation. I'm using his code and modified it slightly).
Color coding (5 color mode) explanation:
blue = in uptrend area
light blue = in prudent buyers area
gray = in center area
light red = in prudent sellers area
red = in downtrend area
The topline is a combination of all ticker and shows if the market is either bullish or bearish (threshold adjustable in settings)
The bullish/bearish trend can also be used as background color. Alternatively the last bar in the selected time period is been highlighted.
How to use it:
The indicator works on all timeframes. Use the color coding explanation above to see the status of each asset.
a) You can evaluate "long" term trend using day or week timeframe. e.g. I'm usually trading only long and stay out of the market when it is not bullish (top line & background = blue). I'm also using it to know which segments/assets are currently "hot".
b) You can evaluate short term momentum (using 1h or lower timeframe) and see in which direction the market/assets are moving. e.g. I use this when the exchanges open to see how the day is going to move.
I've attached 3 examples in the screenshot - first is the default, in the second one I'm using different asset classes and the third one is for crypto.
Limitations:
There are security request limits as well as string limitations for the security calls in pine script, so I went to the maximum what is currently possible.
(No financial advise, for testing purposes only)

Simple EMA trend indicatorSimple EMA trend indicator , pretty straightforward green equates to bullish and usually a retest/wick is often seen , same for the flipside viceversa

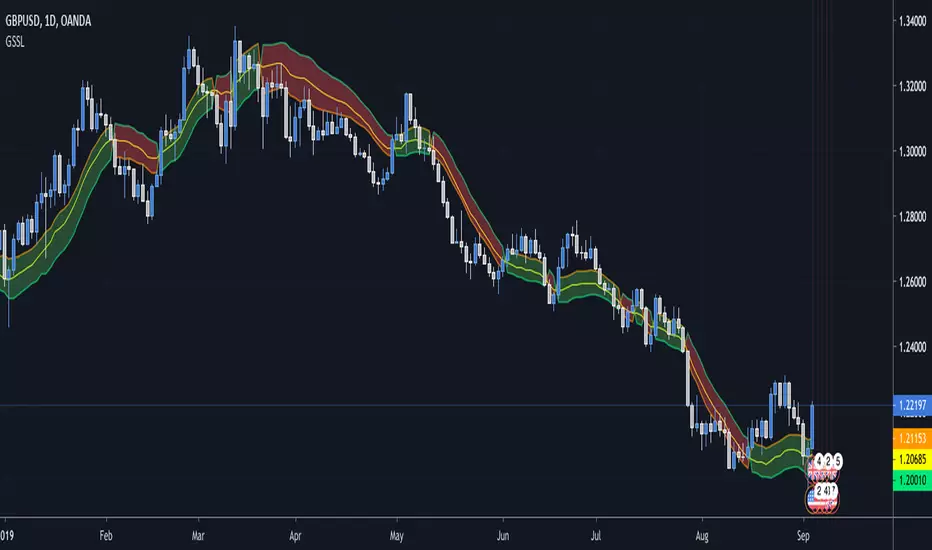
Generalized SSL by Vts// Generalized SSL:
// This is the very first time the SSL indicator, whose acronym I ignore, is on Tradingview.
// It is based on moving averages of the highs and lows.
// Similar channel indicators can be found, whereas
// this one implements the persistency inside the channel, which is rather tricky.
// The green line is the base line which decides entries and exits, possibly with trailing stops.
// With respect to the original version, here one can play with different moving averages.
// The default settings are (10,SMA)
//
// Vitelot/Yanez/Vts March 2019
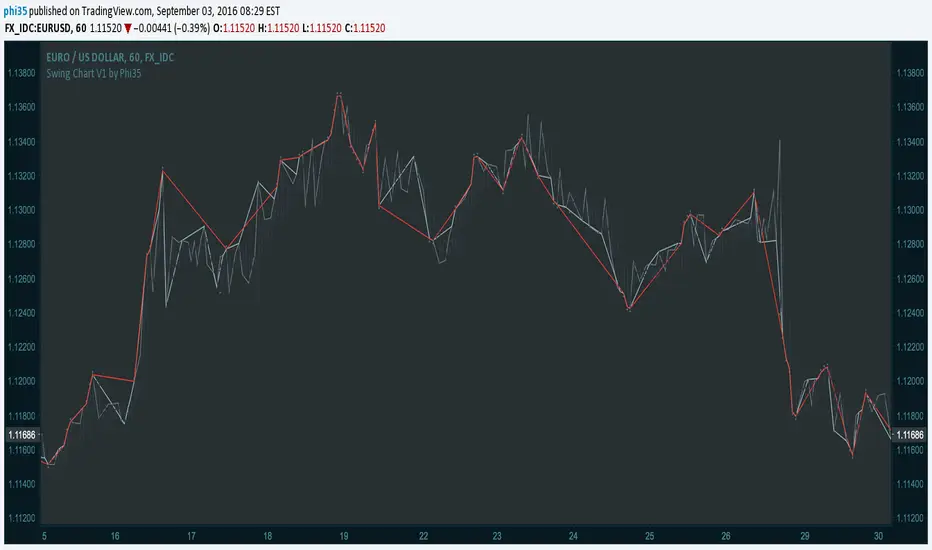
Swing Chart V1 by Phi35 © With this indicator, which plots the swing chart of the 3 degrees, swing traders can automate their work of tracking the right bars.
How it works:
Minor Degree (one bar) (gray)= If the current high is higher than the previous high or the current low is lower than the previous low.
Intermediate Degree (two bar) (baby blue)= If the current high is higher than previous and the penultimate high etc.
Main Degree (three bar) (red)= If the current high is higher than the previous, the penultimate and the high before penultimate high etc.
Alert:
On crossover there will be an alert (popup with a message) and in addition you will see "diamonds" on the place where the crossover took place
If there is an issue or any suggestions, feel free to contact me. Do not modify the code without permission.
Swing Chart V1 by Phi35 ©