LNL Pullback ArrowsBuying the dip has never been easier! LNL Pullback Arrows are here to pinpoint the best possible entries for the trend following setups. With the Pullback Arrows, trader can pick his own approach and risk level thanks to four different types of arrows. The goal of these arrows is to force the traders to scale in & out of trades which is in my opinion crucial when it comes to trend following strategies. These arrows were designed primarily for the daily & weekly time frame (swing trading).
Four Types of Pullback Arrows:
1. Aggro Arrows - Ideal for aggresive approach during parabolic trends. Sometimes trends are so strong that the price barely revisits the daily 8 EMA. This is where the aggro arrows can perfectly pinpoint the aggresive high risk entries. Ideal for halfsize or 1/4 size of the full position. Aiming for quick 1-2 day moves targeting the recent high/low. These arrows could be also named as scalping arrows for the swing traders. A quick In & Out.
2. HalfSize Arrows - Medium risk approach. First arrows to scale in. HalfSize arrows are the first sign that the pullback might be ending, yet there is still some space left for an even deeper pullback. That is the reason why they are called half-size. Ideally taken with half-sized position. When trading the HalfSize Arrows, It is better to have some "spare ammo in the gun" ready to use.
3. FullSize Arrows - Regular risk approach. These arrows represent a zone where the core of the posititon should be taken. The point of validity for the trend is not that far away, meaning the risk can be kept tight. Ideal for scailing the other halfs or quarters of the full position. Also great for more conservative traders or environments with higher volatility.
4. Rare Arrows - Offer the best risk to reward entries during the trend. Rare Arrows should be the "last kick" of the retracement, therefore stops can be positioned really tight. They either trigger the stop immidiately or they provide another juicy leg up or down in the direction of the trend. However, they really do appear rarely.
Simple EMA Cloud:
A simple cloud based on 21 and 55 exponential moving averages. This default length creates a pullback zone that is wide enough for the conservative traders but also give the opportunities to more aggresive traders. Alternatives such as 8 & 21, or 21 & 34 are forming the zone that is too aggresive and usually too thin. Of course, cloud can be fully adjusted or turned off completely. The only role of the cloud is to gauge the trend.
Tips & Tricks:
1.Importance of the Scailing
- As already stated, scailing is crucial to this since there is no way of knowing the exact level at which the price magically bounce every time. It is hard to tell where and which EMA will be respected. How can we know it will be 21 EMA every time? or 34 EMA or 10 EMA or 100 SMA or 50 DMA ... Single MA does not make a trend. This is the reason why scailing is so important. Scailing can make a difference.
2. Nothing is Perfect
- Same as any other study, nothing works 100% perfectly. Sometimes the setup will go right against you and sometimes the price will fade away sideways and breaks off the structure of the trend. This is not a magic certainty tool. This is just another probability tool.
3. Point of Validity & Other Studies
- Even though the pullback arrows can be a stand-alone strategy. It is important to use other indicators that visualize the actual trend. Whether its EMA Cloud or EMAs or DMI Bars or Keltner Channels, there should be something that validates the trend, something that tells the trend is over. (Pullback Arrows are not showing the actual stops!).
Hope it helps.
Trendtrading

Aarika Heikin AshiHello Traders,
This indicator is probably based for the people who use HA candlestick chart and frequently have to switch between Japanese candlestick and HA candles. The worry is over with this simple indicator.
Now you can enjoy both candlesticks at the same time.
AHA allows you to have 2 EMAs (mostly used for crossovers). Default values set at 8/21 EMA which we may indicate a trend reversal.
We strongly recommend you back-test everything that you need before you start using AHA.
Thank you.

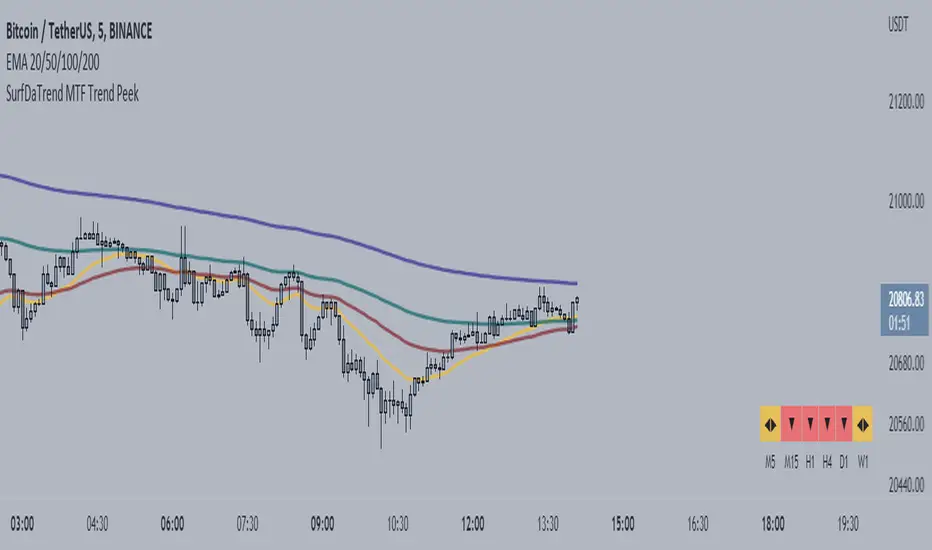
SurfDaTrend MTF Trend PeekThis script displays whether the EMA's align on Multiple-Timeframes. The user will set the EMA periods to use to determine the trend. This is useful for Multi-timeframe analysis and ensuring you are not trading against the HTF trend. This script also benefits users who use only a single screen as it is troublesome to switch to multiple timeframes to check EMA alignment.
***note: This is only useful for traders who trade on the lower timeframes. Not recommended for long-term traders.
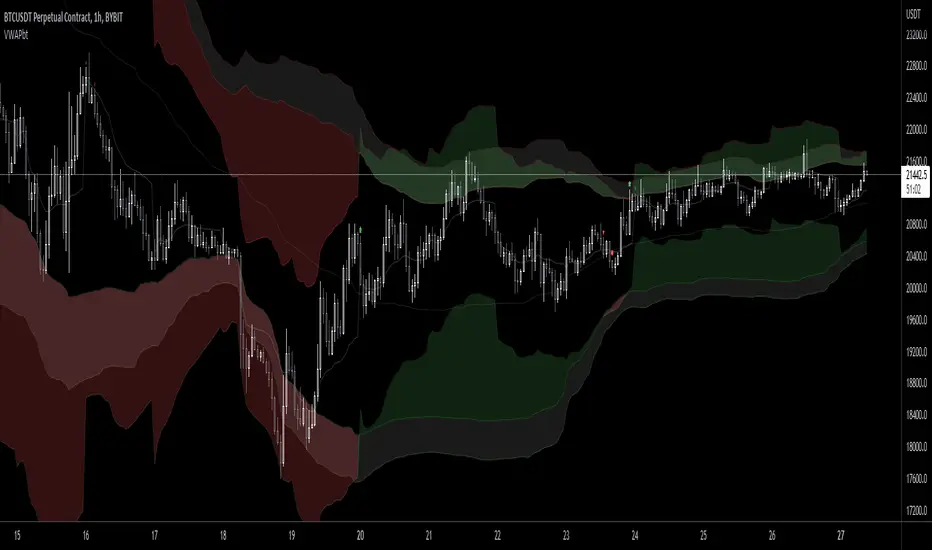
VWAP Band TrendThis indicator combines two features: VWAP bands for range trading and trends for trend-following.
The white bands offer support/resistance levels ideal for range trading: short when rejecting off the upper band, long when rejecting off the lower. Take profit either when hitting the (faint gray) midline and/or when hitting the band on the far side.
The trend analysis shows green or red ranges above or below the bands to indicate trend strength - larger swaths of green or red indicates strong trend while shorter swathes indicate weak. If the upper trend color doesn't match the lower trend color, the trend is undecided or transitioning.
Optionally, trend initiation indicators can be turned on to show above/below candles where a trend switch is taking place.
MOD RSI [KPM]Using this indicator you can easily view Divergence, and Market Tend in Mutitimeframe
NOTE: This is stranded RSI I only added colours for easy cath the market trend.
I'm not regarding anything with this indicator. All risk is yours
Thank you

Current Trend [KPM] - Buy / SellYou can filter the trend with this indicator. Green Lines indicate a short-term up trend and Red lines indicate a short-term downtrend. and black lines indicate short-term consultation.
I'm not regarding anything with this indicator. All risk is yours
Thank you
BoxToBox by GurkyCombination of the box theory by Nicolas Darvas and the turtle system.
If the price is above the box, it's long. If the price is below the box, it's short. And follow tags for exit. Simple game plan.
Darvas box theory is a technical tool that allows traders to target stocks with increasing trade volume.
The Darvas box theory is not locked into a specific time period, so the boxes are created by drawing a line along the recent highs and recent lows of the time period the trader is using.
The Darvas box is a trend following system. A trend following system is one that does not try to anticipate a market move. Another way of saying this is that the system is reactive versus predictive.
Darvas would only enter stocks that were in confirmed uptrends and breaking out of consolidation patterns to make new highs. His boxes helped him visualize this while he was on the road dancing for a living.
Essentially, if a stock on his watchlist was bouncing around inside a “price box” of say $35 and $40, then he knew if it broke to $40.50, it was time to buy.
Likewise, if the stock retreated back into the box, it hit his stop loss orders. He wanted to make sure the uptrend was confirmed with higher prices.

Tracert Trend[s3]Variable Moving Average(VMA) with a view of the trend based on the VMA on multiple timeframes. The Variable Moving Average (VMA) is a study that uses an Exponential Moving Average being able to automatically adjust its smoothing factor according to the market volatility . The timeframes of the indicator must be set to a higher timeframe than whatever timeframe your chart is set to to work properly. Example(default): Trading on the 15m timeframe so have the timeframes set to: 1) Chart 2) 30m 3) 45m 4) 60m
Green line of VMA = uptrend in price action
Red line of VMA = downtrend in price action
White line of VMA = indecision in price action
Green candles = uptrend and above VMA
Red candles = downtrend and below VMA
White candles = indecision or chop in price action
Green symbol below candle = all six timeframes are above the VMA
Red symbol above candle = all six timeframes are above the VMA
No symbol above or below candle = indecision amongst the six timeframes

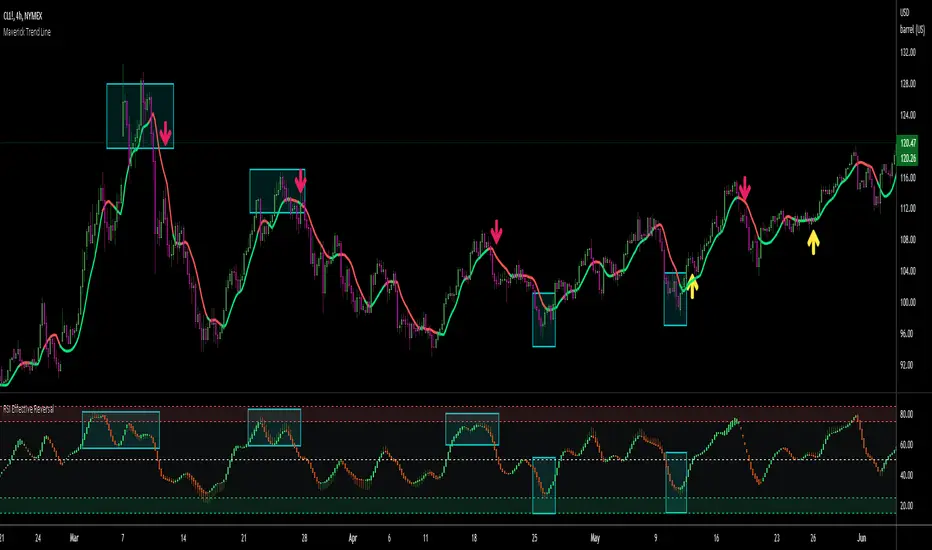
Maverick Trend LineBackstory of the Maverick Trend Line:
If you just want to know what the indicator does and how it works, you can skip this part and jump straight to the next section. However, I thought it would be useful to provide some background as to how I came up with this script, as it turned out to be quite different from what I originally planned it to be.
This is the second indicator, part of a trading strategy, which is constructed to work alongside " RSI Effective Reversal ". In some of the earlier (draft) versions, there were gazillion trend lines, so much so that they were obstructing what was the most important thing - price action. Gradually, I started reducing them, while incorporating other indicators like Directional Movement, RSI, Quantitative Qualitative Estimation (QQE) indicator, slope adaptive moving averages, etc.
Originally constructed as a strategy, when backtested, this indicator was profitable on the major assets I was trading - SPX500, Crude Oil, Copper, Natural Gas, BTC and ETH . I tested it on the 1h and 4h time frames (those that I trade in). I implemented fairly simple entry criteria - go long when RSI is oversold and price crosses up a certain trend line and go short when RSI is overbought and the price crosses down a certain trend line.
Now, why didn't I release this as a strategy? The results were good, but not nearly as good when trading experience and subjective decision-making were implemented. The script does not take into account trend lines that are easy to see with a naked eye, nor does it account for support and resistance levels. As such, a trader with some minor experience could make much more profit by implementing "the art of trading" as opposed to mechanically following entries and exits (at least with this script).
Maybe I didn't develop it well enough to be a comprehensive automatic strategy, but I've spent over 6 months testing different variations and it never outperformed manual trading with subjective entries, stop losses set at key levels (as opposed to trail stop-loss) and adding up to existing positions when the right opportunities come. So, let me just recap before we get to the important part of how the indicator works. Maverick Trend Line, when implemented with "RSI Effective Reversal" works like a charm when used manually (as guidance), and only merely outperforms a buy and hold strategy (based on a year-over-year basis on the backtesting engine).
What does the Maverick Trend Line do?
The now very trimmed version consists of two major elements - Price Base Line and Trend Base Line . The former is a Qualitative Quantitative Estimation (QQE) moving average with some smoothing modifications, while the latter is an adaptive moving average, again with some adjustments for smoother results. The parameters that you can tweak are:
lengths of the moving averages
QQE factor
smoothing factor
type of moving average, being used as a base for generating the base lines. You can choose between EMA, SMA, RMA, WMA and ALMA
Since Price Base Line follows the price closely and the Trend Base Line follows the overall trend, the Maverick Trend Line is a combination of both, following the price action closely, while still giving it some "room to breathe". You can switch between the two base lines or Maverick at any time.
How to use the Maverick Trend Line?
I am a huge fan of simplicity (which you may already know if you've checked some of my other indicators), so there's a minimum number of steps to follow before being able to use the indicator. By default it's switch to Maverick. I suggest unticking the box, tweaking the Price and Trend Base Lines according to the asset(s) you will trade (but do not attempt to perfectly fit it to the price) and once you are ready, switch back to Maverick. Alternatively, if you will find it useful, apply the indicator twice and have all the three lines at the same time. It's entirely up to you.
I would then suggest applying the RSI Effective Reversal Indicator and wait for overbought/sold situations. Once the price goes above or below the Maverick trend line after an oversold or overbought area, you can open a long/short order respectively. The added advantage of RSI Effective Reversal is that it's constructed of candles as opposed to a mere line. As such, it give you heads up when price is about revert, as the candles start turning from bullish to bearish.
Needless to say, no indicator or strategy is perfect, so I strongly suggest papertrading first until you get a grasp of the indicator, and as always - apply sound money management rules. Protect your capital, so that you can live to trade another day.
Questions and suggestions
I'm always open to suggestions as to how I can improve my indicators to serve you better, so if you have any ideas or questions about it, please feel free to drop them in the comment section below. Thank you for your interest and for checking my work. Good luck!
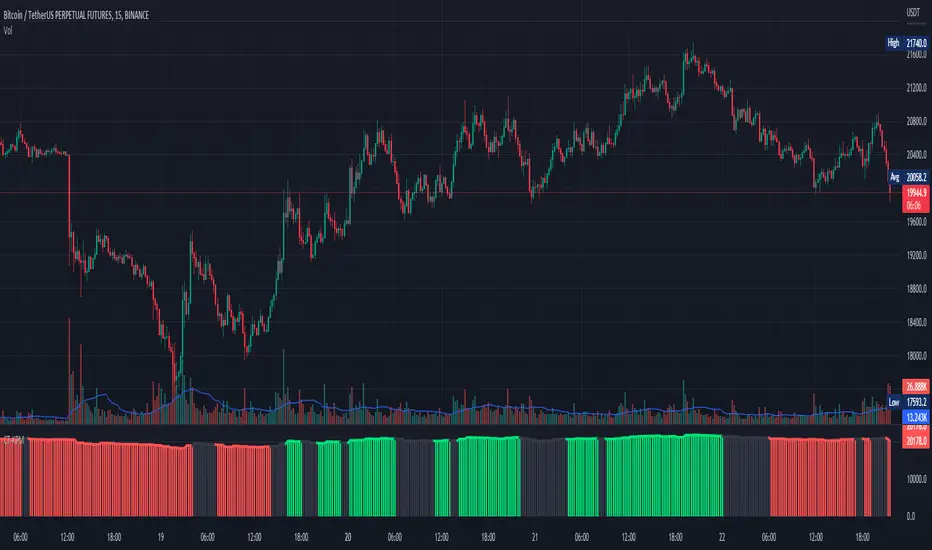
Delta Volume by SiddWolfDelta Volume is Difference between Buying Volume and Selling Volume. This indicator gives the Delta Volume based on Lower TimeFrame Candles. It utilizes security_lower_tf() function, a function that provides Lower TF candle data in Higher TF Chart.
security_lower_tf() is a new function provided by TradingView yesterday. If you are a PineScript Programmer, I suggest you to read about it, as it is a very powerful function that can extremely improve your trading strategy.
How this indicator works:
This indicator checks volume data on lower TimeFrame Candles and Shows it's delta in the current Chart Timeframe. For example: If you open 4 hours chart, this indicator checks volume of 1 minute chart and separates Buying-Selling volume. Then it subtracts Candle's Selling volume from Candle's Buying volume, finally calculating the Delta Volume.
This indicator also provides a Smooth Delta Volume, which is moving average of Delta Volume. As Delta Volume changes a lot, Smooth Delta Volume can be very helpful for identifying Trends . Goto settings and in "Show" section select "Smooth Delta Volume" to lay it on the chart.
Settings is the Key:
Settings are key to all of my indicators. Play around with it a bit. You can change what to show on the chart from settings. Smooth Delta Volume moving average length can be changed from the settings. You can also select "Show as Percentage", which shows Delta Volume as Percentage of Overall Candle's Volume. If you use Weekly or Monthly Timeframe, change increase lower timeframe from settings. Read the tooltips to understand what each settings mean. Tooltips are the (i) button in-front of each settings.
FAQs:
Q. Does the indicator Repaint ?
--- No. None of my indicators repaints. What you see now is what's drawn in real time.
Q. What TimeFrame is Best for this Indicator ?
--- It can be used on timeframes from 5 minutes to higher. But I would prefer to use it from timeframes higher than 30 minutes, as it gathers data from 1 minute TF.
Q. Indicator doesn't show anything ?
--- This indicator only works on security with Volume data. Also use it from higher timeframe than specified in Settings, because Volume Delta is calculated using Data from Lower TimeFrame.
Q. Delta volume is not provided by TradingView, So how exactly does this indicator work?
--- This indicator takes advantage of new pinescript function security_lower_tf(), and calculates volume for smaller timeframe data and calculates delta on higher timeframe.
Q. Does this indicator give financial advice?
--- No. Nope. Nein. Não. नहीं.
Conclusion:
This indicator is very basic but if used correctly it can be very powerful. If you have any questions or suggestions feel free to comment below. I'd love to connect with you. Thank you.
~ @SiddWolf

Multiple Trend Overview
-----------------
Hey there!
The indicator is used for both an overall and a short trend assessment. Both superordinate structures and subordinate movements are mapped. With the help of calculations via Ema , MACD and other tools, graphic trends can be visualized.
The green areas always signal an uptrend, while the red areas indicate a downtrend. The red & blue ema enclose the area of the minor trend. Orange & Green signal the overall trend. Ideally, both Ema faces run in the same direction as the multi-color line. Special alerts in the charts show this again directly in the chart. The multiple setting to display the trends from different time frames is innovative!
For all asset classes!
The indicator is designed for the m30 chart. But it can also be used well on other time frames. In addition, the display can be adjusted via the options and set to any time frame. The indicator has various settings and options that can be activated or deactivated separately.
Caution: Past results do not guarantee future profits!
Follow the link below to get access to this indicator or get us a PM to get access.
--------------------------------------------------------------------------------------------------------------
--------------------------------------------------------------------------------------------------------------
-----------------
Willkommen!
Der Indikator dient sowohl für eine übergeordnete als auch eine untergeordnete Trendeinschätzung. Hierbei werden sowohl übergeordnete Strukturen als auch untergeordnete Bewegungen abgebildet. Mit Hilfe von Berechnungen über Ema , MACD und weiteren Hilfsmittel lassen sich grafische Trends visualisieren.
Die grünen Flächen signalisieren immer einen Aufwärtstrend, während die roten Flächen einen Abwärtstrend anzeigen. Der rote & der blaue Ema schließen die Fläche des untergeordneten Trends ein. Orange & Grün signalisieren den übergeordneten Trend. Idealerweise laufen beide Ema Flächen in die gleiche Richtung wie die Multi-Farben Linie. Spezielle Alerts im Charts zeigen dies auch nochmal direkt im Chart. Innovativ ist die multiple Einstellung die Trends aus verschiedenen Timeframes abzubilden!
Für alle Asset Klassen!
Der Indikator ist für den m30 Chart ausgelegt. Lässt sich aber auch auf anderen Timeframes gut nutzen. Zusätzlich kann die Anzeige über die Optionen angepasst werden und auf jede Timeframe eingestellt werden. Der Indikator besitzt verschiedene Einstellungsmöglichkeiten und Zusätze die separat aktiviert oder deaktiviert werden können.
Achtung: Vergangene Ergebnisse garantieren keine zukünftigen Gewinne!
Verwenden Sie den folgenden Link, um Zugriff auf diesen Indikator zu erhalten oder schreibe uns eine PM um Zugriff zu erhalten.

Trend & Momentum V2Declutter your charts. Simple indicator combining trend and momentum using Moving Average (currently default to 9-day EMA) and RSI (default length of 8). A long signal is generated when the price closes above the moving average and the moving average color turns red to green which indicated that the momentum measured using RSI is greater than 50. A short signal is generated when the price closes below the moving average and the moving average color turns green to red indicating RSI is below 50. Confirmation is done if there is no reversal on the next candle. For best results use multiple timeframe charts to trade on the right side of trend and momentum.

Trend Indicator (dow trending) - FontiramisuIndicator showing pivots and interpret a trend out of it.
Pivots are calculating with deviation parameter to validate with more precision.
Trending moves are calculated according to Dow Theory :
In an uptrend, if the price made a new high, the price must make a new high to confirm the trend, otherwise, it might signal a possible change in the trend.
In an uptrend, if the price made a new low, the price must make a new low to confirm the trend, otherwise, it might signal a possible change in the trend.
The indicator can show 2 trends with 2 different "Pivot Depth"
See indicator parameters.
Tab is display at the bottom right corner to show trend direction and if it is hesitating
Fontilab Library is used to code this indicator

Multiple MAs + No Trend Zone + ATR WidgetThis is my first Pine Script attempt. Nothing special, just an "all in one" for the most common things I use, and what I have found to be the most common in a lot of strategies.
Great for free and limited accounts as it combines 7 total indicators into one.
-- First 5 indicators are Independant Moving Averages:
-Each one can be set for length, as well as source and type (SMA, EMA, SMMA, WMA, VWMA) individually
-- Second type (6th) of indicator is one I find extremly useful for staying OUT of consolidation trading. It's called a "No Trend Zone" indicator I swipped from the Hoffman Startegy. Basically, its set for a small deviation (0.5) of a 35 EMA, which creates a "Band" around the 35 line. When you have this "Band" flat or with no discernable incline/decline, with price action OR some or multiple moving averages inside this banded zone, it typically indicates a zone of consolidation. This will help you identify when you may be in one of those zones, that way you don't get trapped "waiting for paint to dry" before the market starts to move again with your position, and keep you from entering should you be considering the market at that time.
The last indicator is my favorite, and one I will refine a little deeper soon.
-- The ATR widget finishes us out. This widget can be customized for colors, turned on or off, and automatically rounds the ATR (ATR period based on the chart timeframe) to a nice readable number for what you're trading. It has settings to show or not, the length, what rounding style to use (forex pip 0.0001, forex/stock/etf/indicies 0.01) where to show it on the pane, a Multiplier Factor (for stop loss calculations automatically) and the colors.
***NOTE ABOUT ATR WIDGET:
I am primarily a forex trader, so the defaults are for Forex 0.0001. If you see some odd numbers (like 55798 on a current chart), check the inputs tab on the settings, and change the "ATR Style" from "Forex 0.0001" to "Forex/Stock/ETF/Indicies 0.01", and you should arrive with the correct number.

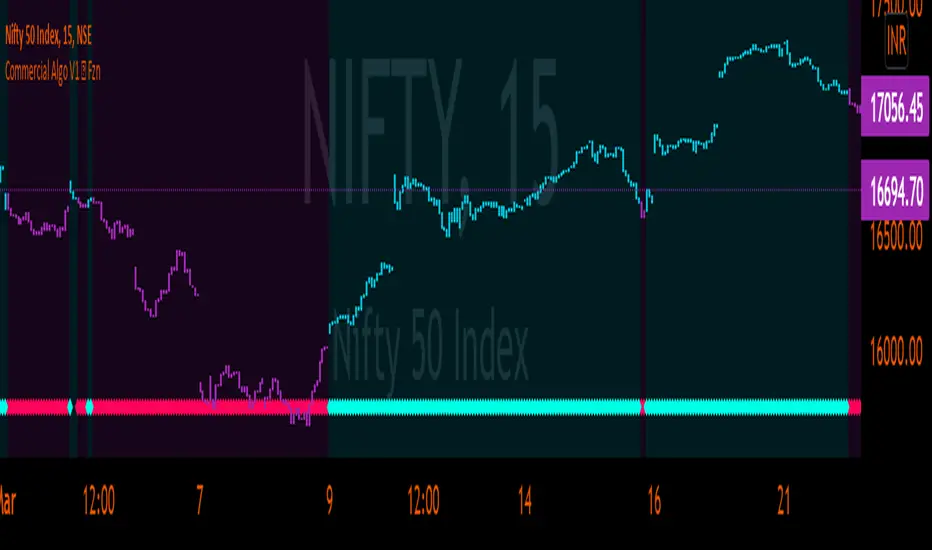
Commercial Algo Trend © Fzn V1Hello Traders,
Here i bring to you my 2nd Price Action Atr based Indictor combined with fib entry and exit trailing levels with minimum risk and maximum profit , as we must have seen at times as we enter the trend reverse and hits our stop losses . Keeping that in mind as i too struggled and made losses so i decided and focused more on minimizing the stop loss and only on confirmation of Long or Short trade is been initiated with proper Stop loss as explained in the images below , why should we give market our money ;) as we are here to make money :D .. There is no holy grail as Stop loss wont be hit but yes it will be way less and all alerts are based on candle close . One can use this on any chart and any timeframe and its very good for scalping too .ATR Trailing SL is added too just incase you want to enter and exit trend manually . Better results are on 15m and above . Hope you guys will like it and comment if you have any doubts..
-----------------
Disclaimer
Copyright by FaizanNawazz.
The information contained in my scripts/indicators/strategies/ideas does not constitute financial advice or a solicitation to buy or sell any securities of any type. I will not accept liability for any loss or damage, including without limitation any loss of profit, which may arise directly or indirectly from the use of or reliance on such information.
All investments involve risk, and the past performance of a security, industry, sector, market, financial product, trading strategy, or individual’s trading does not guarantee future results or returns. Investors are fully responsible for any investment decisions they make. Such decisions should be based solely on an evaluation of their financial circumstances, investment objectives, risk tolerance, and liquidity needs.
My scripts/indicators are only for educational purposes!
Happy Trading!
[Fedra Algotrading Super Duper Trend Filter]All-in-one trend filter
Trend-following strategies are relatively easy to achieve, especially in backtesting. If only we knew what trend we were in! Let me help you:
- MAs crossovers
- Selection of the type of MAs
- Selection of MAs periods
-Super trend (optional)
-Trend zones based on trend lines (optional)
- Secret sauce
How to use it?
Do not open Longs if it is red
Don't open Shorts if it's green.
Apply it to your strategies and check the impact of a reliable trend filter before opening your entries.

ZigZag Channel with projection forecastThis indicator is created on top of existing Zigzag indicator .
The projection channel starts at the end of the last ZigZag line.
Disclaimer
Success in trading is all about following your trading strategy and indicators should fit into your own strategy, and not be traded purely on.
This script is for informational and educational purposes only. Use of the script does not constitute professional and / or financial advice. You are solely responsible for evaluating the outcome of the script and the risks associated with using the script. In exchange for the use of the script, you agree not to hold monpotejulien TradingView user responsible for any possible claims for damages arising out of any decisions you make based on the use of the script.

Trending Bollinger Bands by SiddWolfBollinger Bands are mostly used for trend reversal. I believe they should be used for Trend Continuation and Trend Confirmation.
In this Trending Bollinger Bands script you will see two bands drawn on chart. The Upper band is suggestive of Uptrend and Lower Band is suggestive of Downtrend Market. It just provides the guidance of where the market is now and where it is headed. It is not to be used as a standalone indicator. Use this to confirm your hypothesis of Uptrend or Downtrend.
Bollinger Bands Trend
When the price crosses the moving average it is interpreted as the price is gonna continue in that direction. But most of the time it is a fake breakout. With this script you get an additional confirmation so that you know it is not a fake breakout and the price have caught the trend.
Bollinger Bands Reversal:
This indicator can also work for reversal. For example when price closes outside the outer bands, it is most likely that the trend is gonna reverse. Don't just enter the trade wait for some other confirmation as reversal trading is more complicated.
Confluence:
Confluence is the key factor for profitable trading. Don't use this indicator as standalone indicator instead combine it with other indicators and price action. Like the divergence occurring when the price is outside the bands is suggestive of trend reversal. I have created a non-delay, non-repaint indicator for finding divergence. I'd soon publish that script. Stay tuned.
Settings is the Key:
Try to play around with the settings. It is a simple yet effective indicator. Change the moving average type or length. I've found moving average RMA or WMA works better than SMA. Find the best setting that works with your setup. Set the Band Source as High/Low to make the outer bands more extreme.
Conclusion:
This is my first script but it isn't my last. I've created quite a few gems that I'm gonna publish soon. If you have any questions or suggestions feel free to comment below. I'd love to connect with you. Thank you.

#JJ Trend
-----------------
Hey there!
The indicator is used for a rough trend assessment. Both superordinate structures and subordinate movements are mapped here. With the help of a calculation via Ema and MACD , different timeframes can be displayed in the same chart. This makes the multi-timeframe analysis extremely easy.
On all Asset classes!
The indicator is for the m5 / m15 chart. In addition, the display can be adapted using the options and set to any timeframe.
Caution: Past results do not guarantee future profits!
Follow the link below to get access to this indicator or get us a PM to get access.
--------------------------------------------------------------------------------------------------------------
--------------------------------------------------------------------------------------------------------------
-----------------
Willkommen!
Der Indikator dient für eine grobe Trendeinschätzung. Hierbei werden sowohl übergeordnete Strukturen als auch untergeordnete Bewegungen abgebildet. Mit Hilfe einer Berechnung über Ema und MACD lassen sich verschiedene Timeframes im gleichen Chart abbilden. Das erleichtert die Multi Timeframe Analyse extrem.
Für alle Asset Klassen!
Der Indikator ist für den m5 / m15 Chart ausgelegt. Zusätzlich kann die Anzeige über die Optionen angepasst werden und auf jede Timeframe eingestellt werden.
Achtung: Vergangene Ergebnisse garantieren keine zukünftigen Gewinne!
Verwenden Sie den folgenden Link, um Zugriff auf diesen Indikator zu erhalten oder schreibe uns eine PM um Zugriff zu erhalten.

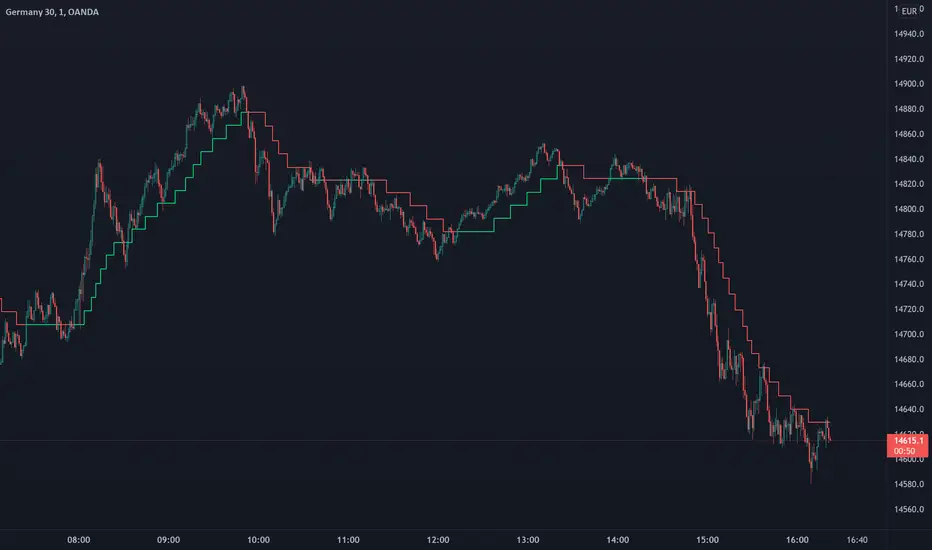
Trend Step - TrailingTrend Step - Trailing Stop is a moving average-based trailing stop that moves in pre-defined steps. In this way, the user can set the number of pips/points they want the trailing to move in relation to the movements in the average. You can also see it as trend steps. Every step represents the trend movement.
Usage
Use it as a trailing stop or as a trend direction tool.
Disclaimer: No financial advice, only for educational/entertainment purposes.
[UPRIGHT] Awesome DMI+Hello Traders,
Today I'm releasing a spin on an 'oldie but goodie'; the Directional Movement Index (DMI).
DMI is a combination of 3 different indicators developed by the famous J. Welles Wilder. DMI has 3 different plots: the ADX, +DI, and -DI. The first is the ADX (Average Directional Index), which Wilder created in 1978 to show the strength of a trend by comparing the current price with the previous price range. The other two are the +DI (positive directional indicator) and the -DI show up as two separate lines, +DI is the difference between the highest price of the current day and the highest price of the day before, and -DI does the same calculation with the current and previous day's lows.
How does it work?
When the ADX line is above 25 (as a general rule, some traders use a different threshold, +/- 5), the trend is strong. When the +DI line is above the -DI line, the asset (stock) is moving in an uptrend, and the opposite means the asset is in a downtrend.
How is this different?
Uses multiple calculations to produce signals for an indicator than normally doesn't have any.
Multiple ADX's, +DI's, and -DI's for better accuracy and clearer direction changes.
Ability to use 2 different background highlight signals and several buy/sell signals.
Fully customizable (as always), ability to turn on or off any signals, change any of the colors to suit your needs.
Added pre-filled Alerts.
The ribbons created by the fill make it easier to see the change in direction of each plot.
The chart should look like:
Cheers,
Mike
(UPRIGHT TRADING)

Trading Made Easy Pressure OscillatorAs always, this is not financial advice and use at your own risk. Trading is risky and can cost you significant sums of money if you are not careful. Make sure you always have a proper entry and exit plan that includes defining your risk before you enter a trade.
Those who have looked at my other indicators know that I am a big fan of Dr. Alexander Elder and John Carter. This is relevant to my trading style and to this indicator in general. While I understand it goes against TradingView rules generally to display other indicators while describing a new one, I need the Bollinger Bands, Bollinger Bands Width, and a secondary directional indicator to explain the full power of this indicator. In short, if this is strongly against the rules, I will edit the post as needed.
Those of you who are aware of John Carter are going to know this already, but for those who don’t, an explanation is necessary. John Carter is a relatively famous retail-turned-institutional (sort of) trader. He is the founder of TradetheMarkets, that later turned into SimplerTrading. Him and his company have a series of YouTube videos, he has made appearances on the MoneyShow, TastyTrade, and has authored a couple of books about trading. However, he is probably most famous for his “Squeeze” indicator that was originally launched on Thinkorswim and through his website but has now been incorporated into several trading platforms and even has a few open-source versions available here. In short, the Squeeze indicator looks to identify periods of consolidation and marry that with a momentum oscillator so you can position yourself in a quiet period before a large move. This in my opinion, is one of the best indicators an option trader can have, since options are priced both on time and volatility. To do this, the Squeeze identifies when the Bollinger Bands, a measure of price standard deviation, have contracted inside the Keltner Channels (a measure of the average range of a stock). This highlights something known as “the Squeeze”, when the 2x standard deviations (95% of all likely price movement using data from the past 20 periods) is less than the 1.5x average true range (ATR) of the stock over the same number of periods. These periods are when a stock is resting and in a period of consolidation and is generally followed by another large move once it has rested long enough. The momentum oscillator is used to determine the direction of this next move.
While I think this is one of the best indicators ever made, it is not without its pitfalls. I find that the “Squeeze” periods sometimes take too long to setup (something that was addressed by John and released in a new indicator, the Squeeze Pro, but even that is still slowish) and that the momentum oscillator was also a bit slow. They used a linear regression formula to track momentum, which can lag considerably at times. Collectively, this meant that getting into moves a few candles late was not uncommon or someone solely trading squeeze setups could have missed very good trade opportunities.
To improve on this, I present, the Trading Made Easy Pressure Oscillator. This more accurately identifies when volatility is reducing and the trading range is likely to contract, increasing the “pressure” on the price. This is often marked several candles before a “Squeeze” has started. To identify these ranges, I applied a 21-period exponential moving average to the Bollinger Bands Width indicator (BBW). As mentioned above, the Bollinger Bands measure the 2x standard deviation of price, typically based on a 20-period SMA. When the BBs expand, it marks periods of high volatility, when they contract, conversely, periods of low volatility. Therefore, applying an EMA to the BBW indicator allows us to confidently mark when volatility has slowed down earlier than traditional methods. The second improvement I made was using the Absolute Price oscillator instead of a linear regression-style oscillator. The APO is very similar to a MACD, it measures the difference between two exponential moving averages, here the 8 and 21 (Fibonacci EMAs). However, I find the APO to be smoother than the MACD, yet more reactive than the linear regression-style oscillators to get you into moves earlier.
Uses:
1) Buying before a bigger than expected move. This is especially relevant for options traders since theta decay will often eat away much of our profits while we wait for a large enough price move to offset the time decay. Here, we buy a call option/shares when the momentum oscillator matches the longer-term trend (i.e. the APO crosses over the zero line when price is above the 200-day EMA, and vice versa for puts/shorting the stock). This coincides with Dr. Elder’s Triple Screen Trading System, that we are aligning ourselves with the path of least resistance. We want to do this when price is currently in an increasing pressure situation (i.e. volatility is contracting) to make sure we are buying an option when premium and Implied Volatility is low so we can get a better price and have a better risk to reward ratio. Low volatility is denoted by a purple dot, high volatility a blue dot along the midline of the indicator. A scalper or short-term swing trader may look to exit when the blue dots turn purple signalling a likely end to a move. A longer-term trend trader can look to other exit scenarios, such as a cross of the oscillator below the zero line, signalling to go short, or using a moving average as a trailing stop.
2) Sell premium after a larger than expected move has finished. After a larger than expected move has completed (a series of blue dots is followed by a purple dot), use this time to sell theta-driven options strategies such as straddles, strangles, iron condors, calendar spreads, or iron butterflies, anything that benefits from contracting volatility and stagnating prices. This is useful here since reducing volatility typically means a contraction of prices and the reduced likelihood of a move outside of the normal range.
3) Divergences. This indicator is sensitive enough to highlight divergences. I personally don’t use it as such as I prefer to trend trade vs. reversion trade. Use at your own risk, but they are there.
In summary, this indicator improves upon the famous Squeeze indicator by increasing the speed at which periods of consolidation are marked and trend identification. I hope you enjoy it.

Stock Rotation Model [CC]This is an original indicator so a true hidden gem in my opinion. I based this idea off of the work by Giorgos Siligardos (Stocks and Commodities Aug 2012) with his indicator called the Sector Rotation Model. This indicator is best used as a trend confirmation in combination with another indicator such as a leading indicator. This will show you how strong the current stock you are looking at is compared to the S&P 500 which almost everyone uses as a relative strength comparison. Feel free to change the default lengths if you would like as these were just the settings that I liked the best overall. Let me know if you find any good combos that works for most stocks in general. I have included strong buy and sell signals in addition to normal ones so strong signals are darker in color and normal signals are lighter in color. Buy when the line turns green and sell when it turns red.
Let me know if there are any other indicators or scripts you would like to see me publish!
