Tradespot Quant - Strategy & AlertsTradespot - Quant is an extensive trading algorithm, signal generator and technicals screener packed into one beautifully designed, functional indicator. The script is very customisable to not limit the trader using it but does have some very respectable default settings for BTCUSD on the 4H and 15M charts that we run in an automated fashion here a Tradespot round the clock on Binance Futures.
What does Tradespot Quant do?
Trade following signals generated via our bespoke algorithm
Full customisation to allow a deeper use of the indicator across different assets
Full risk management with take profit and stop loss levels (configurable) built in
Presets for BTCUSD & ETHUSD on the 4H/15M timeframes avaliable instantly for your use.
Innovative trade panel that illustrates key information such as what trade the algorithm is looking for next
More features being added all the time, we have great ideas and our only limitation is how fast we can program it!
Cornix compatible alerts - with the easiest of configurations you can automate this execution of this strategy.
Do you do a free trial?
Yes! Get in touch for a complimentary 48 hour free trial to the indicator, no strings attached.
Who are you?
Tradespot has been creating scripts for years on TradingView that we use to leverage our social trading and signal group offerings. We currently have over $200K in assets trading with our strategies across over 300 users.
You can learn more about us on our website. Please reach out to me or see the link on our profile.
Trendtrading
Trend Following IndicatorTrend Following Indicator is for following trend and being in trend till trend is not changed.
Each Bullish and Bearish signal you can add one more future or option lot and be in trade till bearish signal is not coming.
You can close Long trade i.e. Bullish pyramiding trade when you see there is small red arrows are there
and similarly when you are in Short trade you can pyramid with each Bearish signal and you can close the trade when small green arrow start coming.
Pros: This signal system is working in stocks and Index and Commodity and Currency.
Cons: Choppy market results are not good on that time you have to believe on small arrows for signals.
This signal is available on subscription. contact me or ping me for more details.

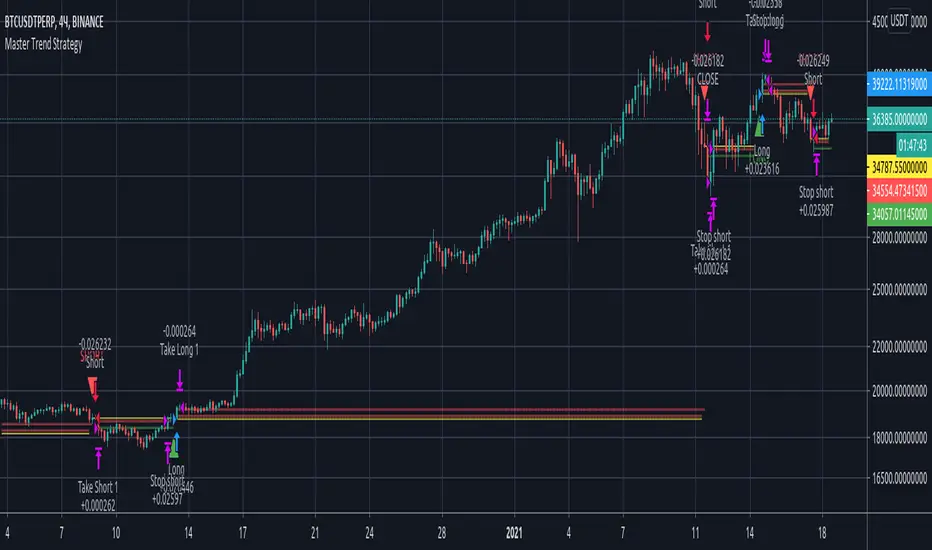
Master Trend StrategyStrategy for the Master Trend indicator. The screen shows a strategy with a deposit of 100 USD. By default, the strategy is STOP TREND. You can setup the strategy to MAIN TREND, if check off "Use stop" and "Use take 1 amount". Default strategy set stop by market when price reached first take and close by revert signal. MAIN TREND strategy trade from signal to signal use deep first take. Adjusting the settings you can create you own strategy.
This strategy has slippage equal 20 and commission 0.02% like on most of exchanges.
Can I get access?
Use the link below to obtain access to this indicator.
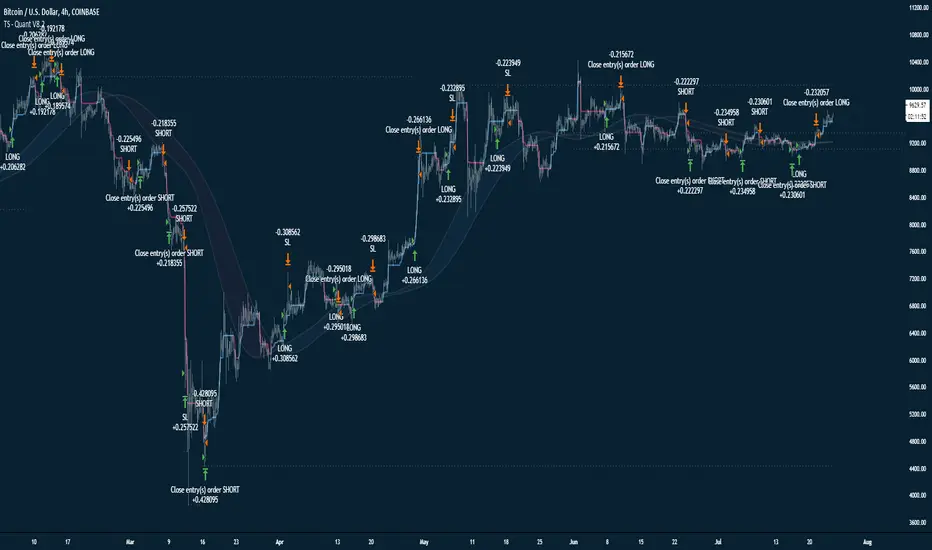
TS - Trading Algorithm Strategy - Crypto, Forex & StocksWhat does the TS - Algorithm do?
-- Plots trend following, high probability signals.
-- These signals do not repaint and can be used confidently to enter or exit a trade.
What markets can this indicator be used on?
-- Forex
-- Stocks
-- Commodities
-- Cryptocurrencies
What time-frames can this indicator be used on?
-- This indicator can be used on 1m, 3m , 5m, 10m, 15m, 30m, 1hr, 2hr, 3hr, 4hr, 6hr, 8hr, 12hr, Daily, Weekly, Bi-Weekly and Monthly time-frames.
-- This is a trend following algorithm, so low as there is good volume , volatility and price history of an asset, the model can perform.
Does this indicator repaint?
-- No
Premium Tradespot Script - Trial access and Information
-- Trial access offered
-- PM me directly to request trial access to the scripts or for more information.

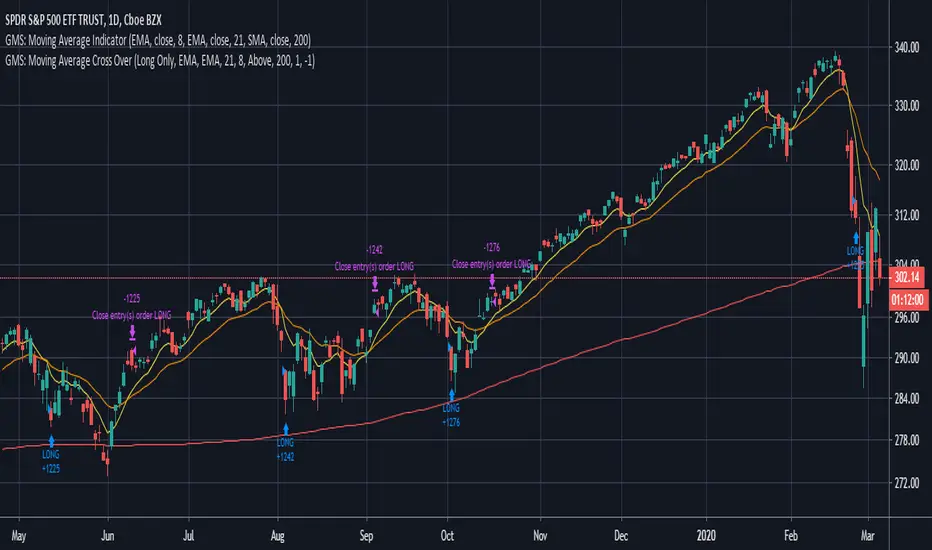
GMS: Moving Average Crossover StrategyThis is a moving average crossover system built the way I would want it to be.
- The moving averages included are SMA, EMA, WMA, VWMA.
- You can select either for the first moving average or the second moving average.
- You can also select to see the Long trades, Short trades, or both at the same time.
- There is also a simple moving average trend filter. When this is selected, it only applies to the entries of a trade and not the exit. There are situations where the entry is above the trend filter and the exit is below.
The source code should be open so feel free to adapt it, make it more efficient, or take some part for your own project!
I hope it helps,
Andre
GMS: RSI & ROC StrategyThis is a basic strategy like the RSI one I posted. This one adds in the Rate of Change indicator as well.
You can separate the two for RSI only and ROC only. Everything else is the same as the RSI strategy.
- Simple moving average trend filter.
- Simple moving average trade exit.
- Both long and short or each on it's own.
The source code should be open if you want to see it or modify it for your own project. I hope it helps!
Andre
Global Market Signals

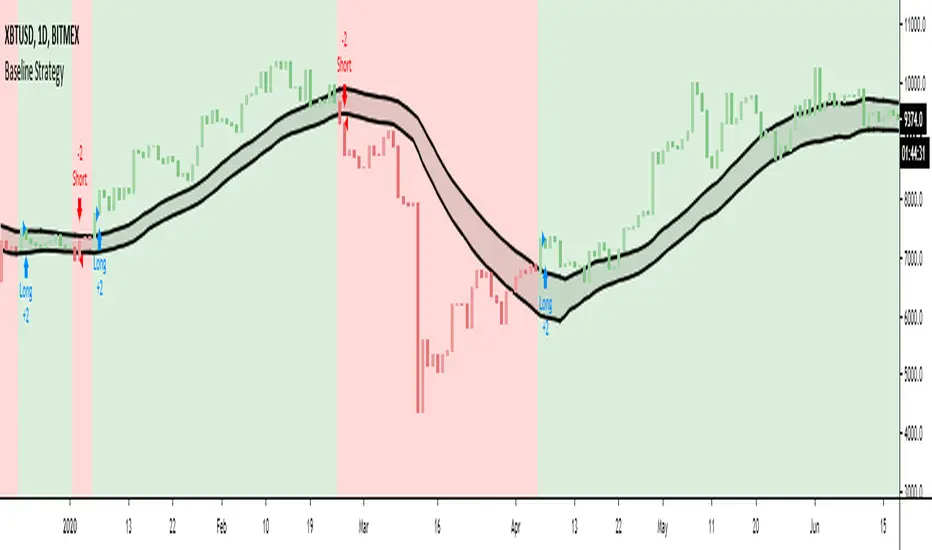
[astropark] Trend Is Your Friend V3 [strategy]Dear Followers,
today another awesome Swing and Scalping Trading Strategy indicator, runnable on a bot , which works great on High Timeframes (1D is suggested) but also on lower ones (just write me in order to help you find correct settings) and even better on 1m Renko chart!
If you are a scalper, you will love suggested entries for fast profit. You can run it on 1h timeframe (below is not suggested, there is "no-trend" below 1h!) if you are used to scalp trading and close each trade whenever you feel happy (a proper trailing stop strategy is suggested anyway).
This is not an evolution of "Trend Is Your Friend V1" or V2 , but a twin sister or the "Trend Is Your Friend V1" indicator you can see here below
and twin sister or the "Trend Is Your Friend V2" indicator you can see here below
This strategy differs for the engine used as basis, but has the same usage settings:
enable/disable signals on chart
enable/disable showing trend cloud
enable/disable bar coloring based on trend
enable/disable background coloring based on trend
edit trend period length (direct message me in order to help you fine best settings)
edit a smart variant option to enhance the trend cloud on your chart
enable/disable an option to smart enter trade
This strategy only trigger 1 buy or 1 sell. In order to get notified when a signal is triggered, you need to use the "alarms" version of this indicator.
Strategy results are calculated on the timeframe from December 2012 to now, so on 8 years, using 10000$ as initial capital and working at 1x leverage (so no leverage at all! If you like to use leverage, be sure to use a safe option, like 3x or 5x at most in order to have liquidation price very far).
This is not the "Holy Grail", so use a proper risk management strategy.
This script will let you backtest how the indicator will perform on any chart you may test. Of course results will be very different depending on the chart and timeframe you will open. I tested a lot of charts and always you can find a combination that keep this strategy in profit on swing trading style (and this means that if you can have a daily look at the chart you can always manage to maximize your profit on each trade!)
The alarms version of this indicator, which will let you set all notifications you may need in order to be alerted on each triggered signals, can be found by searching for the astropark's "trend is your friend v3" and then choosing the indicator with "alarms" suffix in the name.
This is a premium indicator , so send me a private message in order to get access to this script.

[astropark] Trend Is Your Friend V1 [strategy]Dear Followers,
today another awesome Swing and Scalping Trading Strategy indicator, runnable on a bot , which works great on High Timeframes (1D is suggested) but also on lower ones (just write me in order to help you find correct settings) and even better on 1m Renko chart!
If you are a scalper, you will love suggested entries for fast profit. You can run it on 1h timeframe (below is not suggested, there is "no-trend" below 1h!) if you are used to scalp trading and close each trade whenever you feel happy (a proper trailing stop strategy is suggested anyway).
This strategy let's you edit following settings:
enable/disable signals on chart
enable/disable showing trend cloud
enable/disable bar coloring based on trend
enable/disable background coloring based on trend
enable a special option to enhance trend cloud on FOREX/Stocks charts (optional)
edit trend period length (you have to increase it if you go on lower timeframes, like 1h)
This strategy only trigger 1 buy or 1 sell. In order to get notified when a signal is triggered, you need to use the "alarms" version of this indicator.
Strategy results are calculated on the timeframe from August 2017 to now, so on almost 2 years and half, using 10000$ as initial capital and working at 1x leverage (so no leverage at all! If you like to use leverage, be sure to use a safe option, like 3x or 5x at most in order to have liquidation price very far).
This is not the "Holy Grail", so use a proper risk management strategy.
This script will let you backtest how the indicator will perform on any chart you may test. Of course results will be very different depending on the chart and timeframe you will open. I tested a lot of charts and always you can find a combination that keep this strategy in profit on swing trading style (and this means that if you can have a daily look at the chart you can always manage to maximize your profit on each trade!)
The alarms version of this indicator, which will let you set all notifications you may need in order to be alerted on each triggered signals, can be found by searching for the astropark's "trend is your friend" and then choosing the indicator with "alarms" suffix in the name.
This is a premium indicator , so send me a private message in order to get access to this script.

Trend Following or Mean RevertingThe strategy checks nature of the instruments. It Buys if the close is greater than yesterday's high, reverse the position if the close is lower than yesterday's low and repeat the process.
1. If it is trend following then the equity curve will be in uptrend
2. If it is mean reverting then the equity curve will be downtrend
Thanks to Rayner Teo.

Pivot Reversal Strategy - FIGS & DATES 2.0Simple Pivot Reversal Strategy with some adding settings.
Date Range: To test over specific market conditions.
Initial Capitol: $10K - This is a more realistic representation of funds used this strategy (for me anyway). The default of $100K can give different results (usually better) than when using a smaller balance.
Order Size: 100% Equity - These trend following strategies typically used this way, going all in each direction.
Commission: .075% - It's always disheartening to think you've found a ridiculously good setting, and then realize you forgot to add the commission.
All of these settings can be changed, but it's easier for me (and more fool proof) to have them set as default.

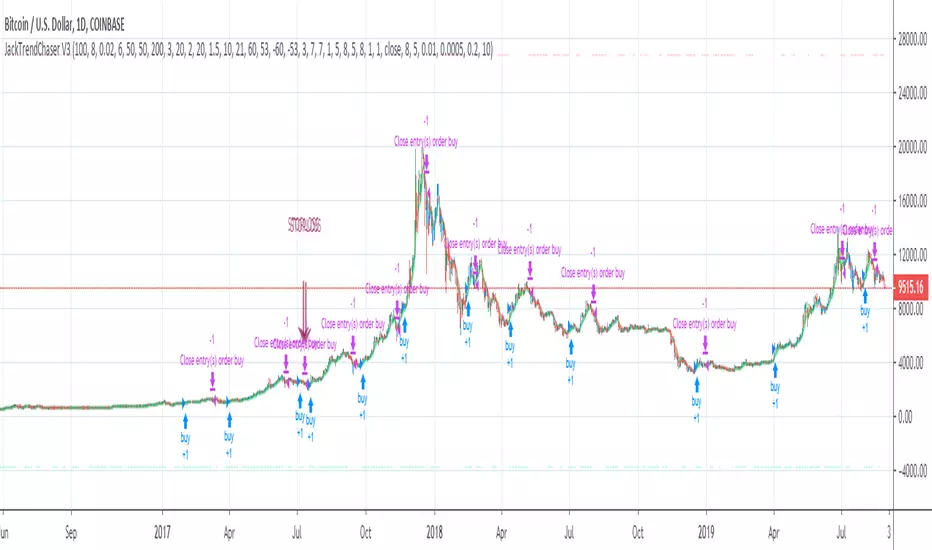
JackTrendChaser V4This is like V3 but with minor improvements - and this script is only protected which means that you are free to try it out!
I would love to know your thoughts on this so please try it out and get back to me :)
Link to V3:
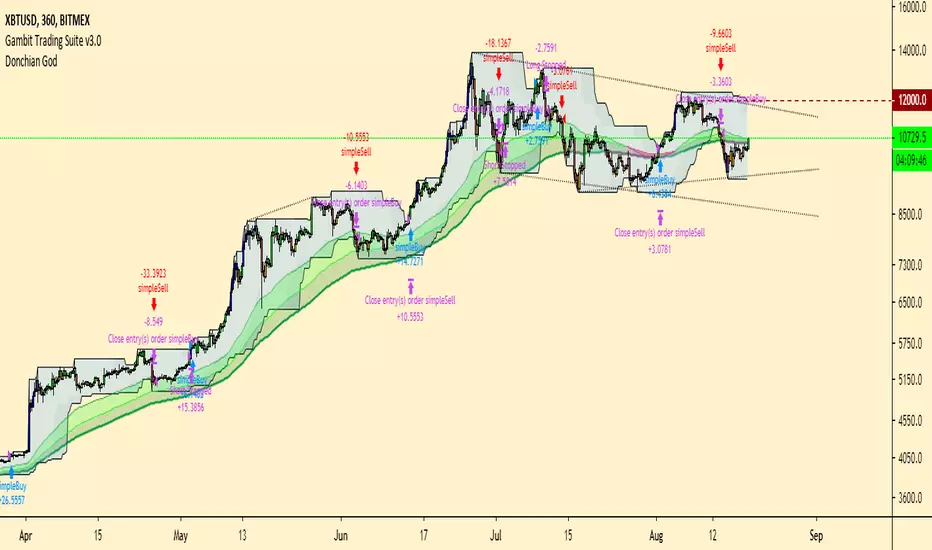
Donchian GodMy take on the turtle method. Included is the ultimate trend trader toolkit. Built in system that takes trades when price breaks either donchian channel and keeps that trade until price breaks the opposite channel. As well as many other tools!
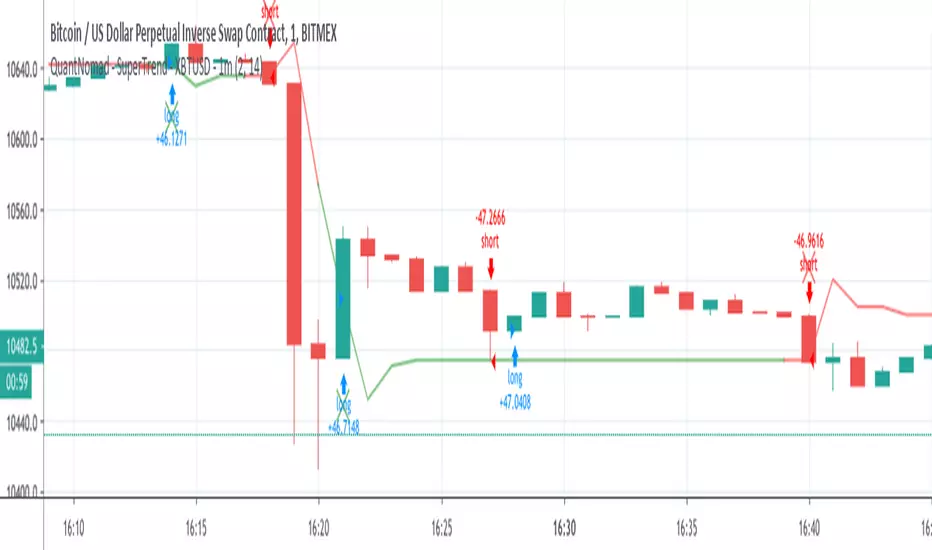
QuantNomad - SuperTrend - XBTUSD - 1mInteresting performance for Super Trend strategy for XBTUSD 1m chart.
Params: ST Mult: 2, ST Period 14.
Performance: 144% profit, 1988 trades, only 41% prof, 2.04% dd , 2.51 Sharpe.
On its own, it might be not a very good strategy, but the big amount of trades allows you to add more filters and improve it.
And remember:
Past performance does not guarantee future results.
QuantNomad - SuperTrend - TSLA - 1mInteresting performance for Super Trend strategy for Tesla ( TSLA ) 1m chart.
Params: ST Mult: 3, ST Period 120.
Performance:61% profit, 637 trades, only 33% prof, 4.84% dd , 0.4 Sharpe.
On its own, it might be not a very good strategy, but the big amount of trades allows you to add more filters and improve it.
The strategy is not bad both with "when" params when strategy executed on open of next bar and with stop orders when strategy enters on exact Super Trend level.
You can comment/uncomment lines in the code and switch from one approach to another.
And remember:
Past performance does not guarantee future results.

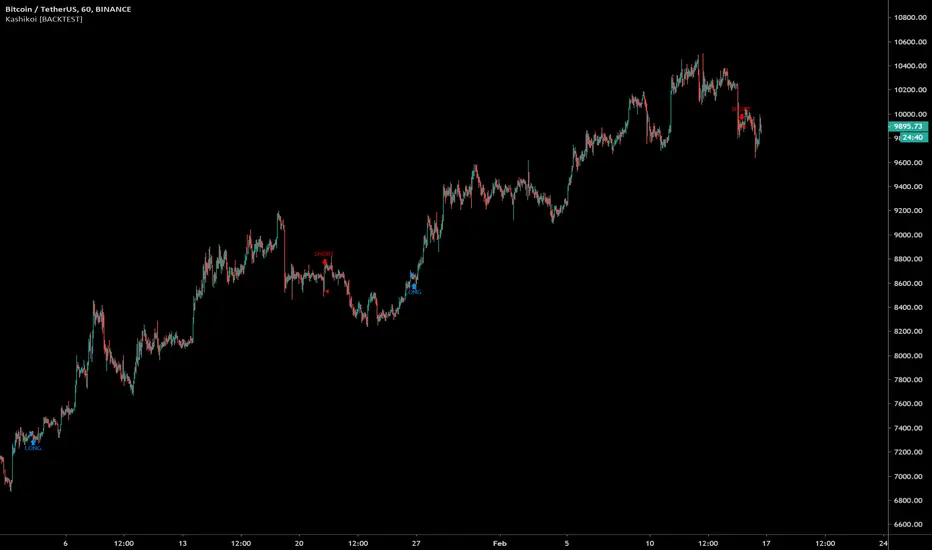
Kashikoi [BACKTEST]🔰 Kashikoi Anaraiza BACKTEST
📌This indicator is a tool to backtest the Kashikoi Anaraiza indicator which has the alerts. To see which custom strategies, indicators, settings, TP/SL performed in backtest.
📌Can test any combination of indicators and settings
🔹Trend Analyzer - Trend Reversals
🔹RyuKumo - BULL / BEAR
🔹EMAs / MAs
🔹Ichimoku - Breakouts / TK Crosses
🔹Breakouts S/R
🔹Pullbacks
🔹MACD
🔹RSI
🔹Stoch RSI
🔹Custom TP/SL %
🔹Trailing Stoploss
🔹Will add more features in future updates and as requested
📌Note: This is a tool to test various settings, to find optimal timeframes, TP/SL %, strategy parameters and testing. Which can save time from tediously manually testing. Past performance is not indicative of future results.
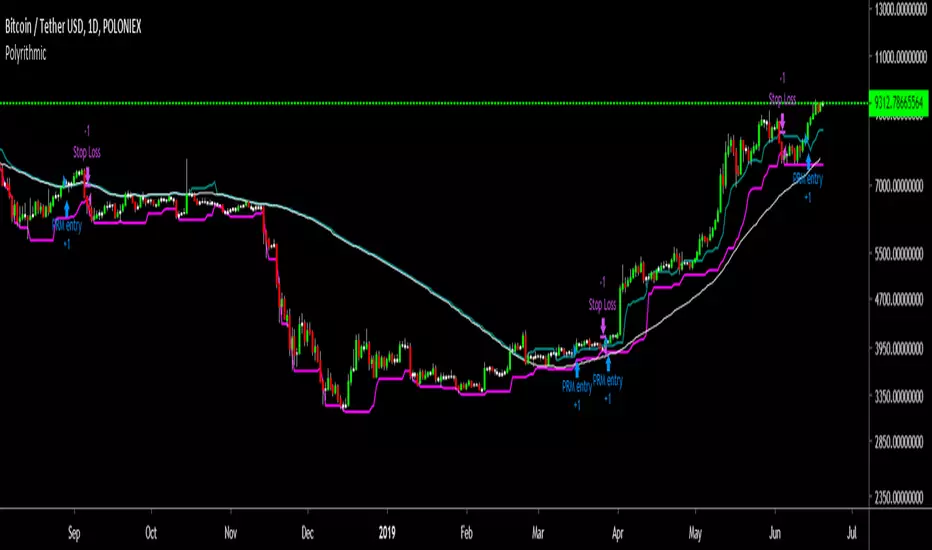
Polyrithmic Trend 2This script is designed to work on cryptocurrency.
This idea is to capture large amounts of the trend but to be able to get out when the support begins to break.
To use this script:
Buy signal:
- When the price is above the white moving average
- When the price goes over the buy line (higher / blue)
- When trading view says buy
Sell signal
- Move a stop up with the pink line and wait to be stopped out

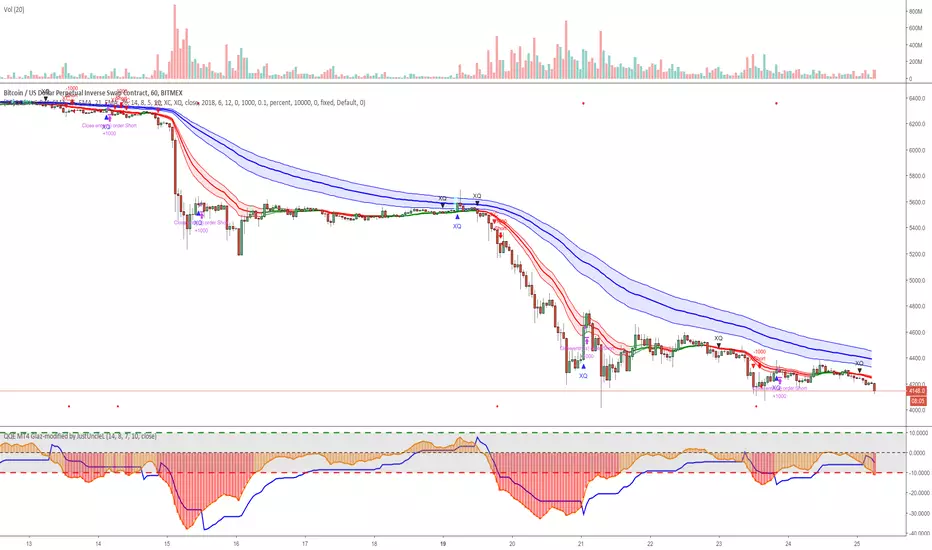
[Backtest]QQE Cross v6.0 by JustUncleLDescription:
This is the Backtest version of the " QQE Cross v6.0 by JustUncleL" Tool, can be used to optimize settings.
TrendMaster, v. 5.1TrendMaster (ver 5.0, a.k.a. "Mr. T") is a trend-anticipating system which shows eye-popping results. Rather than a simple "trend-rider" which continually lags, TrendMaster uses pattern recognition to anticipate trend changes. It hunts for turns in market cycles using a proprietary decision matrix of 27 "trade triggers" (variants of classic technical indicators). In backtesting the annualized return (July 2017-July2018) of the top 100 largest capitalized equities, not only did its results beat the indexes, but it outstripped a buy-and-hold strategy by a whopping 700%: i.e., while the 100 largest equities had an average annual yield of 17%, the strategy produced a 129% return across the entire range of stocks.* Even more staggering results can be seen when using the system in strongly-trending markets like cryptos. (See, for instance, the particularly stunning results for Bitcoin Cash in the screen shot at the end). [ ]
The following charts give you some sample tests of best performing (top chart) and worst performing (bottom chart) equities, ETFs, and cryptos (July 2017-July2018 time range).
TrendMaster / "Mr T" 5.1, Example Annualized returns
>>> Higher Performing Instruments (best performing interval between 15min - 1 day) <<<
Symbol Description Interval % Return Trades % Profitable Profit Factor Max Drawdown Sharpe Ratio Buy & Hold
DUST 3x Short Gold miners 30 min 3050% 421 43% 1.5 ( -17% ) 1.8 ( - 27 % )
NUGT 3x Long Gold miners 15 min 3300% 423 44 1.2 ( -11% ) 1.2 ( - 10 % )
APPL Apple, Inc 1 hour 118% 354 46 2.2 ( -6% ) 1.3 32%
GOOG Alphabet, Inc 30 min 128% 660 44 1.9 ( -5% ) 1 27%
BABA Alibaba Group 30 min 389% 642 46 2.3 ( -3% ) 1.6 37%
BTC/USDT Bitcoin 1 hour 1000000% 1573 53 3.1 ( -8% ) 1 57%
ETH/USDT Ethereum 1 hour 13000000% 1533 55 3.2 ( -12% ) 1.2 56%
LTC/ USDT Litecoin 30 min 5000000% 1946 54 2.8 ( -12% ) 1.2 ( - 71% )
>>> Lower Performing Instruments and/or Lower Performing Market Settings (worst performing interval between 15 min - 1 day) <<<
Symbol Description Interval % Return Trades % Profitable Profit Factor Max Drawdown Sharpe Ratio Buy & Hold
PSQ Short Nasdaq ETF 5 min ( - 14% ) 1894 28% ( - 0.9 % ) ( -20% ) ( -0.3 ) ( - 20 % )
SH Short S&P ETF 1 day 20% 35 51% 2.8 ( -7% ) 0.5 ( - 12 % )
MSFT Microsoft 1 hour 37% 249 37% 1.4 ( -4% ) 0.5 45%
AZN Astrazeneca, PLC 1 day 22% 32 50% 1.9 ( -6% ) 0.3 ( - 4 % )
MUFG Mitsubishi UFJ 1 day 296% 1255 39% ( - 0.6 ) ( -27% ) ( - 0.3 ) ( - 16 % )
BTC/USDT Bitcoin 1 min ( - 33 % ) 1349 25% ( - 0.5 ) ( - 33% ) ( - 1.1 ) 5%
ETH/USDT Ethereum 1 min ( - 40 % ) 1595 24% ( - 0.6 ) ( -40% ) ( - 1.1 ) 6%
LTC/USDT Litecoin 1 day 123 14 57% 4.8 ( - 5% ) 1.1 ( - 48% )
Note, of course, that any trend-anticipating bot has limitations. The Lower Performing results above show that because the system seeks gains in trends, it can underperform in choppy, aimless markets. Similarly, very short time frames (i.e. 1 - 5 minutes) can provide too many gaps and too few runs for it to reliably track. Backtesting is therefore essential to make sure this system is suitable for your (a) market, (b) time frame, and (c) trading mindset. On the other hand, a broad range of data show that almost any trending market, in almost any time frame, can be very productive.
Contact us if you would like to experience this bot.

cooltoyz: The Turtle SurferThis strategy applies the old tested turtle trading strategy, defining a channel and riding the trend, but
It has some twists tough, to make it adapt on the fly to changes in market conditions.
Since all parameters can be adjusted from the inputs, the strat can (and needs) to be fine tuned for the current values of an asset. for example, for gold values, it works good for years. for btc, it breaks for dates with values under 1500$. that's because 1% of 800 is not the same as 1% of 2400$..... Yeah, data fitting, i know all that....
Some of the parameters work well only for low volatility markets, others are designed exactly to capture volatility. So the parameters must be tested, turned on-off to see how well they do. The default values ARE NOT a generic good for all, most surely.
The Turtle Surfer moves slowly, but it's prepared to rabbit jump in/out if some moon/doom event shows up without invitation :)
If you want to play with the strat, start with all checkboxes off, then turn on/off each one and see the results for the asset you want.
I have had good results in xau, btc and eth

B3 Edge Trail-TraderAnswer to the locked strategy... Formerly "High-Low Trader" .. Changed the name to Edge Trail Trader to delineate from the locked version, which is no different. You can add this one to your favorites now.
Similar to SuperTrend or the ATR trailing stop lines that are common-place in chart indicator circles, the B3 High-Low Trail-Trader works as a back-break line to flip binary long and short biasing. Here is the strategy set to 7 bars back. You can find this style of trading system in several books, and there are many ways to come to the trailing stop line, so I imagine the bars back length can be slid around to suit certain charts. This happens to be my favorite trailing line.

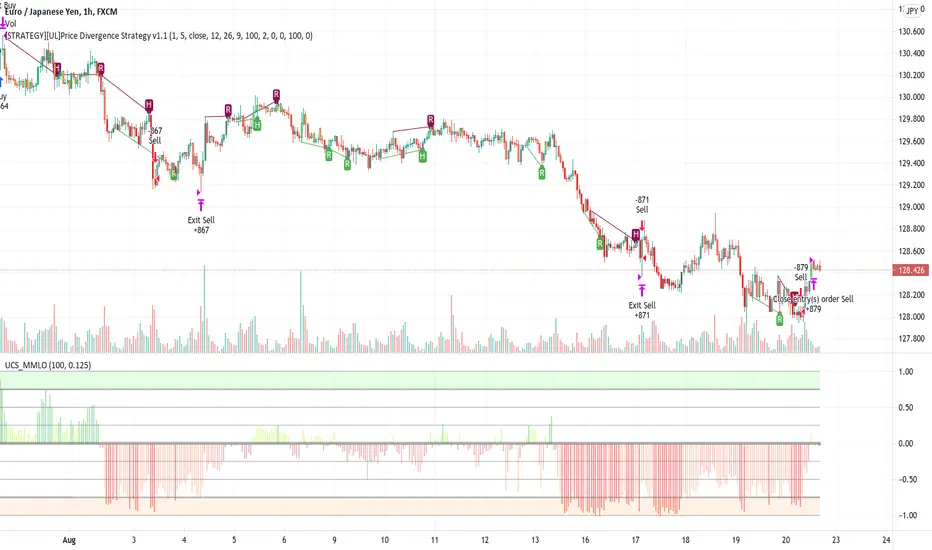
[STRATEGY][UL]Price Divergence Strategy v1.0Created by Request: This is a trend trading strategy that uses Price Divergence detection signals that are confirmed by the "Murrey's Math Oscillator" (Donchanin Channel based).
Strategy Code Based on:
Price Divergence Detector V2 by RicardoSantos
UCS_Murrey's Math Oscillator by Ucsgears
Strategy Risk Management Based on:
Strategy Code Example by JayRogers
Information on Divergence Trading:
- www.babypips.com
*** USE AT YOUR OWN RISK ***