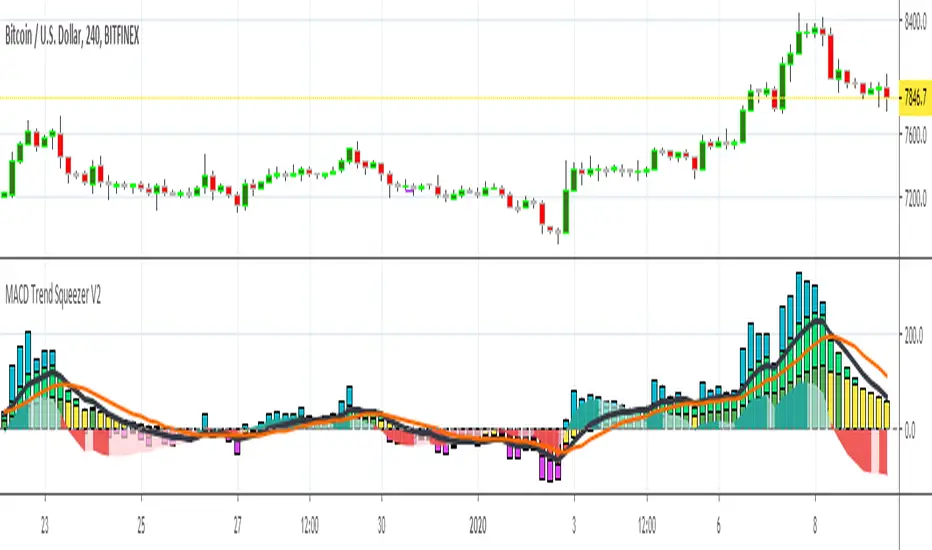
MACD Trend Squeezer V2This is a combination of a slightly sped up MACD overlay on top of a modified Bar Trend Squeeze or highly modified Momentum indicator. Helps to see the trend/momentum matched with the characteristics of the MACD and it's historiography. Very user friendly for adjusting color, transparency, depth, lines, size, etc.
MACD is the dark gray line.
Its signal slower line is orange.
Its historiography is the area fill blues and reds
Trend Squeezer / momentum are the Bars in the background.
// Changes from original version \\
Visual depth mostly. Most of the items are adjustable in the settings.
Increased user friendly inputs to adjust colors, lines, data, etc.
(darken / lighten and change background bar colors, increase/decrease line strengths and colors, adjust field data inputs)