Turnover (Volume * HLC/3)Let's get the elephant out of the room. Everyone knows volume is the key to validate price movement, but you can't compare two volume candles of the same stock when the price is 3 times different you need to account for that. So here it is, Turnover chart, to replace volume entirely, because why would you look at volume when you can look at turnover instead?
Turnover

Simple Turnover with TOMCAPOverview
Turnover, or the total value traded over a given period, helps you gauge whether there’s enough liquidity in the instrument being traded. This indicator calculates the average turnover and presents it as a bar-by-bar plot. It also calculates the turnover-to-market capitalization (Tomcap) ratio, and presents this in a configurable table or text summary.
Introduction
Volume indicates the total number of shares that have been bought or sold in a specific period or during the trading day.
A company's market capitalization at any given time can be determined by multiplying its stock price by the number of shares outstanding.
Share turnover is a measure of stock liquidity, calculated by dividing the total number of shares traded during some period by the average number of shares outstanding for the same period. The higher the share turnover, the more liquid company shares are.
Compared to traditional volumes, potting the change in turnover can provide a better representation of the flow of money.
At its simplest, the daily turnover on each bar is computed as the closing price for a stock multiplied by its average volume:
turnover = volume * close / 10000000
The script calculates this by using average prices for both:
turnover = sma_volume * sma_close / 10000000
Script Basics
The script computes & plots the n-period average turnover by multiplying the moving average of price and volume.
By default, the market cap is plotted bar by bar as a background behind the turnover bars.
Every time the turnover reaches a new high in a quarter, the color of the turnover bars turns dark green. This represents the HTQ (Highest Turnover in a Quarter) , and multiple consecutive HTQs indicate a significant influx of funds into that stock.
Uses
The primary purpose of the script is to assist traders in making more informed decisions regarding stock selection.
1. Screen out non-tradable stocks
Quickly spot low-turnover names (illiquid stocks) to avoid wide spreads. Filter out any stocks whose average daily turnover is below, say, ₹5 Cr. This helps in eliminating tickers whose average turnover never clears your minimum threshold.
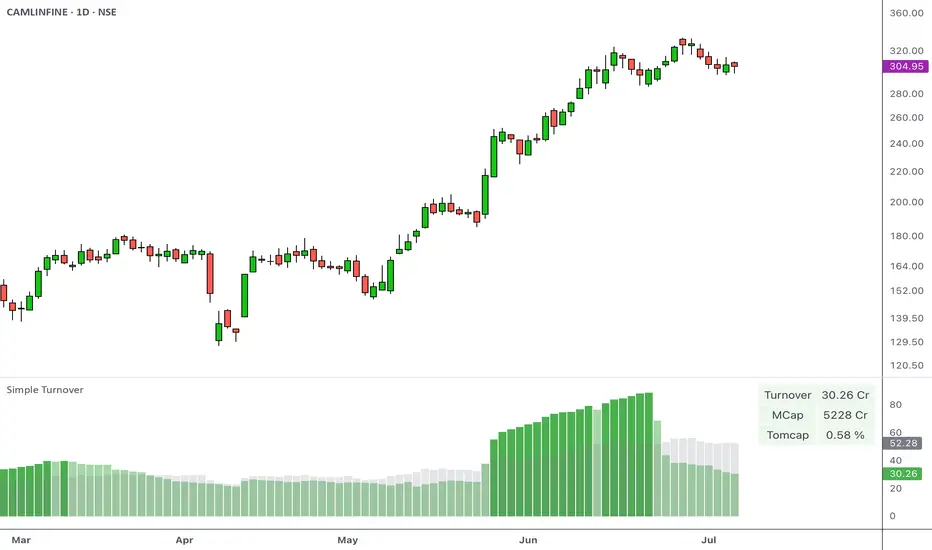
Example of a high-turnover stock:
Example of a low-turnover stock:
2. Turnover expansion
Observe when the average turnover suddenly expands from its previously subdued values. This occurs when money begins to flow in due to a catalyst, sectoral push, news flow, or any institutional activity.
Example:
3. Relative liquidity comparison
Even average turnover can sometimes overlook the context if we don’t know the company's size. That’s why the script also measures:
Turnover vs. Market cap (TOMCAP) , answering “What percent of the company’s value trades each day?”
Turnover vs. Free Float (TOFF) , showing liquidity against shares actually available for trading.
For example:
A small-cap stock with ₹1 Cr turnover but only ₹50 Cr market cap (Tomcap = 2 %)
vs. a large-cap with ₹10 Cr turnover and ₹20,000 Cr cap (Tomcap = 0.05 %)
Customization
A. Appearance
Dark Mode toggle switches colors to match your dark layout
Show turnover in Crores or Millions
B. What to show
Select the table size and position (e.g., top-left, bottom-center)
Under Table Settings, enable or disable any row:
Turnover
Mcap (market capitalization)
FF (free float)
1-Min liquidity (average turnover on 1-min bars)
Tomcap (Turnover to market capitalization) or Toff (Turnover to Free Float) ratio
C. Display mode
Table: a multi-row grid with colored cells
Text: a single summary string
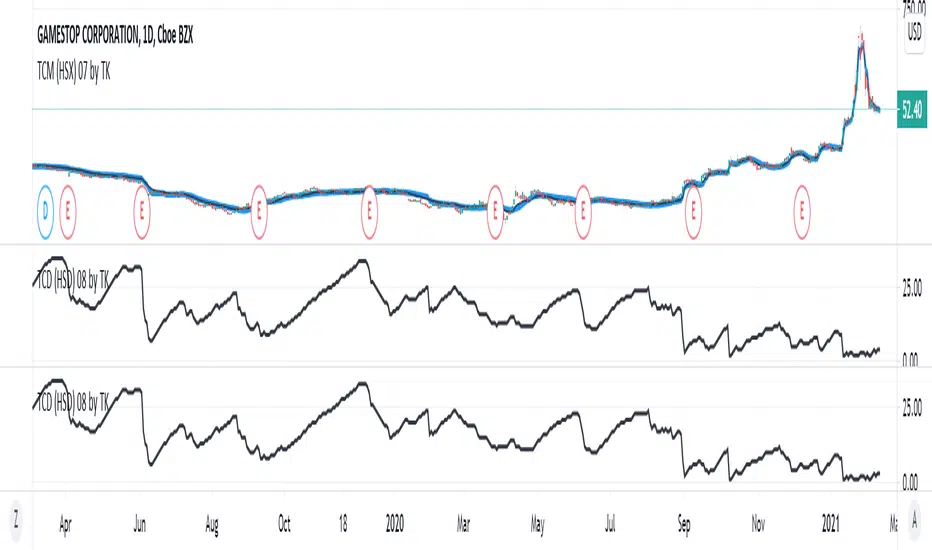
TradiKator 08 Turnover Cycle DayTradiKator 08 Turnover Cycle DAY (TCD(HSD) 08 by TK) is a visual indicator that underlying stock's character since its participants' collected forces cause the price movement.
Here, we use turnover rate estimation to identify a possible trading cycle period of a given underlying stock.
I hope this indicator can help traders to estimate a true market average price in the essential trading behavior.
Here is an input option to enter shares float manually in the case that a user who has quite a limited time frame financial data.
Known issue:
The share split will cause "Total float shares" inaccurate and therefore the result will be unreliable.
We are trying to find a solution.
TradiKator is Traders' indicator.
Please visit TraiKator for more free scripts.
We also support the Chinese.
Happy new year!
Wishing you a great and successful journey in the Chinese Zodiac Bull Year.
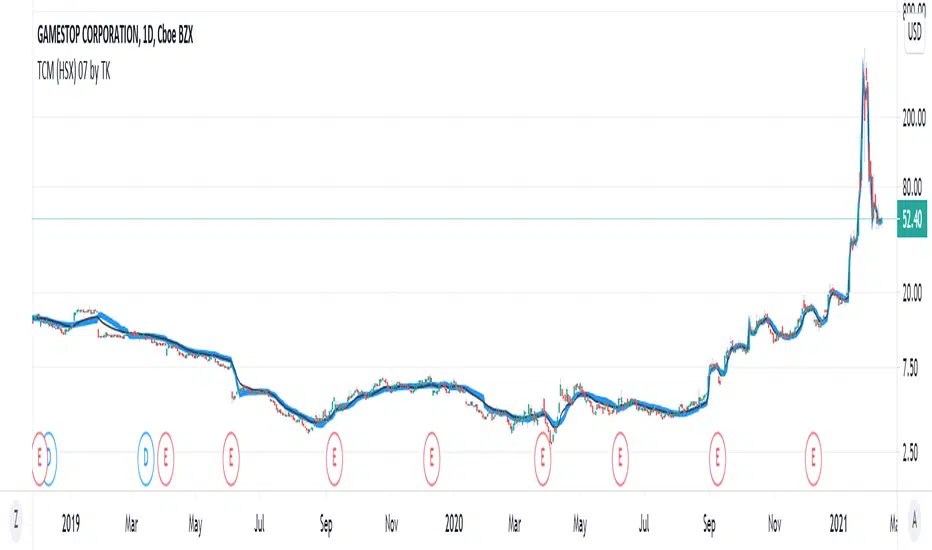
TradiKator 07 Turnover Cycle MATradiKator 07 Turnover Cycle MA (TCM (HSX) 07 by TK) is a visual indicator that underlying stock's character since its participants' collected forces cause the price movement.
Here, we use turnover rate estimation to identify a possible trading level of a given underlying stock.
I hope this indicator can help traders to estimate a true market average price in the essential trading behavior.
Here is an input option to enter shares float manually in the case that a user who has quite a limited time frame financial data.
Known issue:
The share split will cause "Total float shares" inaccurate and therefore the result will be unreliable.
We are trying to find a solution.
TradiKator is Traders' indicator.
Please visit TraiKator for more free scripts.
We also support the Chinese.
Happy new year!
Wishing you a great and successful journey in the Chinese Zodiac Bull Year.