Oster's Fair Economy (OFE)Overview:
Oster's Fair Economy (OFE) is a powerful tool designed to give traders and investors a comprehensive assessment of the fair value of major stock indices . Unlike conventional indicators that focus solely on technical analysis, OFE emphasizes economic metrics to offer a deeper understanding of the market's intrinsic value. By applying Oster's method (explained below), OFE determines the fundamental fair price of key indices, making it an invaluable tool for top-down analysis and market confirmation. It is particularly useful for swing trading on indices and as a top-down confirmation for individual stock trades.
Important Note:
OFE is designed for use with indices, not individual stocks : Stocks are often driven by their own fundamental factors, such as earnings, revenue, and dividend yields, which may not align with broad economic metrics. While OFE can sometimes provide insights into individual stocks, particularly those highly correlated with broader market trends, it is specifically intended for index analysis.
OFE is optimized for Weekly Candles (W ): OFE is most effective when used with weekly data, as it aligns with the longer-term outlook of economic analyses. While it can be used with smaller timeframes, weekly data is recommended for the most accurate insights.
Innovative Approach to Economic Analysis:
OFE integrates a unique combination of key economic metrics , including:
Gross National Product (GNP)
Consumer Price Index (CPI)
Unemployment Rate (UR)
Interest Rate (e.g., FED)
Nonfarm Payrolls (NFP)
Retail Sales (RS)
Industrial Production (IP)
Balance Of Trade (BOT)
Money Supply M2 (M2)
Consumer Confidence Index (CCI)
These metrics are tailored for 20 different markets : United States (US), Canada (CA), European Union (EU), Germany (DE), United Kingdom (GB), France (FR), Italy (IT), Switzerland (CH), Spain (ES), Australia (AU), New Zealand (NZ), Japan (JP), China (CN), Hong Kong (HK), South Korea (KR), India (IN), Russia (RU), Brazil (BR), Mexico (MX), and Saudi Arabia (SA).
This comprehensive set of data allows traders to gauge the potential for growth, inflation, and overall market conditions . OFE's weighting system reflects the importance of these metrics in determining the fair value of indices according to Oster's methodology .
How OFE Works:
OFE's calculation methodology is designed to provide insights into whether an index is fundamentally overvalued, undervalued, or trading at fair value by comparing its price dynamics with economic data. Here’s a step-by-step breakdown of how OFE works:
Economic Data Collection : OFE retrieves relevant economic data from the selected region, such as GDP, CPI, and interest rates. If specific market data is unavailable, OFE defaults to the US market as a fallback.
Normalization and Weighting : The collected economic metrics are normalized against historical trends to ensure that the data reflects both current levels and long-term averages. For example, GDP growth rates are normalized based on historical data, allowing for a comparison across different economic periods. Similarly, CPI and unemployment rates are adjusted to account for historical context, ensuring that high inflation or unemployment is appropriately weighed relative to past conditions. However, all other macroeconomic key figures are also processed in the same way.
Relating Economic Metrics to Price Dynamics : OFE calculates specific ratios by comparing the selected index’s price with the normalized economic data. These ratios, such as the GNP ratio, are then analyzed within the context of historical performance. The goal is to establish a relationship between the economic indicators and the index’s historical price behavior. For instance, if the GNP ratio is currently higher than historical norms, it could suggest that the index is overvalued relative to the economy’s actual productivity.
Fair Value Calculation : Based on the derived ratios and their historical correlations with index prices, OFE computes a fair value for the index. This calculation integrates multiple economic indicators, each weighted according to its perceived importance in influencing the index. For example, in a high-growth environment, GDP and industrial production might carry more weight, whereas in a recession, unemployment and interest rates could become more influential. The resulting fair value reflects the index's price adjusted for the current economic environment.
Price Comparison : The calculated fair value is then compared to the current market price of the index. If the market price significantly deviates from the fair value, it suggests that the index is either overvalued or undervalued. For example, if the fair value of the S&P 500 is calculated to be 10% lower than its current market price, OFE would indicate that the index might be overvalued, potentially signaling a market correction. The fair price line basically acts as a kind of magnet that keeps attracting the index price. This is because, in the longer term, the broad market is always guided by the economic health of the country in concerned.
Market Dynamics Consideration : By adjusting the "Strictness" level in OFE, users can control how sensitive the fair value calculation is to economic fundamentals. A higher strictness level would highlight discrepancies between the fair value and the market price more aggressively, suggesting a higher likelihood of market mispricing. Conversely, a lower strictness level allows for greater flexibility, acknowledging that markets can sometimes deviate from fundamental values without immediate correction.
Customizable Parameters for Tailored Analysis:
OFE offers extensive customization options to align with your specific investment strategy. Users can:
Select or deselect economic metrics for inclusion.
Adjust the weighting of each metric to reflect its importance in their analysis.
Fine-tune the strictness of the valuation process (as explained above).
Additionally, users can compare different indices with various macroeconomic data sets . For example, you might select the DAX index and apply US economic data to see how the index would perform if driven by US market fundamentals. This feature enables a highly tailored and region-specific analysis, empowering traders to align OFE with their individual perspectives and market outlooks.
Interpretation:
If the calculated fair price is above the current index value, the index is considered fundamentally undervalued, indicating potential for price increases. Conversely, if the fair price is below the current index value, the index is seen as overvalued, suggesting potential risks or a possible correction. The fair price acts as a gravitational force, pulling the index toward its true economic value over time.
This over- or undervaluation can also serve as an overarching economic confirmation for stock trading . For example, it might be advantageous to buy individual stocks when the broader market is fundamentally undervalued, as the general upward potential of the market could support stock price increases. Conversely, selling or avoiding stocks when the broader market is overvalued could help mitigate potential risks, as the market may be primed for a correction.
Conclusion:
Oster's Fair Economy (OFE) bridges the gap between technical simplicity and the depth of macroeconomic analysis . By integrating complex economic metrics with user-friendly customization, OFE empowers traders and investors to assess the fair valuation of indices confidently . This tool is ideal for confirming market trends and gaining a broader understanding of the economic landscape, making it a valuable asset in any investment toolkit.
Unemploymentrate

US Recession IndicatorThe US Recession Indicator is designed to identify recessions as they happen, using two reputable indicators that have accurately foreseen all past recessions since 1969. Unlike the National Bureau of Economic Research (NBER) which determines recession dates after the fact, this indicator seeks to spot recessions in real-time. When both of these distinct metrics meet certain criteria, the chart's background becomes shaded, signifying a strong likelihood that the economy is in a recession. Furthermore, a built-in alert system keeps users updated without constant monitoring.
The first metric is the Smoothed Recession Probabilities developed by Marcelle Chauvet. It is based on a dynamic-factor markov-switching model that assesses four monthly coincident variables: non-farm payroll employment, the index of industrial production, real personal income excluding transfer payments and real manufacturing and trade sales. It offers a mathematical analysis of how recessions deviate from expansions. In essence, this index mirrors the probability of the prevailing true economic situation being a recession, grounded on the current GDP data.
The second metric is the Sahm Rule Recession Indicator developed by Claudia Sahm. It operates on the principle that changes in the unemployment rate can be used to identify the onset of a recession. According to this rule, if the three-month moving average of the unemployment rate rises by 0.5 percentage points or more above its lowest point from the preceding year, it flags a potential recession.
For this combined indicator, the thresholds are intentionally set lower than when each metric is used individually. Both metrics must simultaneously suggest a potential recession in order to send a signal. This stems from the realisation that neither metric is infallible and has, on occasion, sent false signals in the past. By requiring both to align, the likelihood of a false positive is reduced. However, it's crucial to understand that past performance does not guarantee future results, leaving the door open for potential false alerts which may not be confirmed by the NBER.

Global Unemployment RateThe Global Unemployment rate estimates what is the rate of unemployment of the whole world, taking same data from multiple countries and normalizing them.
It includes the Eurozone + 19 countries from all the continents, which are some of the richest countries as well as some of the most populous.
It sadly does not include India as its unemployment data on trading view as of today (Feb 2023) is only since year 2019, which is too short

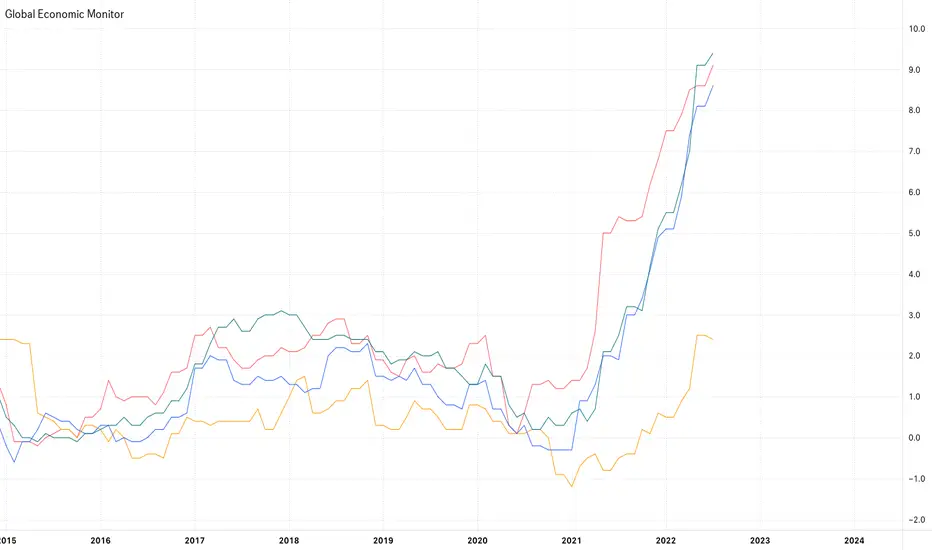
Global Economic MonitorThis indicator shows multiple economic data such as inflation rate, GDP etc. of the countries below.
U.S.
Japan
EU
U.K.
Australia
New Zealand
Canada
Switzerland
China
You can select 3 data at the same time so that you can compare data in single country or among multiple countries.
Available data:
Inflation Rate(YoY)
Inflation Rate(MoM)
Inflation Expectation
GDP
GDP Growth
Unemployment Rate
Retail Sales
—————————————
主要国の経済指標(インフレ率やGDPなど)を表示することのできるインジケーターです。
対象国/地域:
アメリカ
日本
EU
イギリス
オーストラリア
ニュージーランド
カナダ
スイス
中国
データは最大3つまで同時に表示することができます。
一つの国で複数指標を比較したり、同一指標を異なる国で比較する時に選択してください。
選択可能データ
インフレ率(対前年比)
インフレ率(対前月比)
期待インフレ率
GDP
GDP成長率
失業率
小売売上高