AI x Meme Impulse Tracker [QuantraSystems]AI x Meme Impulse Tracker
Quantra Systems guarantees that the information created and published within this document and on the Tradingview platform is fully compliant with applicable regulations, does not constitute investment advice, and is not exclusively intended for qualified investors.
Important Note!
The system equity curve presented here has been generated as part of the process of testing and verifying the methodology behind this script.
Crucially, it was developed after the system was conceptualized, designed, and created, which helps to mitigate the risk of overfitting to historical data. In other words, the system was built for robustness, not for simply optimizing past performance.
This ensures that the system is less likely to degrade in performance over time, compared to hyper-optimized systems that are tailored to past data. No tweaks or optimizations were made to this system post-backtest.
Even More Important Note!!
The nature of markets is that they change quickly and unpredictably. Past performance does not guarantee future results - this is a fundamental rule in trading and investing.
While this system is designed with broad, flexible conditions to adapt quickly to a range of market environments, it is essential to understand that no assumptions should be made about future returns based on historical data. Markets are inherently uncertain, and this system - like all trading systems - cannot predict future outcomes.
Introduction
The AI x Meme Impulse Tracker is a cutting-edge, fast-acting rotational algorithm designed to capitalize on the strength of assets within pre-selected categories. Using a custom function built on top of the RSI Pulsar, the system measures momentum through impulses rather than traditional trend following methods. This allows for swifter reallocations based on short bursts of strength.
This system focuses on precision and agility - making it highly adaptable in volatile markets. The strategy is built around three independent asset categories - with allocations only made to the strongest asset in each - ensuring that capital movement (in particular between blockchains) is kept to a minimum for efficiency purposes while maintaining exposure to the highest performing tokens.
Legend
Token Inputs:
The Impulse Tracker is designed with dynamic asset selection - allowing traders to customize the inputs for each category. This feature enables flexible system management, as the number of active tokens within each category can be adjusted at any time. Whether the user chooses the default of 13 tokens per category, or fewer, the system will automatically recalibrate. This ensures that all calculations, from relative strength to individual performance assessments, adjust as required. Disabled tokens are treated by the system as if they don’t exist - seamlessly updating performance metrics and the Impulse Tracker’s allocation behavior to maintain the highest level of efficiency and accuracy.
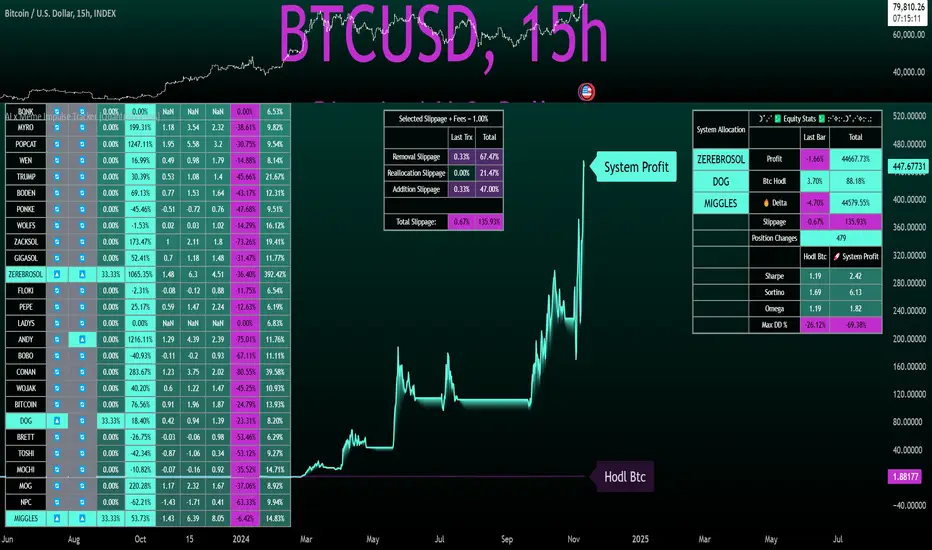
System Equity Curve:
The Impulse Tracker plots both the rotational system’s equity and the Buy-and-Hold (or ‘HODL’) benchmark of Bitcoin for comparison. While the HODL approach allocates the entire portfolio to Bitcoin and functions as an index to compare to, the Impulse Tracker dynamically allocates based on strength impulses within the chosen tokens and categories. The system equity curve is representative of adding an equal capital split between the strongest assets of each category. The relative strength system does handle ‘ties’ of strength - in this situation multiple tokens from a single category can be included in the final equity curve, with the allocated weight to that category split between the tied assets.
TABLES:
Equity Stats:
This table is held in Quantra System's typical UI design language. It offers a comprehensive snapshot of the system’s performance, with key metrics organized to help traders quickly assess both short-term and cumulative results. The left side provides details on individual asset performance, while the right side presents a comparison of the system’s risk-adjusted metrics against a simple BTC Hodl strategy.
The leftmost column of the Equity Stats table showcases performance indicators for the system’s current allocations. This provides quick identification of the current strongest tokens, based on confirmed and non-repainting data as soon as the current opens and the last bar closes.
The right-hand side compares the performance differences between the system and Hodl profits, both on a cumulative basis and analyzing only the previous bar. The total number of position changes is also tracked in this table - an important metric when calculating total slippage and should be used to determine how ‘hands-on’ the strategy will be on the current timeframe.
The lower part of the table highlights a direct comparison of the AI x Memes Impulse strategy with buy-and-hold Bitcoin. The risk adjusted performance ratios, Sharpe, Sortino and Omega, are shown side by side, as well as the maximum drawdown experienced by both strategies within the set testing window.
Screener Table:
This table provides a detailed breakdown of the performance for each asset that has been the strongest in its category at some point and thus received an allocation. The table tracks several key metrics for each asset - including returns, volatility, Sharpe ratio, Sortino ratio, Omega ratio, and maximum drawdown. It also displays the signals for both current and previous periods, as well as the assets weight in the theoretical portfolio. Assets that have never received a signal are also included, giving traders an overview of which assets have contributed to the portfolio's performance and which have not played a role so far.
The position changes cell also offers important insights, as it shows the frequency of not just total position changes, but also rebalancing events.
Detailed Slippage Table:
The Detailed Slippage Table provides a comprehensive breakdown of the calculated slippage and fees incurred throughout the strategy’s operations. It contains several key metrics that give traders a granular view of the costs associated with executing the system:
Selected Slippage - Displays the current slippage rate, as defined in the input menu.
Removal Slippage - This accounts for any slippage or fees incurred when removing an allocation from a token.
Reallocation Slippage - Tracks the slippage or fees when reallocating capital to existing positions.
Addition Slippage - Measures the slippage or fees incurred when allocating capital to new tokens.
Final Slippage - Is the sum of all the individual slippage points and provides a quick view of the total slippage accounted for by the system.
The table is also divided into two columns:
Last Transaction Slippage + Fees - Displays any slippage or fees incurred based on position changes within the current bar.
Total Slippage + Fees - Shows the cumulative slippage and fees incurred since the portfolio’s selected start date.
Visual Customization:
Several customizable features are included within the input menu to enhance user experience. These include custom color palettes, both preloaded and user-selectable. This allows traders to personalize the visual appearance of the tables, ensuring clarity and consistency with their preferred interface themes and background coloring.
Additionally, users can adjust both the position and sizes of all the tables - enabling complete tailoring to the trader’s layout and specific viewing preferences and screen configurations. This level of customization ensures a more intuitive and flexible interaction with the system’s data.
Core Features and Methodologies
Advanced Risk Management - A Unique Filtering Approach:
The Equity Curve Activation Filter introduces an innovative way to dynamically manage capital allocation, aligning with periods of market trend strength. This filter is rooted in the understanding that markets move cyclically - altering between periods trending and mean-reverting periods. This cycle is especially pronounced in the crypto markets, where strong uptrends are often followed by prolonged periods of sideways movements or corrections as participants take profits and momentum fades.
The Cyclical Nature of Markets and Trend Following:
Financial markets do not trend indefinitely. Each uptrend or downtrend, whether over high and low timeframes, tends to culminate in a phase where momentum exhausts - leading to the sideways or corrective phases. This cycle results from the natural dynamics of market participants: during extended trends, more participants jump in, riding the momentum until profit taking causes the trend to slow down or reverse. This cyclical behavior occurs across all timeframes and in all markets - making it essential to adapt trading strategies in attempt to minimize losses during less favorable conditions.
In a trend following system, profitability often mirrors this cyclical pattern. Trend following strategies thrive when markets are moving directionally, capturing gains as price moves with strength in a single direction. However in phases where the market chops sideways, trend following strategies will usually experience drawdowns and reduced returns due to the impersistent nature of any trends. This fluctuation in trend following profitability can actually serve as one of the best coincident indicators of broader market regime change - when profitability begins to fade, it often signals a transition to drawn out unfavorable trend trading conditions.
The Equity Curve as a Market Signal
Within the Impulse Tracker, a continuous equity curve is calculated based upon the system's allocation to the strongest tokens. This equity curve effectively tracks the system’s performance under all market conditions. However, instead of solely relying on the direct performance of the selected tokens, the system applies additional filters to analyze the trend strength of this equity curve itself.
In the same way you only want to purchase an asset that is moving up in price, you only want to allocate capital to a strategy whose equity curve is trending upwards!
The Equity Curve Activation Filter consistently monitors the trend of this equity curve through various filter indicators, such as the “Wave Pendulum Trend”, the “Quasar QSM” and the “MAQSM” (an aggregate of multiple types of averages). These filters help determine whether the equity curve is trending upwards, signaling a favorable period for trend following. When the equity curve is in a positive trend, capital is allocated to the system as normal - allowing it to capture gains during favorable market conditions, Conversely, when the trend weakens and the equity curves begins to stagnate or decline, the activation filter shifts the system into a “cash” positions - temporarily halting allocations in order to prevent market exposure during choppy or mean reverting phases.
Timing Allocation With Market Conditions
This unique filtering approach ensures that the system is primarily active during periods when market trends are most supportive. By aligning capital allocations with the uptrend in trend following profitability, the system is designed to enter during periods of strong momentum and move to cash when momentum with the equity curve wanes. This approach reduces the risk of overtrading in less favorable conditions and preserves capital for the next favorable trend.
In essence the Equity Curve Allocation Filter serves as a dynamic risk management layer that leverages the cyclicality of trend following profitability in order to navigate shifting market phases.
Sensitivity and Signal Responsiveness:
The Quasar Sensitivity Setting allows users to fine-tune the system’s responsiveness to asset signals. High sensitivity settings lead to quicker position changes, making the system highly reactive to short term strength impulses. This is especially useful in fast moving markets where token strength can shift rapidly. The Sensitive setting might be more applicable to higher volatility or lower market cap assets - as the increased volatility increases the necessity of faster position cutting in order to front run the crowd. Of course - a balanced approach is ideal, as if the signals are too fast there will be too many whips and false signals. (And extra fees + slippage!)
The benefit of this script is because of the advanced slippage calculations, false signals are sufficiently punished (unlike systems without fees or slippage) - so it will become immediately apparent if the false signals have a significantly detrimental impact on the system’s equity curve.
Asset specific signals within each category are re-evaluated after the close of each bar to ensure that capital is always allocated to the highest performing asset. If a token’s momentum begins to fade the system swiftly reallocates to the next strongest asset within that category.
Category Filter - Allocates only to the Strongest Asset per group
One of the core innovations of the AI x Meme Impulse Tracker is the customizable Category Filter, which ensures that only the strongest-performing asset within each predefined group receives capital allocation. This approach not only increases the precision of asset selection but also allows traders to tailor the system to specific token narratives or categories. Sectors can include trending themes such as high-attention meme tokens, AI-driven tokens, or even categorize assets by blockchain ecosystems like Ethereum, Solana, or Base chain. This flexibility enables users to align their strategies with the latest market narratives or to optimize for specific groups, focusing on high-beta tokens within well defined sectors for a more targeted exposure. By keeping the focus on category leaders, the system avoids diluting its impact across underperforming assets, thereby maximizing capital efficiency and reducing unnecessary trading costs.
Dynamic Asset Reallocation:
Dynamic reallocation ensures that the system remains nimble and adapts to changing market conditions. Unlike slower systems, the Quasar method continually monitors for changes in asset strength and reallocates capital accordingly - ensuring that the system is always positioned in the highest performing assets within each category.
Position Changes and Slippage:
The Impulse Tracker places a strong emphasis on realistic simulation, prioritizing accuracy over inflated backtest results. This approach ensures that slippage is accounted for in a more aggressive manner than what may be experienced in real-world execution.
Each position change within the system - whether it’s buying, selling, reallocating, or rebalancing between assets - incurs slippage. Slippage is applied to both ends of every transaction: when a position is entered and exited, and when reallocating capital from one token to another. This dynamic behavior is further enhanced by a customizable slippage/fees input, allowing users to simulate realistic transaction costs based on their own market conditions and execution behaviors.
The slippage model works by applying a weighted slippage to the equity curve, taking into account the actual amount of capital being moved. Slippage is not applied in a blanket manner but rather in proportion to the allocation changes. For example, if the system reallocates from a single 100% position to two 50% allocations, slippage will be applied to the 50% removed from the first asset and the 50% added to the new asset, resulting in a 1x slippage multiplier.
This process becomes more granular when multiple assets are involved. For instance, if reallocating from two 50% positions to three 33% positions, slippage will be incurred on each of the changes, but at a reduced rate (⅔ x slippage), reflecting the smaller percentage of portfolio equity being moved. The slippage model accounts for all types of allocation shifts, whether increasing or decreasing the number of tokens held, providing a realistic assessment of system costs.
Here are some detailed examples to illustrate how slippage is calculated based on different scenarios:
100% → 50% / 50%: 1x slippage applied to both position changes (2 allocation changes).
50% / 50% → 33% / 33% / 33%: ⅔ x slippage multiplier applied across 3 allocation changes.
33% / 33% / 33% → 100%: 4/3 x slippage multiplier applied across 3 allocation changes.
In practice, not every position change will be rebalanced perfectly, leading to a lower number of transactions and lower costs in practice. Additionally, with the use of limit orders, a trader can easily reduce the costs of entering a position, as well as ensuring a competitive entry price.
By simulating slippage in this granular manner, the system captures the absolute maximum level of fees and slippage, in order to ensure that backtest results lean towards an underrepresentation - opposed to inflated results compared with practical execution.
A Special Note on Slippage
In the image above, the system has been applied to four different timeframes - 20h, 15h, 10h, and 5h - using identical settings and a selected slippage amount of 2%. By isolating a recent trend leg, we can illustrate an important concept: while the 15h timeframe is more profitable than the 20h timeframe, this difference stems from a core trading principle. Lower timeframes typically provide more data points and allow for quicker entries and exits in a robust system. This often results in reduced downside and compounding of gains.
However, slippage, fees, and execution constraints are limiting factors, especially in volatile, low-cap cryptocurrencies. Although lower timeframes can improve performance by increasing trade frequency, each trade incurs heavy slippage costs that accumulate - impacting the portfolio’s capital at a compounding rate. In this example, the chosen slippage rate of 2% per trade is designed to reflect the realistic trading costs, emphasizing how lower timeframe trading comes at the cost of increased slippage and fees
Finding the optimal balance between timeframe and slippage impact requires careful consideration of factors such as portfolio size, liquidity of selected tokens, execution speed, and the fee rate of the exchange you execute trades on.
Equity Curve and Performance Calculations
To provide a benchmark, the script also generates a Buy-and-Hold (or "HODL") equity curve that represents a complete allocation to Bitcoin. This allows users to easily compare the performance of the dynamic rotation system with that more traditional benchmark strategy.
The script tracks key performance metrics for both the dynamic portfolio and the HODL strategy, including:
Sharpe Ratio
The Sharpe Ratio is a key metric that evaluates a portfolio’s risk-adjusted return by comparing its ‘excess’ return to its volatility. Traditionally, the Sharpe Ratio measures returns relative to a risk-free rate. However, in our system’s calculation, we omit the risk-free rate and instead measure returns above a benchmark of 0%. This adjustment provides a more universal comparison, especially in the context of highly volatile assets like cryptocurrencies, where a traditional risk-free benchmark, such as the usual 3-month T-bills, is often irrelevant or too distant from the realities of the crypto market.
By using 0% as the baseline, we focus purely on the strategy's ability to generate raw returns in the face of market risk, which makes it easier to compare performance across different strategies or asset classes. In an environment like cryptocurrency, where volatility can be extreme, the importance of relative return against a highly volatile backdrop outweighs comparisons to a risk-free rate that bears little resemblance to the risk profile of digital assets.
Sortino Ratio
The Sortino Ratio improves upon the Sharpe Ratio by specifically targeting downside risk and leaves the upside potential untouched. In contrast to the Sharpe Ratio (which penalizes both upside and downside volatility), the Sortino Ratio focuses only on negative return deviations. This makes it a more suitable metric for evaluating strategies like the AI x Meme Impulse Tracker - that aim to minimize drawdowns without restricting upside capture. By measuring returns relative to a 0% baseline, the Sortino ratio provides a clearer assessment of how well the system generates gains while avoiding substantial losses in highly volatile markets like crypto.
Omega Ratio
The Omega Ratio is calculated as the ratio of gains to losses across all return thresholds, providing a more complete view of how the system balances upside and downside risk even compared to the Sortino Ratio. While it achieves a similar outcome to the Sortino Ratio by emphasizing the system's ability to capture gains while limiting losses, it is technically a mathematically superior method. However, we include both the Omega and Sortino ratios in our metric table, as the Sortino Ratio remains more widely recognized and commonly understood by traders and investors of all levels.
Usage Summary:
While the backtests in this description are generated as if a trader held a portfolio of just the strongest tokens, this was mainly designed as a method of logical verification and not a recommended investment strategy. In practice, this system can be used in multiple ways.
It can be used as above, or as a factor in forming part of a broader asset selection system, or even a method of filtering tokens by strength in order to inform a day trader which tokens might be optimal to look for long-only trading setups on an intrabar timeframe.
Final Summary:
The AI x Meme Impulse Tracker is a powerful algorithm that leverages a unique strength and impulse based approach to asset allocation within high beta token categories. Built with a robust risk management framework, the system’s Equity Curve Activation Filter dynamically manages capital exposure based on the cyclical nature of market trends, minimizing exposure during weaker phases.
With highly customizable settings, the Impulse Tracker enables precise capital allocation to only the strongest assets, informed by real-time metrics and rigorous slippage modeling in order to provide the best view of historical profitability. This adaptable design, coupled with advanced performance analytics, makes it a versatile tool for traders seeking an edge in fast moving and volatile crypto markets.
Volatile
Volatility SpeedometerThe Volatility Speedometer indicator provides a visual representation of the rate of change of volatility in the market. It helps traders identify periods of high or low volatility and potential trading opportunities. The indicator consists of a histogram that depicts the volatility speed and an average line that smoothes out the volatility changes.
The histogram displayed by the Volatility Speedometer represents the rate of change of volatility. Positive values indicate an increase in volatility, while negative values indicate a decrease. The height of the histogram bars represents the magnitude of the volatility change. A higher histogram bar suggests a more significant change in volatility.
Additionally, the Volatility Speedometer includes a customizable average line that smoothes out the volatility changes over the specified lookback period. This average line helps traders identify the overall trend of volatility and its direction.
To enhance the interpretation of the Volatility Speedometer, color zones are used to indicate different levels of volatility speed. These color zones are based on predefined threshold levels. For example, green may represent high volatility speed, yellow for moderate speed, and fuchsia for low speed. Traders can customize these threshold levels based on their preference and trading strategy.
By monitoring the Volatility Speedometer, traders can gain insights into changes in market volatility and adjust their trading strategies accordingly. For example, during periods of high volatility speed, traders may consider employing strategies that capitalize on price swings, while during low volatility speed, they may opt for strategies that focus on range-bound price action.
Adjusting the inputs of the Volatility Speedometer indicator can provide valuable insights and flexibility to traders. By modifying the inputs, traders can customize the indicator to suit their specific trading style and preferences.
One input that can be adjusted is the "Lookback Period." This parameter determines the number of periods considered when calculating the rate of change of volatility. Increasing the lookback period can provide a broader perspective of volatility changes over a longer time frame. This can be beneficial for swing traders or those focusing on longer-term trends. On the other hand, reducing the lookback period can provide more responsiveness to recent volatility changes, making it suitable for day traders or those looking for short-term opportunities.
Another adjustable input is the "Volatility Measure." In the provided code, the Average True Range (ATR) is used as the volatility measure. However, traders can choose other volatility indicators such as Bollinger Bands, Standard Deviation, or custom volatility measures. By experimenting with different volatility measures, traders can gain a deeper understanding of market dynamics and select the indicator that best aligns with their trading strategy.
Additionally, the "Thresholds" inputs allow traders to define specific levels of volatility speed that are considered significant. Modifying these thresholds enables traders to adapt the indicator to different market conditions and their risk tolerance. For instance, increasing the thresholds may highlight periods of extreme volatility and help identify potential breakout opportunities, while lowering the thresholds may focus on more moderate volatility shifts suitable for range trading or trend-following strategies.
Remember, it is essential to combine the Volatility Speedometer with other technical analysis tools and indicators to make informed trading decisions.

time between close 1.0 - find active charts
Title: Time Between Close (TBC) Indicator
Description:
The Time Between Close (TBC) Indicator is designed to help traders visualize the time between candle closes in seconds. The timeframe option default is set to 1 second. This is in order to check how often a candle is produced on the one second timeframe regardless of what timeframe your chart is on. These values of time between candles are then averaged using the moving average length.
So if you have a moving average length of 60, it will look at the past 60 candles and count the time between each candle, and give you an average in seconds. The shortest time between candles that it can go is 1 second.
The increment option should only be adjusted to a higher timeframes when you need to see further back because the existing plot is very short.
Note, this indicator is not suitable for BTC as BTC generally always has several ticks per second and the indicator will always show up as 1 second.
1. Timeframe options: Set the timeframe for measuring the time between candle closes (default: 1 second).
2. Moving average length: Choose between simple moving average (SMA) or exponential moving average (EMA) for calculating the average time between candle closes.
3. Time increment option: Adjust the time increment for the color gradient (default: 5 seconds). Increase this value for higher timeframes to see further back when the existing plot is too short.
4. Customizable label sizes, label distances, and horizontal line transparencies.
To get an idea of the gradient,
These are the colors from fastest moving to slowest:
Blue
Light Blue
Cyan
Light Green
Green
Yellow-Green
Yellow
Orange
Red-Orange
Red

ADX Trend FilterADX Trend Filter Indicator is a traditional ADX indicator with a different presentation. its consist of two indicators EMA TREND and ADX / DMI
About Indicator:
1. BAND / EMA band to represent EMA Trend of EMA-12 and EMA-50
(Band is plotted at level-20 which is the Threshold level of DMI / ADX indicator)
2. Histogram showing the direction of ADX / DMI trend
3. Area behind the histogram showing ADX/DMI strength
How to use?
1. Histogram represents current Trend Red for Bearish / Green for Bullish
2. Area behind the histogram represents Strength of ADX / DMI Threshold level is 0-20(represented as band). (Area below the Band is Sideways)
3. Band represents the current MA Trend.
4. Buy Sell signals are plotted as triangles in red/green obtained from ADX / DMI Crossovers
Buy Signal (Green Triangle on band- ADX Crossover)
1.Band below Histogram must be Green
2.Histogram must be green
3.Area behind histogram must be above the lower trend band (20level) and visible
Sell Signal (Red Triangle on band- ADX Crossover)
1.Band below Histogram must be Red
2.Histogram must be Red
3.Area behind histogram must be above the lower trend band (20level) and visible
Alerts provided for ADX crossovers.

Range Identifier*Re-upload as previous attempt was removed.
An attempt to create a half decent identifier of when the markets are ranging and in a state of choppiness and mean reversion - as opposed to in trending trade conditions.
It's super simple logic just working on some basic price action and market structure operating on higher time frames.
It uses the Donchian Channels but with hlc3 data as opposed to high/lows - and identifies periods in which the baseline is static, or when the channel upper & lower are contracting.
This combination identifies non trending price action with decreasing volatility, which tends to indicate a lot of upcoming chop and ranging/sideways action; especially when intraday trading and applied on the daily timeframe.
The filter increasing results in a decrease of areas identified as choppy by extending the required period of a sideways static basis, I've found values of 2 or 3 to be a nice sweetspot!
Overall should be pretty intuitive to use, when the background changes just consider altering your trading and investing approach. This was created as I've not really seen anything on here that functions quite the same.
I decided to not include the Donchian upper/lower/basis as I found that can often lead to decision bias and being influenced by where these lines are situated causing you to guess on future direction.
It's obviously never going to be perfect, but a nice and unbiased way to quickly check where we may be in a cycle; let me know if there are any issues/questions and please enjoy!

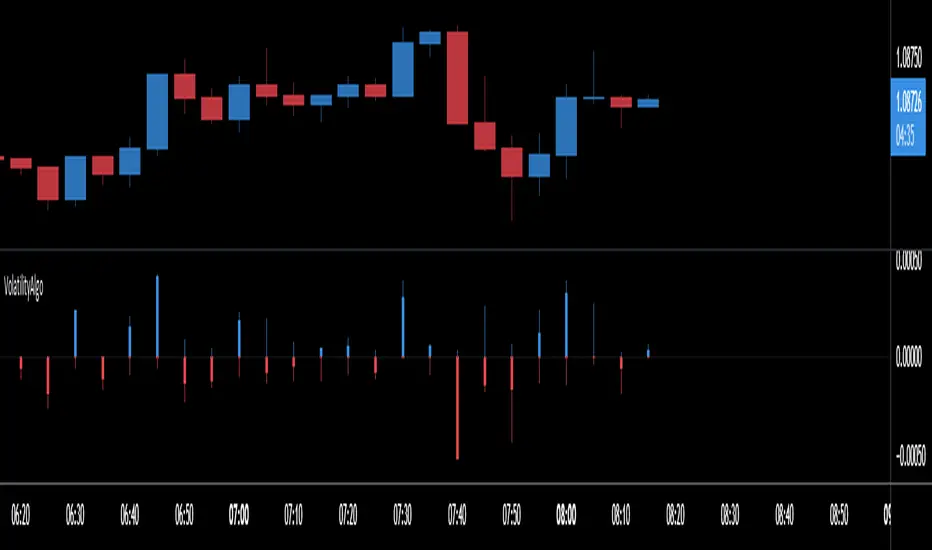
VolatilityAlgoThis indicator allows you to calculate the precise volatility in real time
> Allows analyzing the periods of high/low volatility
> Also to do a technical analysis on the volatility of each bar
> It works with all assets as well as all periods
Here are the different Values:
Upper Volatility Calculation
1 open to close
2 open to high
3 upper shadow
Lower Volatility Calculation
4 open to close
5 open to low
6 lower shadow
Williams Vix Fix ultra complete indicator (Tartigradia)Williams VixFix is a realized volatility indicator developed by Larry Williams, and can help in finding market bottoms.
Indeed, as Williams describe in his paper, markets tend to find the lowest prices during times of highest volatility, which usually accompany times of highest fear. The VixFix is calculated as how much the current low price statistically deviates from the maximum within a given look-back period.
Although the VixFix originally only indicates market bottoms, its inverse may indicate market tops. As masa_crypto writes : "The inverse can be formulated by considering "how much the current high value statistically deviates from the minimum within a given look-back period." This transformation equates Vix_Fix_inverse. This indicator can be used for finding market tops, and therefore, is a good signal for a timing for taking a short position." However, in practice, the Inverse VixFix is much less reliable than the classical VixFix, but is nevertheless a good addition to get some additional context.
For more information on the Vix Fix, which is a strategy published under public domain:
* The VIX Fix, Larry Williams, Active Trader magazine, December 2007, web.archive.org
* Fixing the VIX: An Indicator to Beat Fear, Amber Hestla-Barnhart, Journal of Technical Analysis, March 13, 2015, ssrn.com
* Replicating the CBOE VIX using a synthetic volatility index trading algorithm, Dayne Cary and Gary van Vuuren, Cogent Economics & Finance, Volume 7, 2019, Issue 1, doi.org
Created By ChrisMoody on 12-26-2014...
V3 MAJOR Update on 1-05-2014
tista merged LazyBear's Black Dots filter in 2020:
Extended by Tartigradia in 10-2022:
* Can select a symbol different from current to calculate vixfix, allows to select SP:SPX to mimic the original VIX index.
* Inverse VixFix (from masa_crypto and web.archive.org)
* VixFix OHLC Bars plot
* Price / VixFix Candles plot (Pro Tip: draw trend lines to find good entry/exit points)
* Add ADX filtering, Minimaxis signals, Minimaxis filtering (from samgozman )
* Convert to pinescript v5
* Allow timeframe selection (MTF)
* Skip off days (more accurate reproduction of original VIX)
* Reorganized, cleaned up code, commented out parts, commented out or removed unused code (eg, some of the KC calculations)
* Changed default Bollinger Band settings to reduce false positives in crypto markets.
Set Index symbol to SPX, and index_current = false, and timeframe Weekly, to reproduce the original VIX as close as possible by the VIXFIX (use the Add Symbol option, because you want to plot CBOE:VIX on the same timeframe as the current chart, which may include extended session / weekends). With the Weekly timeframe, off days / extended session days should not change much, but with lower timeframes this is important, because nights and weekends can change how the graph appears and seemingly make them different because of timing misalignment when in reality they are not when properly aligned.

Trend Analysis Index [CC]The Trend Analysis Index was created by Adam White and not to be confused with the Trend Analysis Indicator that I also published. This indicator operates under the same idea but using a completely different calculation to achieve similar results. The idea behind this indicator is for a combination of volatility and trend confirmation. If the indicator is above it's signal line then the stock is very volatile and vice versa. If the stock is currently trending as in above a chosen moving average for example and the indicator falls below the signal line then there is a pretty good chance in a trend reversal. The recommended buy and sell system to use is to pair this indicator with a moving average crossover system which I have included in the script. Buy when the indicator is above it's signal and the shorter moving average crosses above the longer moving average. For selling you would do the same and sell when the indicator is above it's signal and the shorter moving average crosses below the longer moving average. I have included strong buy and sell signals in addition to the normal ones so stronger signals are darker in color and normal signals are lighter in color.
Let me know what other indicators or scripts you would like to see me publish!

Speed IndicatorThe indicator showcases the Speed at which the prices change based on the set length. It does not show trend direction simply because Speed is a scalar quantity. It helps to identify when the prices are racing, slowing down, or in a range.
The formula used for calculation is Speed = Total Distance Travelled / Time.
Time is the period range that can be defined to set the lookback period.
The length is calculated by finding the absolute value of the difference between the current and closing prices one period ago. The lengths are added for the defined Time, and the Total Distance Travelled by the price is calculated. The formula of 'current price' - price 'Time' periods ago is not used, which calculates the displacement of the price used in figuring the velocity .
The Speed is then calculated using the defined formula.
For example, in the last 20 days, a stock price moved a total of 15000 points, then the Speed of the price would be 750 points per day. Therefore the price is expected to be moving around 750 points, either up or down.
There is also an application of the Donchian Channels to the calculated Speed. It helps to define a dynamic range of the Speed and easily visualize if the Speed is increasing, decreasing, or being stable. The range showcases a Speedometer , hence easing the interpretation of the Speed. Speed Range can also be customized for the Donchian channel. The contraction of the channels would occur when the Speed has been steady for some time, which would mean the price has not moved out from its range.
The importance of the indicator is to identify when the prices have slowed down to enter positions safely, since entering positions during higher speeds would be like jumping onto a fast-moving train. Although, it is up to the user's risk appetite if they wish to enter during low speeds or high speeds. The basic strategy is to enter during slow speeds, hold as speed increases, exit as Speed starts to slow down for its highs. That is the basic idea but can be customized as per the user.

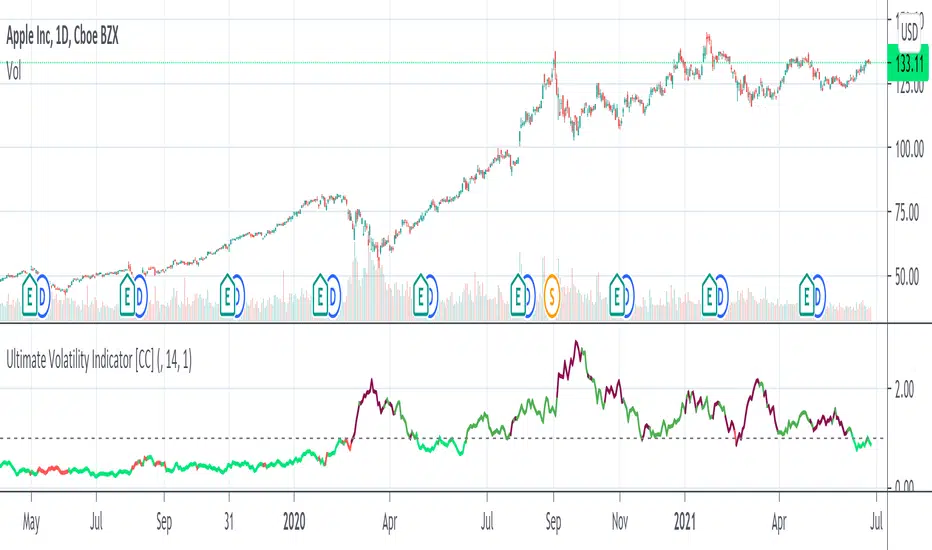
Ultimate Volatility Indicator [CC]The Ultimate Volatility Indicator was created by Richard Poster (Stocks and Commodities July 2021 pg 21) and this is a very simple but effective indicator. The idea behind volatility indicators is that when the indicator rises above a certain threshold then volatility is high enough and you can make a good amount of money riding the trend in the current direction and then exit when volatility drops below the threshold or until the underlying trend changes.
I have included a threshold that you can change from the default but I would recommend trying out different values to see what works best for you. This indicator will let you know as soon as volatility increases and reacts very quickly. I have included strong buy and sell signals in addition to normal ones so darker colors are strong buy and sell signals and lighter colors are normal signals. Buy when the line turns green and sell when it turns red.
Please let me know if you would like to see me publish any other indicators!
Volatility - Sacred GeometryThis indicator is designed to pick up changes in volatility before it happens. It also shows current volatility, as price action drops the blue lines contract. The script uses the blue lines to locate spikes in volatility.
Example of dump revealing itself with plenty of notice.
Here large changes in price action are shown when the white lines spike. Traders can get a heads up on any pump or dump a few candles before it happens.
This example shows a low volatility channel vs high volatility channel. The blue lines expand as price range increases.
Trends can be discovered by studying the patterns.
* This indicator does not use sacred geometry, I just called it that because it looks like it. *
If anyone is interested in developing this indicator any further please get in contact.

Sigma Spikes [CC]Sigma Spikes were created by Adam Grimes and this is one of the best volatility indicators out there. This indicator not only gives you positive or negative volatility but with my version I can identify any sudden changes from the underlying trend. Buy when the line turns green and sell when it turns red.
Let me know if there were any other indicators you wanted to see me publish!
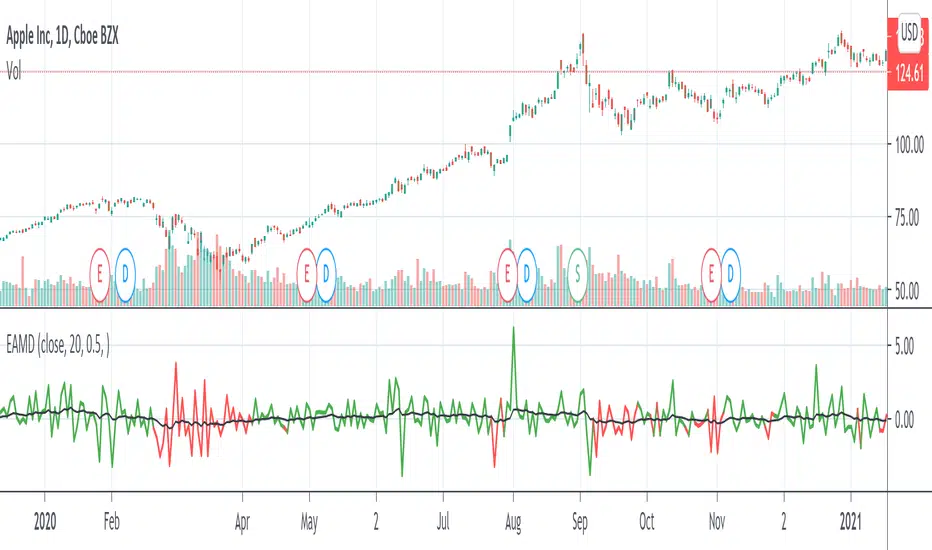
Ehlers AM Detector [CC]The AM Detector was created by John Ehlers (Stocks and Commodities May 2021 pg 14) and this is his first volatility indicator I believe. Since this is a more informational indicator rather than a buy or sell signal generator, I have included buy and sell signals for a simple moving average but feel free to use this in combo with any other system you use. Buy when the line turns green and sell when it turns red.
Let me know if there are any other indicators you would like to see me publish!

Historical Volatility Percentile + SMAHistorical Volatility Percentile tells you the percentage of the days from the past year (252 trading days) that have lower volatility than the current volatility.
I included a simple moving average as a signal line to show you how volatile the stock is at the moment.
I have included simple colors to let you know when to enter or exit a position.
Buy when price higher than EMA & historical volatility higher than SMA
Sell when price lower than EMA & historical volatility higher than SMA
Please let me know if you would like me to publish any other indicators! I always love to hear from you guys.

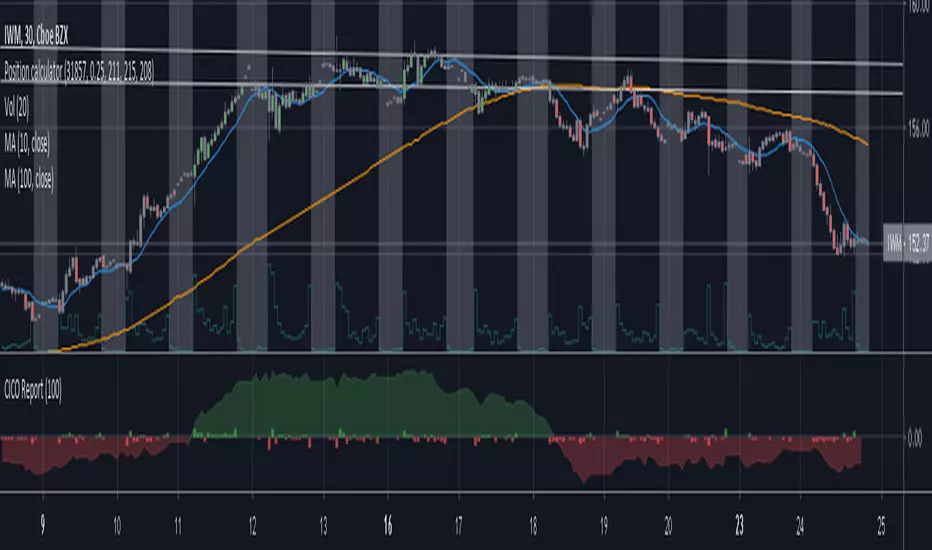
Cash in/Cash out Report (CICO) - Quiets market noiseThe cash in/cash out report (CICO for short) was built with the intent to quiet the market noise. The blunt way to say it, this indicator quiets the market manipulators voice and helps the retail investor make more money. I believe money is better of in the 99% hands versus the greedy hoarding that is currently going on. There are dozens of companies in the SP500 that have the same tax rate as unborn babies, nada. These hoarders also have machine learning high frequency trading bots that purposely create fear and anxiety in the markets. When all of the major markets move at the exact same time of day on frequent occasions, I see red flags. I recommend looking into Authorized participants in the ETF market to understand how the markets can be manipulated, specifically Creation and Redemption.
Enough of my rant. This indicator is open source. Directions on how to use the indicator can be found within the code. The basic summary is, clear your charts to bare minimums. Make the colors gray on all candles. Then apply this indicator. The indicator will color the "buy" and "sell" signals on the chart. Keep in mind, markets are manipulated to create fear in the retail investors little heart and can change drastically at any second. This indicator will show real time changes in running sum into and out of the market, it is estimated by average prices and not exact.
Once the chart is all greyed out and the indicator is applied you will see an area colored red and green. What this indicator does is takes a running sum of the new money into and out of the market. It takes the average of the high and low price times the volume. If the price is going up the value is positive, going down will be negative. Then the running sum is displayed. The area section is the running sum and the column bars are each value. When a market is steadily increasing in value you will see the large green area grow. When markets shift, values and display will change in color and vector. Full descriptions are available within the script in the comment sections.
I hope this help you make more money. If this helps you grow profits, give it a like!
Happy investing 99%er!


Volatile Stocks - Simple Strategy w/Profit and StopThis strategy is based off of a script I wrote for another highly volatile asset, cryptocurrencies. It prints BUY and SELL signals based off of inputs that you can specify. I used this script as a time saver. If there is no signal on the chart, I'm less interested in analyzing it.
BUY SIGNALS
Bullish EMA Cross
Positive MACD Cross
Single-candle gains
SELL SIGNALS
Profit %
Stop Loss %
Naturally, I don't trade based off of the BUY and SELL signals alone, but it does help me identify the most important charts to look at.

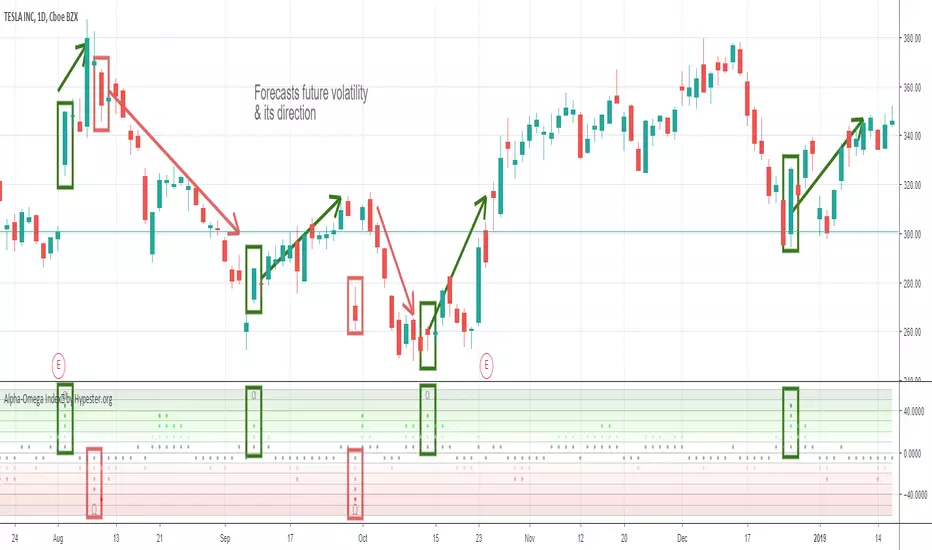
Specter Alpha-Omega Volatility Index™Meet the Alpha-Omega Volatility custom indicator by Specter
This premium volatility indicator uses a series of models to compare historical volatility, and by using a series of noise reduction techniques, it only gives you the very best signals. This indicator shows you aggressive reversals, which are often the most profitable.
The customization options already come with pre-sets, and it's as simple as one click. It comes with Aggressive, Moderate, Conservative and Ultra Conservative behaviors filters.
Also, it offers an interest zone indicator so you can start paying attention to the chart before it happens when trading extra volatile stocks timing is crucial and you want to be ready before the action begins.
The way you use it is pretty simple, you look for divergences. When you have a bullish movement, and you see high negative volatility appearing in the Alpha-Omega indicator, it means a strong reversal/spike is coming. The same goes for bearish reversals, just the opposite logic. You also get an extra layer of confirmation which is the Alpha/Omega characters; they only appear with the most robust volatility prediction. It's up to your trading strategy to decide how conservative you are and which signals you will follow.
It works on any market/security/asset/timeframe.
Ready to ride some spikes?
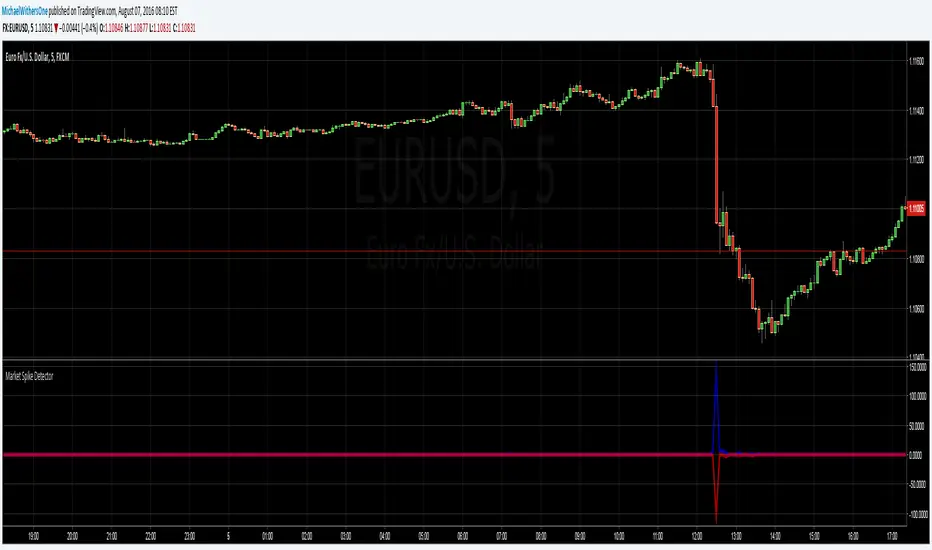
Seismic Market Spike Detector v1.0 Seismic Market Spike Detector v1.0
This indicator helps identify spikes in market activity , typified by bars with extreme open / close or high / low prices.
This indicator plots 2 lines. The Blue line simply depicts extreme price movements with in that bar regardless of the initial opening price of the closing price of the bar. This allows you to get an insight into the current volatility of the price at that time in the market. Quite often big price swings with in bars are missed as people pend to tunnel vision on the open or close price - or other indicators derived from open / close.
The Red line is similar to the blue bar as it depicts extreme price movements with in the bar , but it will show the direction the market moved in by the close of the bar - and relatively how much the market moved. This is helpful for spotting breakout price action or short term spikes. Quite often after a breakout the market will restore itself to an equilibrium in the opposite direction. Sometimes this happens with an opposing aggressive spike , some times it makes a steady return to a known price level. Either way its a great time to place entry orders if you are looking to turn a fast profit or alternatively a good warning of forth coming price volatility.
Here are some tips for analysing the red and blue lines :
1)If the red line is pointing upwards , this indicates a sharp rise in the price.
2)If the red line is pointing downwards , this indicates a sharp fall in the price.
3)If the red line is flat but the blue line is spiked in either direction - this indicates the price was volatile with in the bar , but the price closed relatively near to the surrounding price bars. Perhaps a limit / stop triggered by this kind of activity - this is an easy way to determine why and re-enter.
4)If the red and the blue lines are flat - the price is steadily moving with a trend or trading sideways in a confined range.
Chauvenet RadiusThe Chauvenet criterion is a well-known criterion of selection and rejection of the data used by the Physics. It establishes that in an experiment is well to discard the data whose distance from the average is greater than a certain number of the delta.
In the stock market if prices move away from the average with a volatility too high are suspect. This principle is embodied in the Chauvenet floor with the definition of two asymptotes and two data areas rejection.
The Chauvenet Radius is the quadratic sum of the delta (distance from average) and sigmoid (volatility) and is therefore an obvious market stability index. In fact the moments when price strongly moves away from the average with high volatility coincide with the moments of high instability of the market.
It can be considered an evolution of John Bollinger method introduced during the '80.
Source: www.performancetrading.it