Volume-analysis

POC Migration Velocity (POC-MV) [PhenLabs]📊POC Migration Velocity (POC-MV)
Version: PineScript™v6
📌Description
The POC Migration Velocity indicator revolutionizes market structure analysis by tracking the movement, speed, and acceleration of Point of Control (POC) levels in real-time. This tool combines sophisticated volume distribution estimation with velocity calculations to reveal hidden market dynamics that conventional indicators miss.
POC-MV provides traders with unprecedented insight into volume-based price movement patterns, enabling the early identification of continuation and exhaustion signals before they become apparent to the broader market. By measuring how quickly and consistently the POC migrates across price levels, traders gain early warning signals for significant market shifts and can position themselves advantageously.
The indicator employs advanced algorithms to estimate intra-bar volume distribution without requiring lower timeframe data, making it accessible across all chart timeframes while maintaining sophisticated analytical capabilities.
🚀Points of Innovation
Micro-POC calculation using advanced OHLC-based volume distribution estimation
Real-time velocity and acceleration tracking normalized by ATR for cross-market consistency
Persistence scoring system that quantifies directional consistency over multiple periods
Multi-signal detection combining continuation patterns, exhaustion signals, and gap alerts
Dynamic color-coded visualization system with intensity-based feedback
Comprehensive customization options for resolution, periods, and thresholds
🔧Core Components
POC Calculation Engine: Estimates volume distribution within each bar using configurable price bands and sophisticated weighting algorithms
Velocity Measurement System: Tracks the rate of POC movement over customizable lookback periods with ATR normalization
Acceleration Calculator: Measures the rate of change of velocity to identify momentum shifts in POC migration
Persistence Analyzer: Quantifies how consistently POC moves in the same direction using exponential weighting
Signal Detection Framework: Combines trend analysis, velocity thresholds, and persistence requirements for signal generation
Visual Rendering System: Provides dynamic color-coded lines and heat ribbons based on velocity and price-POC relationships
🔥Key Features
Real-time POC calculation with 10-100 configurable price bands for optimal precision
Velocity tracking with customizable lookback periods from 5 to 50 bars
Acceleration measurement for detecting momentum changes in POC movement
Persistence scoring to validate signal strength and filter false signals
Dynamic visual feedback with blue/orange color scheme indicating bullish/bearish conditions
Comprehensive alert system for continuation patterns, exhaustion signals, and POC gaps
Adjustable information table displaying real-time metrics and current signals
Heat ribbon visualization showing price-POC relationship intensity
Multiple threshold settings for customizing signal sensitivity
Export capability for use with separate panel indicators
🎨Visualization
POC Connecting Lines: Color-coded lines showing POC levels with intensity based on velocity magnitude
Heat Ribbon: Dynamic colored ribbon around price showing POC-price basis intensity
Signal Markers: Clear exhaustion top/bottom signals with labeled shapes
Information Table: Real-time display of POC value, velocity, acceleration, basis, persistence, and current signal status
Color Gradients: Blue gradients for bullish conditions, orange gradients for bearish conditions
📖Usage Guidelines
POC Calculation Settings
POC Resolution (Price Bands): Default 20, Range 10-100. Controls the number of price bands used to estimate volume distribution within each bar
Volume Weight Factor: Default 0.7, Range 0.1-1.0. Adjusts the influence of volume in POC calculation
POC Smoothing: Default 3, Range 1-10. EMA smoothing period applied to the calculated POC to reduce noise
Velocity Settings
Velocity Lookback Period: Default 14, Range 5-50. Number of bars used to calculate POC velocity
Acceleration Period: Default 7, Range 3-20. Period for calculating POC acceleration
Velocity Significance Threshold: Default 0.5, Range 0.1-2.0. Minimum normalized velocity for continuation signals
Persistence Settings
Persistence Lookback: Default 5, Range 3-20. Number of bars examined for persistence score calculation
Persistence Threshold: Default 0.7, Range 0.5-1.0. Minimum persistence score required for continuation signals
Visual Settings
Show POC Connecting Lines: Toggle display of colored lines connecting POC levels
Show Heat Ribbon: Toggle display of colored ribbon showing POC-price relationship
Ribbon Transparency: Default 70, Range 0-100. Controls transparency level of heat ribbon
Alert Settings
Enable Continuation Alerts: Toggle alerts for continuation pattern detection
Enable Exhaustion Alerts: Toggle alerts for exhaustion pattern detection
Enable POC Gap Alerts: Toggle alerts for significant POC gaps
Gap Threshold: Default 2.0 ATR, Range 0.5-5.0. Minimum gap size to trigger alerts
✅Best Use Cases
Identifying trend continuation opportunities when POC velocity aligns with price direction
Spotting potential reversal points through exhaustion pattern detection
Confirming breakout validity by monitoring POC gap behavior
Adding volume-based context to traditional technical analysis
Managing position sizing based on POC-price basis strength
⚠️Limitations
POC calculations are estimations based on OHLC data, not true tick-by-tick volume distribution
Effectiveness may vary in low-volume or highly volatile market conditions
Requires complementary analysis tools for complete trading decisions
Signal frequency may be lower in ranging markets compared to trending conditions
Performance optimization needed for very short timeframes below 1-minute
💡What Makes This Unique
Advanced Estimation Algorithm: Sophisticated method for calculating POC without requiring lower timeframe data
Velocity-Based Analysis: Focus on POC movement dynamics rather than static levels
Comprehensive Signal Framework: Integration of continuation, exhaustion, and gap detection in one indicator
Dynamic Visual Feedback: Intensity-based color coding that adapts to market conditions
Persistence Validation: Unique scoring system to filter signals based on directional consistency
🔬How It Works
Volume Distribution Estimation:
Divides each bar into configurable price bands for volume analysis
Applies sophisticated weighting based on OHLC relationships and proximity to close
Identifies the price level with maximum estimated volume as the POC
Velocity and Acceleration Calculation:
Measures POC rate of change over specified lookback periods
Normalizes values using ATR for consistent cross-market performance
Calculates acceleration as the rate of change of velocity
Signal Generation Process:
Combines trend direction analysis using EMA crossovers
Applies velocity and persistence thresholds to filter signals
Generates continuation, exhaustion, and gap alerts based on specific criteria
💡Note:
This indicator provides estimated POC calculations based on available OHLC data and should be used in conjunction with other analysis methods. The velocity-based approach offers unique insights into market structure dynamics but requires proper risk management and complementary analysis for optimal trading decisions.

TVMC - Composite Indicator with Technical RatingsDescription:
The TVMC (Trend, Volume, Momentum, Composite) indicator is a powerful multi-component tool designed to provide traders with a comprehensive understanding of market conditions. By combining four essential technical analysis components—trend, momentum, volume, and volatility—this indicator offers clear and actionable insights to assist in decision-making.
Key Features:
1. Trend Component (TC):
* Based on MACD (Moving Average Convergence Divergence), this component analyzes the relationship between two exponential moving averages (fast and slow) to determine the prevailing market trend.
* The MACD signal is normalized to a range of -1 to +1 for consistency and clarity.
2. Momentum Component (MC):
* Utilizes RSI (Relative Strength Index) to measure the strength and speed of price movements.
* This component highlights overbought or oversold conditions, which may indicate potential market reversals.
3. Volume Confirmation (VC):
* Compares the current trading volume to its moving average over a specified period.
* High volume relative to the average confirms the validity of the current trend.
4. Volatility Filter (VF):
* Uses ATR (Average True Range) to gauge market volatility.
* Adjusts and smooths signals to reduce noise during periods of high volatility.
5. Technical Ratings Integration:
* Incorporates TradingView’s Technical Ratings, allowing users to validate signals using moving averages, oscillators, or a combination of both.
* Users can choose their preferred source of ratings for enhanced signal confirmation.
How It Works:
The TVMC indicator combines the weighted contributions of the Trend, Momentum, and Volume components, further refined by the Volatility Filter. Each component plays a specific role:
* Trend: Identifies whether the market is bullish, bearish, or neutral.
* Momentum: Highlights the strength of price action.
* Volume: Confirms whether the current price action is supported by sufficient trading activity.
* Volatility: Filters out excessive noise in volatile market conditions, providing a smoother and more reliable output.
Visualization:
1. Bullish Signals:
* The indicator line turns green and remains above the zero line, indicating upward momentum.
2. Bearish Signals:
* The indicator line turns red and falls below the zero line, signaling downward momentum.
3. Neutral Signals:
* The line is orange and stays near zero, indicating a lack of strong trend or momentum.
4. Zones:
* Horizontal lines at +30 and -30 mark strong bullish and bearish zones, respectively.
* A zero line is included for clear separation between bullish and bearish signals.
Recommended Usage:
* Best Timeframes: The indicator is optimized for higher timeframes such as 4-hour (H4) and daily (D1) charts.
* Trading Style: Suitable for swing and positional trading.
* Customization: The indicator allows users to adjust all major parameters (e.g., MACD, RSI, volume, and ATR settings) to fit their trading preferences.
Customization Options:
* Adjustable weights for Trend, Momentum, and Volume components.
* Fully configurable settings for MACD, RSI, Volume SMA, and ATR periods.
* Timeframe selection for multi-timeframe analysis.
Important Notes:
1. Originality: The TVMC indicator combines multiple analysis methods into a unique framework. It does not replicate or minimally modify existing indicators.
2. Transparency: The description is detailed enough for users to understand the methodology without requiring access to the code.
3. Clarity: The indicator is explained in a way that is accessible even to users unfamiliar with complex technical analysis tools.
Compliance with TradingView Rules:
* The indicator is written in Pine Script version 5, adhering to TradingView’s language standards.
* The description is written in English to ensure accessibility to the global community, with a clear explanation of all components and functionality.
* No promotional content, links, or unrelated references are included.
* The chart accompanying the indicator is clean and demonstrates its intended use clearly, with no additional indicators unless explicitly explained.

Enhanced Cumulative Volume Delta + MAThe Enhanced Cumulative Volume Delta (CVD) indicator is designed to help traders analyze the cumulative buying and selling pressure in the market by examining the delta between the up and down volume. By tracking this metric, traders can gain insights into the strength of a trend and potential reversals. This indicator uses advanced volume analysis combined with customizable moving averages to provide a more detailed view of market dynamics.
How to Use This Indicator:
Volume Delta Visualization:
The indicator plots the cumulative volume delta (CVD) using color-coded candles, where teal represents positive delta (buying pressure) and soft red represents negative delta (selling pressure).
Moving Averages:
Use the moving averages to smooth the CVD data and identify long-term trends. You can choose between SMA and EMA for each of the three available moving averages. The first and third moving averages are typically used for short-term and long-term trend analysis, respectively, while the second moving average can serve as a medium-term filter.
Arrow Markers:
The indicator will display arrows (green triangle up for crossing above, red triangle down for crossing below) when the CVD volume crosses the 3rd moving average. You can control the visibility of these arrows through the input parameters.
Volume Data:
The indicator provides error handling in case no volume data is available for the selected symbol, ensuring that you're not misled by incomplete data.
Practical Applications:
Trend Confirmation: Use the CVD and moving averages to confirm the overall trend direction and strength. Positive delta and a rising CVD can confirm an uptrend, while negative delta and a falling CVD indicate a downtrend.
Volume Breakouts: The arrows marking when the CVD crosses the 3rd moving average can help you spot potential volume breakouts or reversals, making them useful for entry or exit signals.
Volume Divergence: Pay attention to divergences between price and CVD, as these can often signal potential trend reversals or weakening momentum.

Relative Volume Index [PhenLabs]Relative Volume Index (RVI)
Version: PineScript™ v6
Description
The Relative Volume Index (RVI) is a sophisticated volume analysis indicator that compares real-time trading volume against historical averages for specific time periods. By analyzing volume patterns and statistical deviations, it helps traders identify unusual market activity and potential trading opportunities. The indicator uses dynamic color visualization and statistical overlays to provide clear, actionable volume analysis.
Components
• Volume Comparison: Real-time volume relative to historical averages
• Statistical Bands: Upper and lower deviation bands showing volume volatility
• Moving Average Line: Smoothed trend of relative volume
• Color Gradient Display: Visual representation of volume strength
• Statistics Dashboard: Real-time metrics and calculations
Usage Guidelines
Volume Strength Analysis:
• Values > 1.0 indicate above-average volume
• Values < 1.0 indicate below-average volume
• Watch for readings above the threshold (default 6.5x) for exceptional volume
Trading Signals:
• Strong volume confirms price moves
• Divergences between price and volume suggest potential reversals
• Use extreme readings as potential reversal signals
Optimal Settings:
• Start with default 15-bar lookback for general analysis
• Adjust threshold (6.5x) based on market volatility
• Use with multiple timeframes for confirmation
Best Practices:
• Combine with price action and other indicators
• Monitor deviation bands for volatility expansion
• Use the statistics panel for precise readings
• Pay attention to color gradients for quick assessment
Limitations
• Requires quality volume data for accurate calculations
• May produce false signals during pre/post market hours
• Historical comparisons may be skewed during unusual market conditions
• Best suited for liquid markets with consistent volume patterns
Note: For optimal results, use in conjunction with price action analysis and other technical indicators. The indicator performs best during regular market hours on liquid instruments.

Advanced Volume-Driven Breakout SignalsThe "Advanced Volume-Driven Breakout Signals" indicator is a cutting-edge tool designed to help traders identify high-potential trading opportunities through sophisticated volume analysis techniques. This indicator integrates volume flow analysis, moving averages, and Relative Volume (RVOL) to provide a comprehensive view of market conditions, going beyond traditional Volume Spread Analysis (VSA) methods.
Key Features:
Volume Flow Analysis: Distinguishes bullish and bearish volume flows with distinct colors, making it easier to visualize market sentiment and potential breakout points.
Volume Flow Moving Averages: Calculates moving averages for volume using various methods (SMA, EMA, WMA, HMA, VWMA), accommodating different trading strategies. This includes settings for adjusting the type of moving average and its period, as well as thresholds for high, medium, and low volume levels.
Volume Spikes Detection: Identifies significant volume spikes based on user-defined multipliers and moving averages, highlighting unusual trading activity.
Volume MA Cloud Settings: Computes general moving averages of volume to track trends and detect deviations. This feature includes options to select different moving average types and adjust thresholds for detecting high volume activity.
Relative Volume (RVOL): Measures current volume relative to historical averages, triggering signals when RVOL exceeds predefined thresholds, indicating notable changes in trading activity.
Entry Conditions: Provides clear long and short entry signals based on combined volume flow conditions and RVOL, offering actionable trading opportunities.
Volume Visualization:
— Bullish Volume Flow: Light and dark green bars indicate bullish volume flow.
— Bearish Volume Flow: Light and dark red bars denote bearish volume flow.
— High Volume Bars: Highlighted in yellow, and extreme volume bars in orange for additional context. These bars are plotted for visual aid and do not directly influence trade signals, focusing instead on the quality and strength of the volume flow.
Alerts: Allows users to create alert notifications for long and short entry signals when the criteria are met, enabling traders to respond promptly to trading opportunities.
Usage:
Overlay: Apply the indicator directly to your price chart to visualise real-time signals and volume conditions.
Customisable: Adjust settings for moving averages, RVOL, and other parameters to match your trading strategy and preferences.
Comparison to VSA Scripts: The "Advanced Volume-Driven Breakout Signals" indicator extends beyond traditional VSA scripts by incorporating a wider range of analytical features. While VSA primarily focuses on volume spread patterns and price action, this indicator offers enhanced functionality with advanced RVOL metrics, customizable moving averages, and detailed volume spike detection, making it a more versatile tool for identifying breakout opportunities and managing trades. It is particularly effective when used alongside key levels and order blocks.
Acknowledgements: Special thanks to @oh92 and @goofoffgoose for their invaluable scripts, which served as inspiration in the development of this advanced trading indicator.
Notes: The script is continually evolving, with ongoing refinements aimed at enhancing accuracy and performance.

Lower Timeframe Volume BarsDescription:
The Lower Timeframe Volume Bars indicator enhances your TradingView experience by allowing you to visualize volume data from lower timeframes on your current chart. This powerful tool helps you gain deeper insights into volume trends and activity that are not immediately visible on higher timeframe charts. Specifically, it shows the volume data from the last bar of the selected lower timeframe.
Key Features:
Volume Bars from Lower Timeframes:
Display volume data from 1-minute or 1-second timeframes directly on higher timeframe charts, such as 15 minutes or 1 hour.
Each volume bar represents the aggregated volume from the lower timeframe within the selected higher timeframe period.
Enhanced Volume Analysis:
Gain a more detailed understanding of volume spikes and troughs that may be hidden in higher timeframe charts.
Identify potential market turning points and confirm trends with precise volume data.
Customizable Display:
Adjust the appearance of volume bars to fit your chart style and preferences.
Configure settings such as color, size, and positioning of volume bars for optimal visibility and clarity.
Seamless Integration:
Easily add the indicator to any chart in TradingView with a few clicks.
Works in conjunction with other technical indicators and tools to provide a comprehensive analysis environment.
How to Use:
Add the Lower Timeframe Volume Bars indicator to your chart.
Select the lower timeframe you wish to fetch volume data from (e.g., 1-minute or 1-second).
Customize the display settings to match your charting style.
Observe the volume bars overlaying your current chart to analyze volume activity across different timeframes, specifically showing the last bar's volume.
Use the detailed volume information to make informed trading decisions and enhance your market analysis.
Benefits:
Increased Clarity: See detailed volume activity that is often lost in higher timeframe aggregation.
Better Decision Making: Make more informed trading decisions with a clear view of volume trends and spikes.
Improved Trend Confirmation: Use lower timeframe volume data to confirm the strength and sustainability of market trends.
Enhance your trading strategy and gain a deeper understanding of market dynamics with the Lower Timeframe Volume Bars indicator. Visualize, analyze, and trade with confidence by leveraging detailed volume insights from lower timeframes.

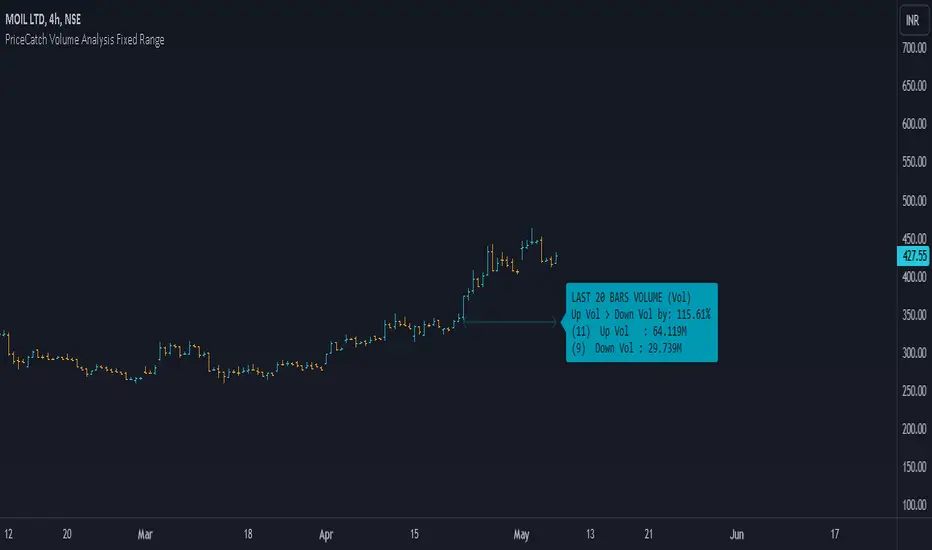
PriceCatch Volume Analysis Fixed RangeHi TV Community.
It's been sometime since I published any script / utility. But today, I am back with a new script.
Volume Analysis
Studying volume when in trade or before taking one is very important as seasoned traders would tell you. So, this script helps you to look at volume over a specific interval from current bar. You will have to set the look-back period in the settings dialog.
The script will then show over that period :
Number of Up and Down bars
Volume Ratio of Up Volume over Down Volume
Actual Up and Down Volume
Percentage of Up Volume to Down Volume
I use this information in all my trades and hope that you will also find this Script useful.
To my knowledge, I have not seen another volume analysis script that helps see volume in the way this script does.
NOTE:
This script does not give any buy or sell signal if that is what you are looking for. But if you see that Up Volume is 3 times Down Volume, then that should mean something to you. So also when price is slipping down.
Disclaimer
I am sharing this Script without any warranties as to its usability. Use it only if you like it. As always when it comes to trading you and you alone are responsible for your actions.
All the best with your trades.
PriceCatch
MonkeyblackmailThis script consists of several sections. test it and tell me your concerns. a lot of more works will be done
Volume Accumulation : The first part of the script checks for a new 5-minute interval and accumulates the volume of the current interval. It separates the volume into buying volume and selling volume based on whether the closing price is closer to the high or low of the bar.
Volume Normalization and Pressure Calculation : The script then normalizes the volume with a 20-period EMA, and calculates buying pressure, selling pressure, and total pressure. These calculations provide insight into the underlying demand (buying pressure) and supply (selling pressure) conditions in the market.
RSI Calculation and Overbought/Oversold Conditions : The script calculates the RSI (Relative Strength Index) and checks whether it is in an overbought (RSI > 70) or oversold (RSI < 30) state. The RSI is a momentum indicator, providing insights into the speed and change of price movements.
Volume Condition Check and Wondertrend Indicator : The script checks if the volume is high for the past five bars. If it is, it applies the Wondertrend Indicator, which uses a combination of the Parabolic SAR (Stop and Reverse) and Keltner Channel to identify potential trends in the market.
Swing High/Low and Fibonacci Retracement : The script identifies swing high and swing low points using a specified pivot length. Then, it draws Fibonacci retracement levels between these swing high and swing low points.
he monkeyblackmail script works well in the 5 minutes chart and combines several elements of technical analysis, including volume analysis, momentum indicators, trend-following indicators, volatility channels, and Fibonacci retracements. It aims to provide a comprehensive view of the market condition, highlighting key levels and potential trends in an easily understandable format. Don’t be too quick to start trading with it, first study how it work and you will blackmail the market.

Volume Pressure AnalysisVolume Pressure Analysis is a new concept I have been working on designed to show the effort required to move price. An ideal tool for confirming trends or locating reversals early. This indicator can highlight whale action and market manipulation. It calculates volume vs volatility and displays the results as a meter:
Above 0 shows how easy price action is traveling, the bigger these bars the less volume and effort is required to push price. These are indicated with a teal or red arrows and can confirm the beginning or continuation of a trend. This is the natural direction the chart wants to travel at that time.
Below 0 shows how hard price is to move. The bigger these bars the more volume and effort is required to push price. When whales and market makers push price against its will these bars will get bigger.
Yellow arrows signal pressure in that direction and excessive amounts of volume is required to move price. These signals can lead to reversal/ pivot points as price action struggles to continue its trend. These signals can be turned on in settings or use the overlay version of this script to display signals on chart. This is a very powerful tool when used with relative volume.

Volume Pressure Analysis - OverlayVolume Pressure Analysis is designed to show effort required to move price. This script is the overlay version that displays signals on the candles as well as changes the bar colors. Yellow arrows signal pressure in that direction and excessive amounts of volume is required to move price. These signals can lead to reversal/pivot points as price action struggles to continue its trend. Red and teal arrows indicate free flowing price action where very little effort or volume is needed to push price. These signals can confirm the beginning or continuation of a trend and is the natural direction the chart wants to travel at that time. For more information please check out the main Volume Pressure Analysis indicator.

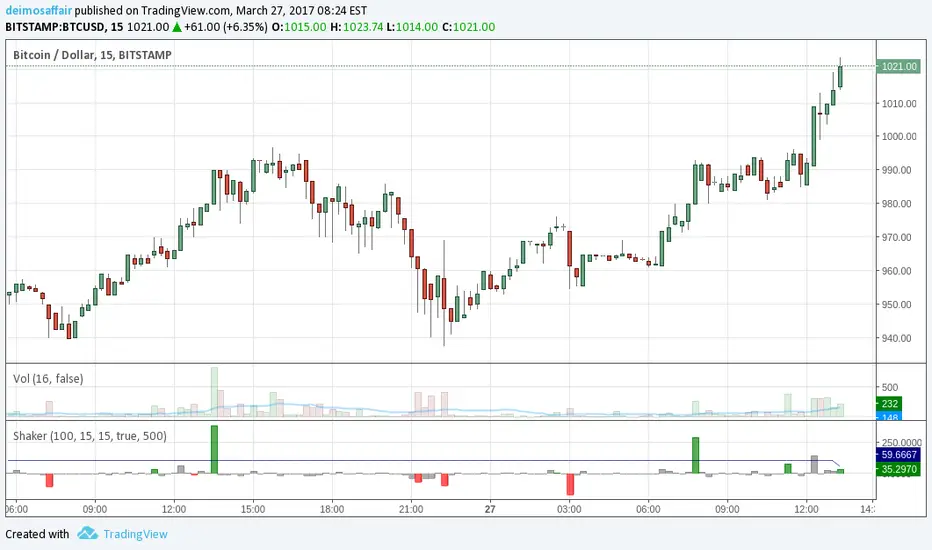
Cooltoyz: market shaker v1.0Panicking over a big ass candle? wondering what's happening on a flat market? Despair no more, this indicator could help with that :)
The market Shaker calculates the price differences, and weights them with the volume used for the move. This volume is not the plain value, but a measure of the past X volume candles.
Examples:
price moves 3%, but with a volume of only ~80% of last candles. looks like weak move
price moves 0.4%, but the volume was a massive 220% bigger than last candles. something happened, even if the market absorbed it all, better pay attention.
in each case, the shaker indicator makes the calculated value bigger/smaller to account for the volume weight of the move.
It's also i real time, the current candle weight is considered on how much time it remains to close. Example, on the 1H chart, if the last candle is 45min to close, the values for the volume are weighted to 25%, since is only 15min "old", while all the other candles are 1h, so the candle is only 25% of it's time to close.
The indicator options has the arguments required to tune the indicator, the candles minutes must match the chart, or the results go crazy.