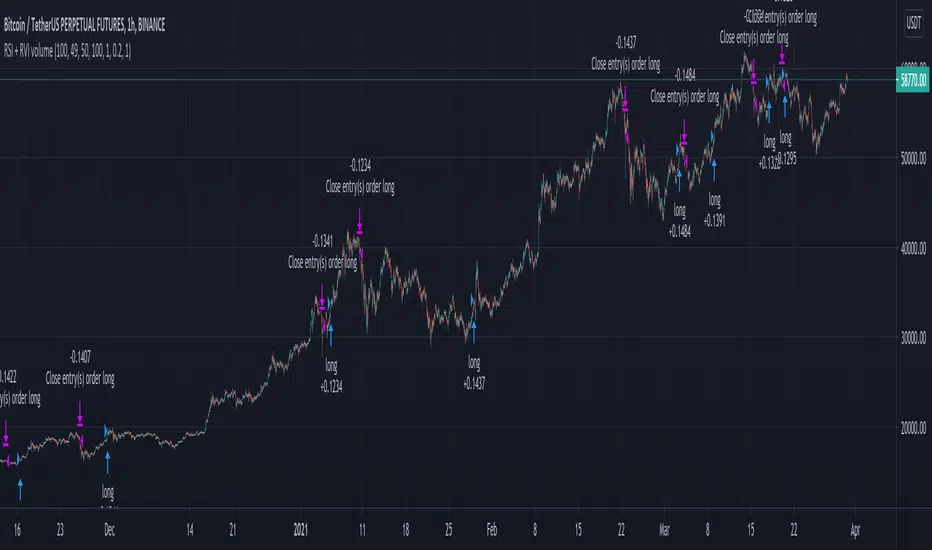
RSI and RVI on volume crypto BTC This strategy combine special version of RSI and RVI , where in this case , I am using the volume , for measuring the speed and change of volume to the price both up and down size together with the volatility spikes.
In this case instead of looking at the volume or volatility, I am combining them into one oscillator.
For best usage, I believe a big length of candles like 100 can get better results, and use it in this way as a lagging indicator.
Since most of the tests I made for futures, I applied a risk management in % of the price movement. For stop loss we have 20% while for TP, 100%. However in both cases, we will exit sooner, and thats going to be when condition from the oscillator says so.
For this we have a middle level, 50, which will act as both overbought and oversold areas.
At the same time I apply the posibility of using leverage into size calculations for more precise tests and try to get min-max out of it.
If you have any questions, please let me know !
Volum
Volume RSI Crypto This is a special version RSI, in this case , I am using the volume, which is measuring the speed and change of volume to the price both up and down size.
Volume RSI attempts to gauge price trend changes via changes in bullish and bearish movements.
Its formula is :
VoRSI = 100 - 100 / (1 + VoRS)
where VoRS is Volume Relative Strength over specified period which is calculated as a ratio between averages of Up-Volumes and Down-Volumes:
VoRS = (Average Up-Volume) / (Average Down-Volume)
The logic for this strategy is simple
We entry long when we have a crossover with the Overbought level and we entry short when we have a crossunder with oversold level.
If you have any questions, please let me knw !

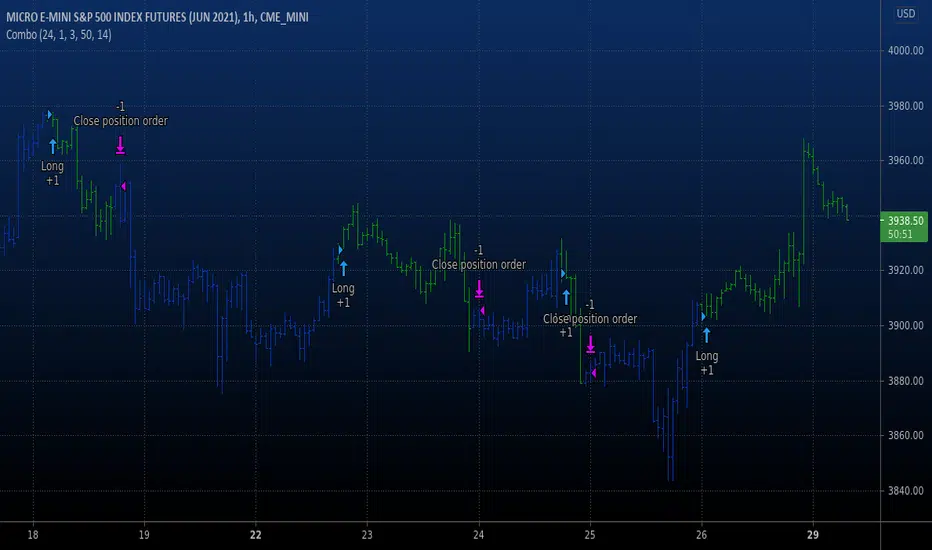
Combo Backtest 123 Negative Volume Index This is combo strategies for get a cumulative signal.
First strategy
This System was created from the Book "How I Tripled My Money In The
Futures Market" by Ulf Jensen, Page 183. This is reverse type of strategies.
The strategy buys at market, if close price is higher than the previous close
during 2 days and the meaning of 9-days Stochastic Slow Oscillator is lower than 50.
The strategy sells at market, if close price is lower than the previous close price
during 2 days and the meaning of 9-days Stochastic Fast Oscillator is higher than 50.
Second strategy
The theory behind the indexes is as follows: On days of increasing
volume, you can expect prices to increase, and on days of decreasing
volume, you can expect prices to decrease. This goes with the idea of
the market being in-gear and out-of-gear. Both PVI and NVI work in similar
fashions: Both are a running cumulative of values, which means you either
keep adding or subtracting price rate of change each day to the previous day`s
sum. In the case of PVI, if today`s volume is less than yesterday`s, don`t add
anything; if today`s volume is greater, then add today`s price rate of change.
For NVI, add today`s price rate of change only if today`s volume is less than
yesterday`s.
WARNING:
- For purpose educate only
- This script to change bars colors.
Strategy NNFX Tester Strategy NNFX, Baseline, QQEs Fast C1, Slow C2, ATR, Volume and Exit
This is a Strategy Tester designed to work with Study (Alerts) of the same.
At time of creation based on Revision 8 of the Study.
DO NOT USE the Currency/Money Management section under settings. use the position sizing under "Inputs" - "Money Management" - "Risk per trade" which is defaulted to 2%
This has adjustable Baselines, Exits, ATR calculations, C1 and C2 are currently QQE & QQE Histo with adjustable settings but I'll include more choice of C1 & C2 as time goes on.
Find settings that work for you, then move them over to the Study version for best results.
Forward plans are to add much more options to both Alert/Strategy.
If anyone wants to collaborate or anything hit me up.

dEMA w/ VWAP filterBuy when EMA is below VWAP and starts sloping up
Sell when EMA is above VWAP and starts sloping down

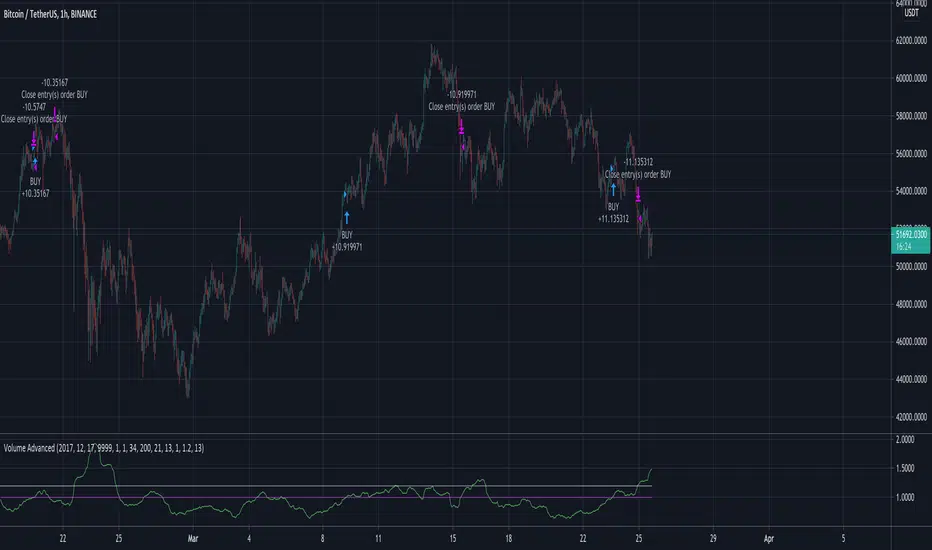
Volume AdvancedI have found out this script some time ago. In fact it is not my code (just have modified a little) and I don't know the author (couldn't find). So now I would like to share with the community, maybe somebody would have some idea how to make it better. The script itself is modified volatility oscillator (like ATR) based on volume, making a deal at the moment of price change. To recognize the current trend I have add simple function just to compare the current price with the N bars before, because sometimes in moments of high volatility there may be wrong signals.
Zeta Bank Nifty & Nifty50The Problems of Day Trading
Lot many indicators are made by thousands of traders all over the world, which give good or not so good signals.
Despite good signals, many times we end up in loss because we could not take entry or could not exit at appropriate time-point.
Sometimes even winning position also comes into loss if market takes back whatever you gained till a certain point.
Also, there are professional, office going people who can not take trades on their own during office-hours.
To solve all these problems, you need an automated strategy which could take trades, trail your stop loss up and exit when stop loss gets hit.
Strategy also lets you know how a certain formula performed over a period of time.
How this strategy works?
The strategy generates trades with 02 type of formulas:
1. It seeks price breaking away from support/resistance (up or down) which is calculated with the help of automatically detected pivot points.
2. It seeks reversal based upon RSI and Price Action.
If there are no open positions right now and a Buy/Sell signal comes, 1 lot is bought or sold.
This position is closed when either Stop Loss gets hit or when opposite signal comes.
What are other features of the strategy
1. You can set the session time when you want the strategy to take trades. For example, if you want to take trades only between 10:00 hrs and 14:00 hrs, that can be set in settings.
2. You can set up your own Stop Loss percentage, but the optimum value, as we found fit in backtesting, is set at 0.5%
3. There is a max. daily loss safeguard also which by default is set at 5%. It means if a series of losses happen during the day and your capital loss reaches this maximum loss value set by you, the strategy stops trading for that day.
4. There is an option to close all positions by End of Day. By default, this feature is disabled, but you can enable it if you don't want to carry forward your positions.
5. A label displayed at the last bar gives you cumulative profit or loss and daily profit/loss statistics.

Cyatophilum Strategy BuilderAn indicator to create strategies, backtest and setup alerts.
The user can choose one or multiple TA entry conditions, if more than one the conditions are combined with a logical AND.
The entries will open up a trade, which is then handled by a risk management system including Trailing Stop, Take Profit and up to 100 Safety Orders.
This indicator can be used to backtest 3commas DCA bots who are using TA presets, RSI or ULT.
Its main goal is to create strategies by combining indicators.
Let's dive into the details of what's included:
Entry Condition: MACD
Triggers an entry when macd crosses with the signal line.
Configure the fast, slow length, signal smoothing and timeframe to trigger the condition.
Entry Condition: RSI
Triggers an entry when the RSI is higher or lower than the long/short threshold.
Configure the length, timeframe, long and short threshold to trigger the condition.
Entry Condition: ULT (Ultimate Oscillator)
Triggers an entry when the ULT is higher or lower than the long/short threshold.
Configure the 3 lengths, timeframe, long and short threshold to trigger the condition.
Entry Condition: Bollinger Bands
Triggers an entry when the price is above the upper band for long and below the lower band for short.
Configure the length, standard deviation and timeframe to trigger the condition.
Entry Condition: MFI (Money Flow Index)
Similar to RSI, it triggers an entry when the MFI is higher or lower than the long/short threshold.
Configure the length, timeframe, long and short threshold to trigger the condition.
Entry Condition: CCI (Commodity Channel Index)
Another oscillator that triggers an entry when its value is higher or lower than the long/short threshold.
Configure the length, timeframe, long and short threshold to trigger the condition.
Trend Filters
Use one or two trendlines to filter your trades: go only long/short when the trendline is bullish/bearish.
Choose between the several trendlines: ema, sma, wma, hull ma, kama, alma, rma, swma, vwma, Tilson T3, and the unique Adaptive T3 and Adaptive Hull MA.
If this is not enough, you can use the external trendline feature to plug in any other indicator for your trendline.
The second trendline can be MTF and come from another symbol if needed.
Combining Indicators
Most of the time we will not be using a single indicator at a time, but instead, combine them in order to get stronger entries.
The entry conditions are combined using a AND logical gate, meaning all conditions must be true for the entry to trigger.
Here is an example using a combination of 2 indicators: Bollinger Bands and RSI.
We can see less entries are being triggered on the bottom chart than on the top chart because the bottom chart is combining the 2 indicators while the top chart is only using Bollinger Bands.
You can combine up to all 6 indicators if you want, but keep in mind that combining too many may lead to triggering no entry at all.
Risk Management and Trade system
The indicator will not trigger more than one long or short entry in a row.
To start a new trade, the indicator will wait for either take profit, stop loss or an opposite entry if no SL and TP is set.
Stop Loss and Take Profit
Configure your stop loss and take profit for long and short trades.
You can also make a trailing stoploss and a trailing take profit.
Safety Orders
Just like 3commas bots, you can create a strategy with up to 100 safety orders.
Configure their placement and order size using the price deviation, step scale, take profit type (from base order or total volume), and volume scale settings.
Note: only the 20 first safety order steps or so will be plotted due to graphic limiations. The steps after that still trigger alerts and backtest results.
Creating Alerts
The indicator is using the newest alert system:
1. Write your alert messages in the indicator settings (alert section at the bottom)
2. Click "Create Alert" as usual, but choose "alert() function calls only"
Data Window
Since the indicator is applied on top of the price chart, the oscillator indicators cannot be plotted. You can always add them on another pane but if you want to just see their values, you can use the Data Window to see the value of each oscillator on each bar.
Backtest settings
Used to get the results below:
Initial Capital: 100 000$
Base Order Size: 0.1 contract (BTC)
Safety Order Size: 0.1 contract (BTC)
Commission: 0.1%
Slippage: 100 ticks
pyramiding: 6
The indicator settings are plotted in the main chart panel.

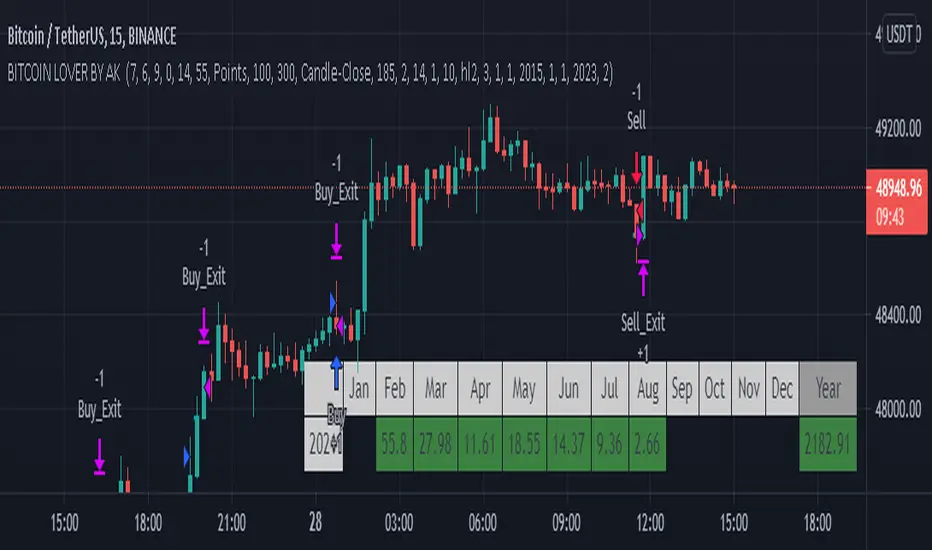
Bitcoin lover by Akthis strategy used to determine and anticipate potential changes in market price and reversals. The Highs referred to in the title are created based on the number of bars that exhibit lower highs on either side of a High, whereas the Lows are created based on the number of bars that exhibit higher lows on either side Low.it also analyzing price changes and reversals, a trader has more of an ability to determine and predict price patterns and general price trends...It take profit on pre define 500 points.. u can also change is take profit level. .and also added max intraday trades..so it help in risk management
brokerage added 0.02% and slippage added 20.
How it works??
It calculate swing on 5min chart.. When swing high is break it shows buy signal and when swing low is break it show sell signal.. And it book profit on 500 points.. U can also change profit points. .After booking profit if high or low of price break it again show buy and sell signal.. U can also use it with trend lines and moving average for better entry and exits..
I hope this will help trader for find out trends and profit booking and if u want to use it with comment strategy action you have to just add comment in comment box
caution: always follow risk management before using strategy
Combo Backtest 123 Reversal & Modified Price-Volume Trend This is combo strategies for get a cumulative signal.
First strategy
This System was created from the Book "How I Tripled My Money In The
Futures Market" by Ulf Jensen, Page 183. This is reverse type of strategies.
The strategy buys at market, if close price is higher than the previous close
during 2 days and the meaning of 9-days Stochastic Slow Oscillator is lower than 50.
The strategy sells at market, if close price is lower than the previous close price
during 2 days and the meaning of 9-days Stochastic Fast Oscillator is higher than 50.
Second strategy
The related article is copyrighted material from
Stocks & Commodities.
WARNING:
- For purpose educate only
- This script to change bars colors.

CRYPTOOO FOX (Trading System)CRYPTOOO FOX (Trading System)
---DISCRIPTION---
How Strategy Work :
--Strategy is working on higher time frame so i use two high time frame
the higher is ( 2 H or 3 H or 4 H or 8 H or 12 H or Daily ) and the highest is ( Daily ) Time frame .
-- When the higher time frame cross over the Daily time frame( the Highest ) this mean the TREND and
the PRICE also going UP this strategy is going to long position ( Buy position ) .
-- When the higher time frame cross under Daily time frame( the Highest ) this mean the TREND and
the PRICE also going DOWN strategy going to ( close position ) .
-- Notes :
--Strategy use some averages to calculate the higher time frame .
--Strategy use parabolic indicator to filter entries which name is ( Filter )
--Strategy use one more candle close to confirm entry ( Filter 2 )
--This the best time frame ( HIGHER , HIGHEST ) in this strategy in profit and draw down .
--Strategy is working only in Long position i am not recommend to use it in short positions .
--THIS IS NO REPAINT STRATEGY .
--DON'T use it in DAILY time frame
--I recommend so mush to use take profit and stop loss although the low draw down but some time
the market have a huge movements .
---- Strategy Settings which we publish now :
Fees = 0.1 the same as market fees .
Equity = 10 % and you can change it as you want .
Filter = 4 .
Filter 2 = true ( Just mark in check box beside Filter 2 ) .
Charts which working in these settings :
Eth/Usdt- 30 min/Binance ( Current image ) .
Btc/Usdt- 30 min/Binance .
Bch/Usdt- 30 min/Binance .
We do a lot of tests to get the best profit and also the lowest draw down
we will update the new settings for new charts

Hilega_Milega_StrategyThis study shows the price action strength using RSI & Moving Averages.
In this study different line indicates below measures---
BlackLine - Strength
Red Line - Volume
GreenLine - Price
1. Volume line is below price and strength then the price may go up.
2. Volume line is above price and strength then the price may go down.
3. Volume line below strength line price may stop going down.
4. Price line above strength then price may go down.
There is a total of 2 zones that indicate the price strength in the red zone price is showing strength ness and in the blue zone, the price is showing weakness.
This study helps to identify if the price is having strength or not if going up or down based on volume.\
Strategy give signal based on above-mentioned line as follows.
Buy - Strength line above volume & price line + Price line crossover Volume line.
Sell - Strength line below volume & price line + Price line crossunder Volume line.

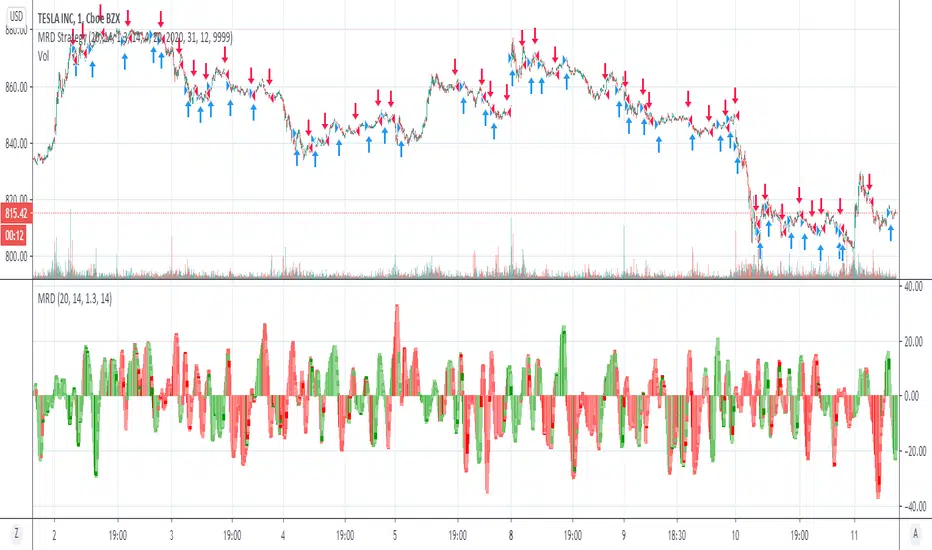
MRD StrategyI heard that MFI and RSI were most reliable when they are close together, so i made a script that takes the rough difference between the two, with some regression etcetera. What you see currently is 50.69% profitable trades, with a profit ratio of 1.3. Hope you like it.
Bottom catch strategyThis script is a strategy to buy on the basis of a short-term bottom on a prominent volume in a downtrend.
The logic is very simple.
Volume is above +2σ.
RSI indicates oversold conditions.
When the above conditions are met, the current location is judged to be a short-term bottom and the price is bought.
にほんご
このスクリプトは、下降トレンド中における突出した出来高を短期的な底と判断し、買うという戦略です。
ロジックはとてもシンプルです。
・出来高が+2σ以上である
・RSIが売られ過ぎを示している
以上の条件を満たすとき、現在地が短期的な底と判断しロングします。
短期的な底をスナイプするため、時間軸は短いほど(1~5分とか)上手く動くと思います。
BTCUSD以外で試してないです。

ToTitans : HHV/LLV Volume IndexWhat it is ?
The trade volume index (TVI) measures the amount of money flowing in and out of a security or the market. The TVI depends on the direction of the security and whether securities are accumulated or distributed. The TVI generally uses a security's intraday price data.
To calculate the TVI, the minimum tick value of the security must be known. Next, the change in price must be calculated by subtracting the last price from the most current price. Then, the direction must be determined. If the change in the security's price is greater than the minimum tick value, the security is in an accumulation period. If the change in the security's price is less than the minimum tick value, the security is in a distribution period. If the change is less than or equal to, or greater than or equal to, the minimum tick value, the security's direction is the same as the last direction.
When the direction is determined, the TVI can be calculated. If the security is in accumulation, the current TVI is the previous trade volume index plus the current day's volume. Conversely, if the security is in distribution, the TVI is the previous trade volume index less the current day's volume.
The TVI can be used to indicate buying or selling pressure within a security. Say, for example, the changes in the prices of the security are greater than the minimum tick value and have been rising over a six-hour period. This signals traders and investors are accumulating the security and buying at the ask. This can be interpreted as bullish activity and may signal the security could increase in price due to the buying pressure
Differentiation
It is implemented in pinescript version4
Easier to detect TFEX:S501! on hitting the Highest High Value (HHV) and the Lowest Low Value (LLV)
This indicator has been used in AJ Jim class for "Type 2" approach
Suitable for
Intra Day Trading (20m-2h)
TFEX:S501!
"PM me to obtain access"

Combo Backtest 123 Reversal & Market Facilitation Index This is combo strategies for get a cumulative signal.
First strategy
This System was created from the Book "How I Tripled My Money In The
Futures Market" by Ulf Jensen, Page 183. This is reverse type of strategies.
The strategy buys at market, if close price is higher than the previous close
during 2 days and the meaning of 9-days Stochastic Slow Oscillator is lower than 50.
The strategy sells at market, if close price is lower than the previous close price
during 2 days and the meaning of 9-days Stochastic Fast Oscillator is higher than 50.
Second strategy
The Market Facilitation Index is an indicator that relates price range to
volume and measures the efficency of price movement. Use the indicator to
determine if the market is trending. If the Market Facilitation Index increased,
then the market is facilitating trade and is more efficient, implying that the
market is trending. If the Market Facilitation Index decreased, then the market
is becoming less efficient, which may indicate a trading range is developing that
may be a trend reversal.
WARNING:
- For purpose educate only
- This script to change bars colors.

ak commodity gold,silver intradayHi friends this is Ak commodity gold , silver INTRADAY
It analyse price action when price makes higher high or higher low and it scalps and take profit ..It scalp on 1 min time frame..its occur in moment of time so for that algo trading require..it automatically take profit and stoploss and close trade near session end.it close all trade at 11pm..before commodity session close.. u can also change time for close trade...it automatically calculate previous candles high and low and when it breaks it generate buy and sell signal and take profit and loss
it is not holly grill strategy..it has drawdown...so before use be cauction..it calculates previous more than 200 candles high and low and than generate buy and sell signal.. its main advantage is it close all trade near session end so its more help full for intraday trader for backtesting..
if u want to use my strategy pls personal msg me

trendOne [Strategy]BITSTAMP:BTCUSD
trendOne
(strategy-tester)
It is not recommended to use this script for generating alerts. Use "trendOne Alerts" instead.
This script combines all our previous trend-based scripts (Bows, Autopilot, Trend Indicator, Price Deviation, etc) in only one script .
To calculate the trend we use:
Volume Weight
Average True Range
Bows calculations
Trends smoothed with alma() function.
For more accuracy on the signals and to filter unwanted signals we layered slower time-frames in the background and added breaking support & resistance rules.
Inputs
Sensitivity
Integer input. Sets the sensitivity for signals generated up and down. Higher values will generate less signals on chart, and vice-versa.
Enjoy!
Disclaimer:
Back-tests do not guarantee performance on the future. Even if a trading setup is profitable in historical data, it could be unprofitable in the future.
To get access to this and other scripts check links below.

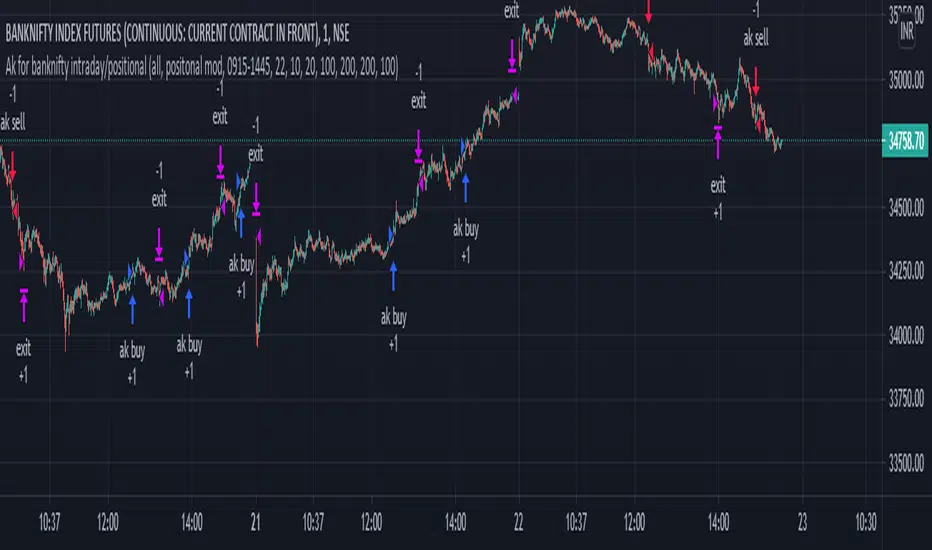
Ak for Banknifty intradayHi friends this is Ak for Banknifty Intraday
It analyse price action when price makes higher high or higher low and it scalps and take profit ..its occur in moment of time so for that algo trading require..it automatically take profit and stoploss and close trade near session end. u can also change time for close trade...it automatically calculate previous candles high and low and when it breaks it generate buy and sell signal...
MomentumInvest TrendFollower [@TradersVenue]VSA CheatSheet - Have kept the chart clean and clear not by putting each signal pattern name. What matters is identifying the real price action than the pattern name. To keep the charts clutter free, haven't put the signal name under/above the candle.
Rejection or reversal patterns
Green Circle - Typical SellingClimax, Stopping Volume and Bag Holding signal patterns as per VSA. Strong price volume action but price rejection at lower level.
Red Circle - Typical Buying Climax, End Of Rising, Supply Overcoming Demand signal patterns as per VSA. Strong price volume action but price rejection at higher level.
Green Square - Typical bullish TrendReversal candle as per VSA. Bullish breakout bar immediately after a bearish breakout bar and engulfing the previous one or cover max part of it.
Red Square - Typical bearish TrendReversal candle as per VSA. Bearish breakout bar immediately after a bullish breakout bar and engulfing the previous one or cover max part of it.
Momentum breakout patterns
Blue/Green Star - Bullish breakouts. Downthrust bars with significant price volume action. Green if smaller low weak otherwise blue.
Red/Pink Star - Bearish breakouts. Downthrust bars with significant price volume action. Red if low higher weak else pink.
Candle Color
Green - Bullish with strong price action. Good to enter long towards close with SL of day low. System suggests quantity as per 2% trading rule. One can play with risk defined option strategies or cash segment as per quantity suggested.
Red - Bearish with strong price action. Good to enter short towards close with SL of day high. System suggests quantity as per 2% trading rule. One can play with risk defined option strategies like bear put spread or bear call spreads or go for hedged shorts.
Pink - Bearish with muted price action. Trail SL. Better to avoid trading these candles.
Light blue - Bullish with muted price action. Trail SL. Better to avoid trading these candles.
Plotted EMA Ribbon gives a sense of the strength of momentum. When each MA is placed with wide gaps momentum is strong. When there is EMA confluence, chances of trend strength are weakening. Background color of the chart green indicates bullishness in the underlying and red indicates that bearish pressure in the scrip. If the background color is green and you see one Blue/Green star candle it's good to go long. If the background color is red and you see one Red/Pink star candle it's good to go short.
A word of caution: Trading breakouts is very good. But you need to prepare for breakout failures. Here the system picks wide range bars for going long or short that means SL is wide probably 3% and above. Also if you notice after a strong PV breakout if price sustains below that it can see long unwinding pressure and simillary after a strong PV breakdown, if price sustains above the breakdown candle, chances of short covering is higher. Here money management and risk management becomes very important. Same has been included as part of the indicator to give you an optimal quantity for trade to keep the drawdowns lower. If you enable (1) RECO message and (2) Show Strategy (Else Study)? options then it shows a RECO box with quantity calculated as per 2% loss per trade rule. Lot of risk management, scale up/down for compounding is also available. You may try out those options one by one.
This indicator needs to be used along with the “VSA + Volume Oscillator ”, because this setup relies on VSA (Volume Spread Analysis). The overall usage will be provided through a demo to the subscribing users. In order to gain access to this indicator you may contact me using the below signature.

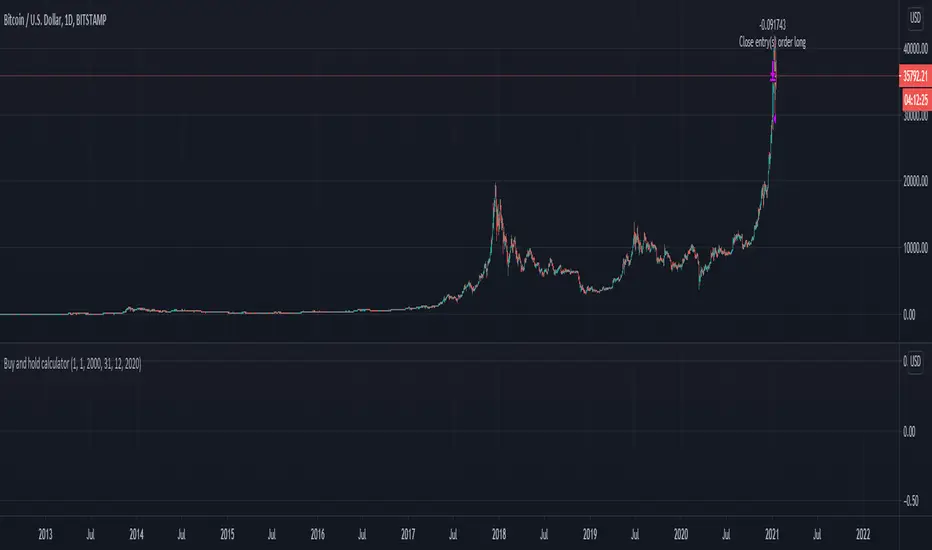
Buy and hold calculatorThis is a simple buy and hold calculator.
You have an initial date and once that dated it passed it will sell the product that was bought initially.
This strategy buys and sell 100% of the initial volume.
OBV Accumulation / Distribution Strategy CryptoThis version its made for 8-12h and works amazingly on the ETH pairs. Can be adapted to others as well
For this example, I used an initial 1$ account, using always full capital on each trade(without using any leverage), together with a 0.1% commission/fees for each deal, on Coinbase broker.
This is a long only strategy
The components for the inside of the strategy are the next one :
1. OBV Accumulation/Distribution
3. EMA
The rules here are simple : we check for cross up or above on OBV and EMAmoving average and after that we check for the trend direction based on ascending/descending OBV. Based on this we enter long or exit long.
RISK WARNING
Trading on any financial market involves a risk of loss. Please consider carefully if such trading is appropriate for you. Past performance is not indicative of future results.
If you have any questions or you are interested in trying it, private message me and I will give you as soon as I see the message a trial for it.

OBV_RMA_CRYPTO Buy and Hold Destroyer free versionThis is a free version which use part of the logic that I am applying on my destroyer/annihilation series of strategies.
This version its made for 8-12h and works amazingly on the ETH pairs. Can be adapted to others as well
For this example, I used an initial 1$ account, using always full capital on each trade(without using any leverage), together with a 0.1% commission/fees for each deal, on Coinbase broker.
For risk management, we have a hard stop loss on the equity of 25%.
The components for the inside of the strategy are the next one :
1. OBV- SoftKill Version adapted to cryptos
2. ATR - SoftKill Version adapted to cryptos
3. RMA Rolling moving average
The rules here are simple we check for the trend direction with ATR and then we check for cross up or above on OBV and RMA moving average. Based on this we enter long or short.
RISK WARNING
Trading on any financial market involves a risk of loss. Please consider carefully if such trading is appropriate for you. Past performance is not indicative of future results.
If you have any questions or you are interested in trying it, private message me and I will give you as soon as I see the message a trial for it.
