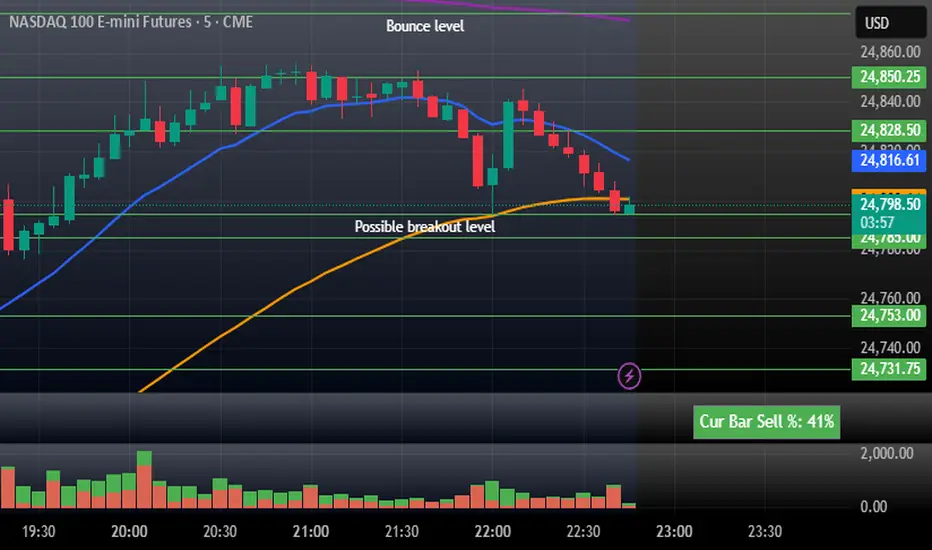
CustVolumeStudy - Stacked Buy/Sell + Sell% (top-right)Current Bar Sell + Stacked Buy/Sell. This indicator helps tell the story of momentum on the current bar. If the % is high then it is bearish. Low it is bullish. Penunjuk Pine Script®oleh ashley_fickett19
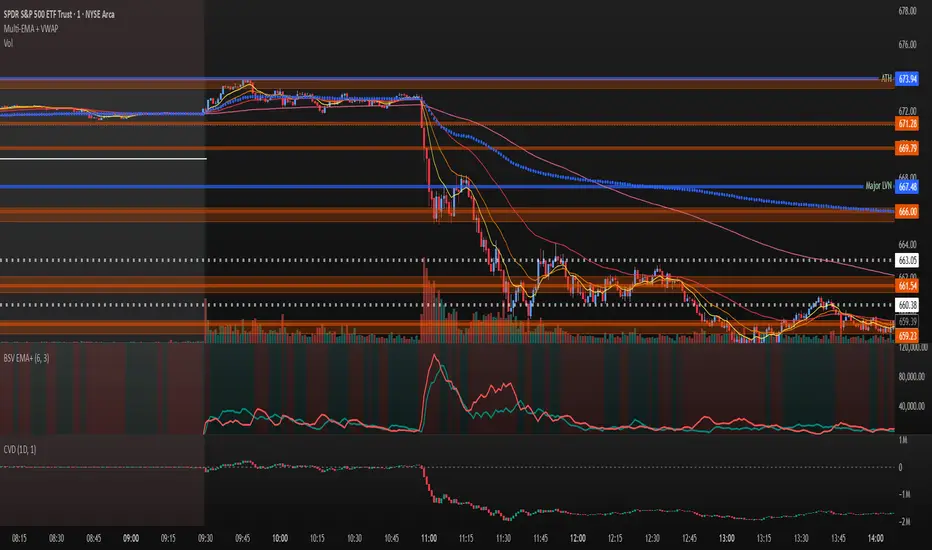
Volume Exponential Moving Averages (EMA) Description: This script is a simple script that plots a desired exponential moving average of buy and sell volume as a line chart with a tunable smoothing factor. There is a highlight on the plot area of either green or red to denote if the EMA of buy volume or sell volume is of a higher value. This indicator uses basic math of exponential averages and calculates volume using the formulas: "buy volume" = the product of total volume and the "closing price" minus the "low price" divided by "high price" minus the "low price" for a specific candle. Conversely, "sell volume" = the product of "total volume" and the "high price" minus the "close price" divided by "high price" minus the "low price" for a specific candle. Utility: This indicator is an effective way to gauge the acceleration/ deceleration of buyers and sellers in the market and can be used in combination with market structure and important levels to understand if buyers or sellers are taking over at any given time. How to use this indicator: There are two settings for this indicator: 1. The Length of the EMA: The length of the EMA can be adjusted based on your preference for a running number of candles' data. If you are interested to know short term changes in volume (e.g. over the past few candles at a major level) you can adjust this setting lower (~3-9 length). Conversely, if you are interested in volume trends over a greater number of candles you can increase this to your liking. Personal preference : Because I am a short term daytrader/ scalper, I keep this setting at 6 length to see immediate changes in the acceleration or deceleration of buyers/ sellers. 2. The Smoothing Factor: The smoothing factor can be adjusted to further tune the size of trend you are interested in with 1 = No smoothing of the EMA line. Smoothing of the EMA line increases as the value for smoothing increases, resulting in a less volatile, more smooth EMA line. However, the more smooth the line, the less sensitive the EMA will be to immediate changes in volume pace. The less smoothing factor is applied, the more volatile data will be, resulting in quicker observation of shorter term trends. Again the same rules apply as the EMA length as these are similar in function: If you are interested to know short term changes in volume (e.g. over the past few candles at a major level) you can adjust this setting lower (~2-6). Conversely, if you are interested in volume trends over a greater number of candles you can increase this to your liking. Personal preference : Because I am a short term daytrader/ scalper, I keep this setting at 2-4 smoothing factor to see immediate changes in the acceleration or deceleration of buyers/ sellers. You should, of course, play with these settings to your exact preferences based on your trading style. Tips for using this indicator: General Use: When the buy volume EMA is moving up, buyers are increasing the pace of buying and when the buy volume EMA is moving down, buyers are decreasing the pace of buying. Conversely, when the sell volume EMA is moving up, sellers are increasing the pace of selling and when the sell volume EMA is moving down, sellers are decreasing the pace of selling. The overall movement of the stock is relative to the combination of these rates. e.g. If both buyers and sellers are increasing at the same rate (EMAs slopes are roughly equal) there will be not a large change in price. If the slope of the buy volume EMA is greater than the slope of sell volume EMA, the price should move up. Conversely, if the slope of the sell volume EMA is greater than the slope of buy volume EMA, the price should move down. Predicting pullbacks, reversals, and continuations: This indicator allows you to see if buyers or sellers are increasing their pace, even if the stock price is in consolidation. This allows you to predict if out of the consolidation buyers or sellers are likely to win based on the momentum of the volume in consolidation. e.g. If price is in consolidation after an uptrend and the buy volume EMA starts to decrease, this could be a sign that buyers are running out of steam at this price level. Another example, If at a major support the buy volume EMA begins to trend up then buyers are accelerating the pace of buying at this level. EMA crosses: There is something to be said about the point at which the buy volume EMA and sell volume EMA cross. This signifies that at this moment there is a shift in which the acceleration of one party outpaces that of the other and can result in increased speed of the movement of the stock price. Considerations Because volume changes constantly, this indicator is best to identify short term changes in volume that could impact price movements. It is not guaranteed to continue just because buyers or sellers have had a change in pace. Therefore it is advised to use this indicator in combination with significant price levels such as pivot points, or price levels from volume profile tools to identify the price zones where significant volume changes are likely to impact price movements. It is also advised to continue to monitor the changes in pace in buyers and sellers using this volume EMA indicator to determine if a change in pace is short lived or if it will continue for a longer duration. Examples of use: Bullish Reversal: Bearish Continuation: Bearish EMA Crossover: (Settings: Length 6, Smoothing factor 3) Bullish EMA Crossover: (Settings: Length 6, Smoothing factor 4) Penunjuk Pine Script®oleh not_a_mad_scientist22
Volume BubblesVolume Bubbles Indicator Introduction The Volume Bubbles indicator is a powerful tool designed to visually highlight significant volume spikes on your TradingView charts. It helps traders identify potential areas of whale accumulation (large buying activity) or dumping (large selling activity) by displaying colored bubbles on candles where volume exceeds a customizable threshold. Green bubbles indicate bullish (buy) volume on up candles, suggesting possible accumulation, while red bubbles signal bearish (sell) volume on down candles, indicating potential dumping. The bubble size scales with the volume magnitude, making it easy to spot major market moves at a glance. This indicator is particularly useful for crypto, forex, and stock traders looking to gauge market sentiment and large player involvement without cluttering the chart. It's built in Pine Script v5 and overlays directly on your price action. How It Works The indicator calculates a moving average of volume (default: 20-period SMA) and detects spikes when current volume exceeds this average by a multiplier (default: 2x). Buy Bubbles (Green): Appear on bullish candles (close >= open) at the low wick, representing potential whale buying or accumulation zones. Sell Bubbles (Red): Appear on bearish candles (close < open) at the high wick, indicating potential whale selling or dumping zones. Bubble Size: Dynamically sized based on volume thresholds – huge for >1M, large for 500K-1M, normal for <500K. Transparency: Increases with volume ratio for better visibility on extreme spikes. Tooltip: Hover over a bubble to see detailed info like total volume, average volume, and ratio. By focusing on these high-volume events, traders can spot key support/resistance levels where whales might be active. How to Use for Whale Accumulation and Dumping Whales (large holders) often move markets with high-volume trades. This indicator helps spot them: Accumulation (Buying): Look for clusters of large green bubbles at price lows or during consolidations. This suggests whales are buying dips, potentially signaling a reversal or uptrend start. Combine with support levels for confirmation. Dumping (Selling): Watch for big red bubbles at price highs or after rallies. This indicates whales unloading positions, which could lead to downtrends or corrections. Pair with resistance levels. Tips: Use on higher timeframes (e.g., 1H+) for reliable signals. Confirm with other indicators like RSI or MACD to avoid false positives. In trending markets, buy bubbles in uptrends confirm strength; sell bubbles in downtrends signal continuation. Credits and Disclaimer Inspired by volume analysis techniques. This is free to use; feedback welcome! Not financial advice – trade at your own risk.Penunjuk Pine Script®oleh R2D2_4LifeTelah dikemas kini 99506
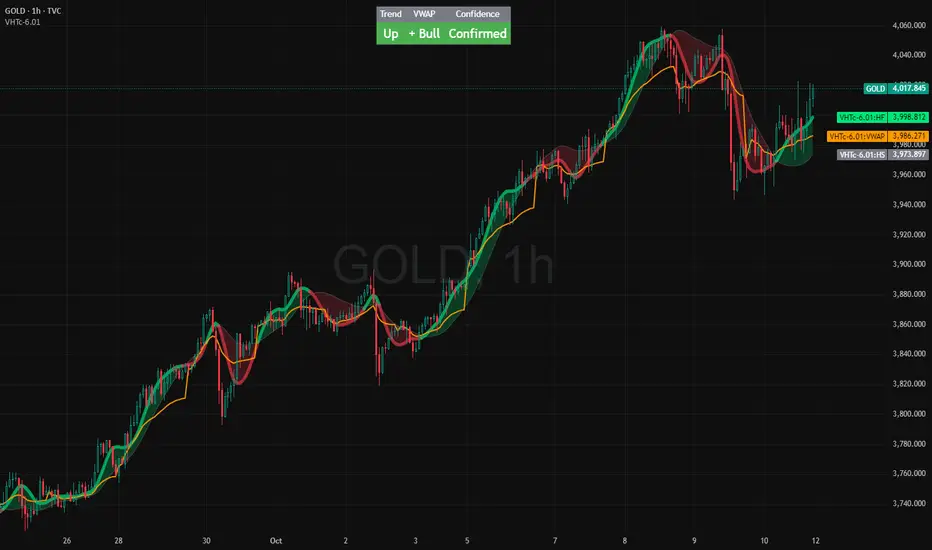
VWAP HMA Trends It visually syncs Trend, VWAP, and Confidence — giving you instant clarity to trade with calm precision. ⚙️ The Three Core Gauges: 1. 📈 Trend Green for up, Red for down (Trend: Confirms direction) 2. 💰 VWAP Price vs. Volume Weighted Average Price. Institutional Fair Value. (Bull or Bear) 3. 🎯 Confidence Agreement between trend & VWAP. Dont fight the trend. Bonus Feature: Confidence Turns 🟢 Confident when aligned, 🟡 Cautious when mixed. Together, these create a clean, visual readout of the market’s health. 🧩 How to Use Watch the Color Flow: 🟢 Green Cloud → Buyers in control. 🔴 Red Cloud → Sellers in control. Check VWAP (Orange Line): Price above VWAP → bullish strength. Price below VWAP → bearish control. Hovering at VWAP → indecision. Wait. --- Act With Discipline: Trade only when all gauges agree. Add size only in Confident conditions. Trim or tighten stops when it shifts to Cautious. ⚡ Quick Reference: 🟢 Green cloud + above VWAP + Confident | Uptrend continuation | Favor long bias 🔴 Red cloud + below VWAP + Confident | Downtrend continuation | Favor short bias Mixed colors or Cautious: Wait or scale back Cloud flips color: Possible shift. Reassess bias next bar ⚖️ Disclaimer: Educational and informational use only. Not financial advice. Always use independent judgment and position sizing. Penunjuk Pine Script®oleh TheAITradingDesk2281
Stochastic %K Colored by VolumeDescription: "Stochastic %K Colored by Volume is a technical indicator that combines the traditional Stochastic %K oscillator with volume-based coloring. It highlights periods of high, low, and neutral trading volume by changing the color of the %K line. Additionally, it identifies bullish and bearish divergences between price and the %K oscillator, helping traders spot potential reversals and trend changes. The indicator also includes key levels for overbought, oversold, and extreme zones to guide trading decisions."Penunjuk Pine Script®oleh InsiderNumber71116
Volume x Close in CroresThis indicator provides a clear visualization of the monetary volume activity for each candle by calculating the product of trading volume and closing price and converting it into crores for easier readability.Penunjuk Pine Script®oleh logu_prabhu_S9
[ZP] Fixed v6 testDISCLAIMER: This indicator in Pine V6 as my first ever Tradingview indicator, has been developed for my personal trading analysis, consolidating various powerful indicators that I frequently use. A number of the embedded indicators within this tool are the creations of esteemed Pine Script developers from the TradingView community. In recognition of their contributions, the names of these developers will be prominently displayed alongside the respective indicator names. My selection of these indicators is rooted in my own experience and reflects those that have proven most effective for me. Please note that the past performance of any trading system or methodology is not necessarily indicative of future results. Always conduct your own research and due diligence before using any indicator or tool. =========================================================================== Introducing the ultimate all-in-one DIY strategy builder indicator, With over 30+ famous indicators (some with custom configuration/settings) indicators included, you now have the power to mix and match to create your own custom strategy for shorter time or longer time frames depending on your trading style. Say goodbye to cluttered charts and manual/visual confirmation of multiple indicators and hello to endless possibilities with this indicator. Available indicators that you can choose to build your strategy, are coded to seamlessly print the BUY and SELL signal upon confirmation of all selected indicators: EMA Filter 2 EMA Cross 3 EMA Cross Range Filter (Guikroth) SuperTrend Ichimoku Cloud SuperIchi (LuxAlgo) B-Xtrender (QuantTherapy) Bull Bear Power Trend (Dreadblitz) VWAP BB Oscillator (Veryfid) Trend Meter (Lij_MC) Chandelier Exit (Everget) CCI Awesome Oscillator DMI ( Adx ) Parabolic SAR Waddah Attar Explosion (Shayankm) Volatility Oscillator (Veryfid) Damiani Volatility ( DV ) (RichardoSantos) Stochastic RSI MACD SSL Channel (ErwinBeckers) Schaff Trend Cycle ( STC ) (LazyBear) Chaikin Money Flow Volume Wolfpack Id (Darrellfischer1) QQE Mod (Mihkhel00) Hull Suite (Insilico) Vortex Indicator Penunjuk Pine Script®oleh Justas1231010 1.3 K
My EMA IndicatorMy Absolutely Profitable Indicator It can be use when ema9 crosses ema100 and so on... Use it with Volume Oscillator...Penunjuk Pine Script®oleh ewd2006Telah dikemas kini 2299
- Standardized Money Flow Index with Multi-MA and BB OverlayThis custom Money Flow Index (MFI) script enhances the standard MFI by introducing multiple layers of configurability, statistical normalization, and visual clarity. It begins with the traditional MFI calculation using the average price, hlc3, and a user-defined length, then offers the option to standardize the output. Standardization transforms the MFI into a z-score by subtracting a rolling mean and dividing by a rolling standard deviation, making the indicator statistically interpretable across different assets, timeframes, and volatility regimes. When standardization is active, the overbought and oversold thresholds shift from the conventional 80 and 20 to +2 and –2, aligning them with standard deviation boundaries and improving signal clarity in volatile environments. Beyond standardization, the script introduces a robust smoothing engine. Users can choose from several moving average types, including SMA, EMA, SMMA (RMA), WMA, and VWMA, to reduce noise and highlight trend shifts. A particularly advanced option is the “SMA + Bollinger Bands” mode, which overlays volatility envelopes around the smoothed MFI using a user-defined standard deviation multiplier. This feature helps traders identify when the MFI is unusually high or low relative to its recent behaviour, adding a volatility-adjusted layer of insight, especially useful in momentum or mean-reversion setups. Visually, the script is designed for clarity, modularity, and flexibility. It plots the raw or standardized MFI in purple, overlays the smoothed version in yellow if enabled, and adds green Bollinger Bands when selected. It also includes horizontal reference lines for overbought, oversold, and midpoint levels, which dynamically adjust based on whether standardization is active. A shaded background between the overbought and oversold lines further enhances readability, helping traders quickly assess momentum extremes and potential inflection zones. Compared to the standard MFI, which offers a fixed calculation, limited visual feedback, and no statistical context, this enhanced version is modular, customizable, and statistically grounded. It allows traders to tailor the indicator to their strategy, whether they prefer raw signals, smoothed trends, or volatility-adjusted extremes. These enhancements make it a powerful building block for more sophisticated signal engines, especially when combined with filter gating, persistent state logic, or multi-indicator overlays. Penunjuk Pine Script®oleh chriskokal1Telah dikemas kini 24
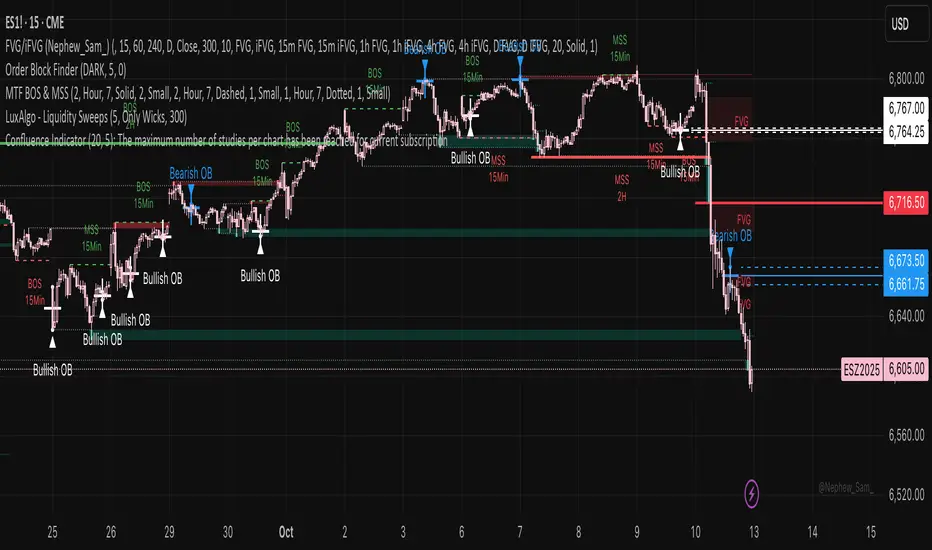
Confluence IndicatorFVG Liquidity sweeps Order blocks Break of structurePenunjuk Pine Script®oleh rachellvp123490
SJA WINFUT B3-10 INDICATOR FOR WINFUT B3 – 5-minute chart. This indicator was designed to trade the Bovespa index futures contract (WINFUT) on the 5-minute chart. It integrates technical analysis and macroeconomic context elements. It combines several indicators in which the system calculates a score weighted by color and intensity for each indicator, generating a metric called “STRENGTH %,” which reflects the dominance of buyers (green), sellers (red), or sideways movement (orange) at the moment. The calculation is adapted to market hours: Between 9:00 a.m. and 9:59 a.m., it considers only the available indicators; after 10:00 a.m., it uses all data. The panel displays real-time information, including divergences between strength and price, providing robust decision support for short-term operations on the mini index. Buying trend. The more green indicators (at the top of the panel) and dark blue indicators (at the bottom of the panel) and the higher the strength percentage, the greater the probability of buying. Selling trend. The more red indicators (at the top of the panel) and dark blue indicators (at the bottom of the panel) and the higher the strength percentage, the greater the probability of selling. Translated with DeepL.com (free version)Penunjuk Pine Script®oleh sandrojacicero16
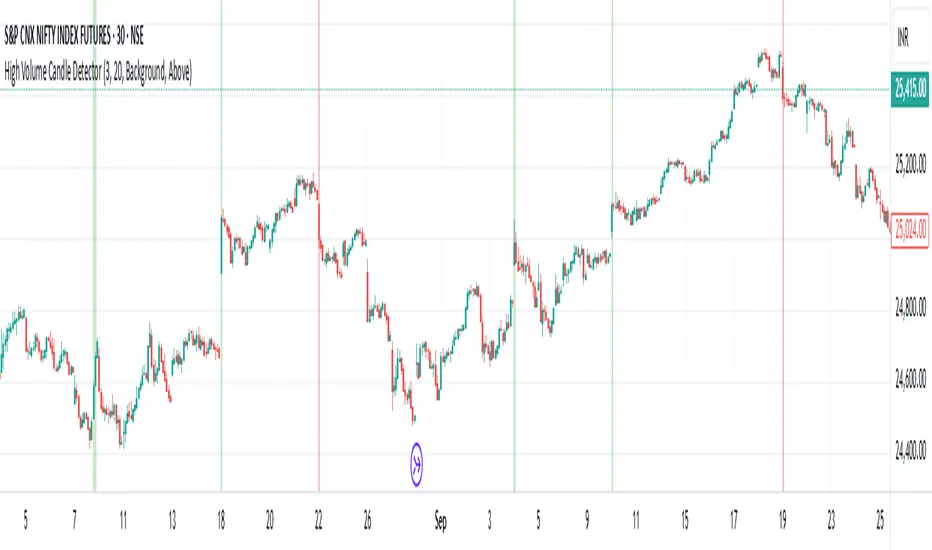
High Volume Candle Detector by Ravi Shinde📊 High Volume Candle Detector 🎯 Overview Identify exceptional volume spikes that signal institutional activity, breakouts, and reversals. Detects candles with volume exceeding a customizable threshold (default: 3x average volume over 20 periods). ✨ Key Features 🔧 Customizable Settings Volume Multiplier (default: 3.0x) - Define your threshold Average Period (default: 20) - Adapt to any timeframe Bullish/Bearish Detection - Automatic color coding (green/red) 🎨 Visual Styles Background - Subtle colored highlighting Border - Yellow box outline Shape - Triangle markers with "HV" text All - Combined display 🔔 Smart Alerts Bullish High Volume 🟢 Bearish High Volume 🔴 Any High Volume ⚠️ 📈 Derivatives Trading Method High-volume candle highs and lows mark key breakout levels. Break above = Go Long. Break below = Go Short. Trail your stop-loss with a moving average of your choice for optimal risk management. Optimal performance on 15-minute or higher timeframes. Lower timeframes may generate excessive noise.Penunjuk Pine Script®oleh sincereZebra473223
Digital RPM HUD — 4 Feeds + Confidence + Timeline (v3)🏎️ Digital RPM HUD — 4 Feeds + Confidence + Timeline (v3) A performance-style trading dashboard for momentum-driven traders. The Digital RPM HUD gives you an instant visual readout of market “engine speed” — combining four customizable data feeds (Trend, Momentum, Volume, Volatility) into a single confidence score (0–100) and a color-coded timeline of regime changes. Think of it as a racing-inspired control panel: you only “hit the throttle” when confidence is high and all systems agree. 🔧 Key Features 4 Data Feeds – assign your own logic (EMA, RSI, RVOL, ATR, etc.). Confidence Meter – blends the four feeds into one smooth 0–100 reading. Timeline Strip – shows recent bullish / bearish / neutral states at a glance. Visual Trade Cues – optional on-chart LONG / SHORT / EXIT markers. Fully Customizable – thresholds, weights, smoothing, colors, layout. HUD Overlay – clean, minimal, and adjustable to any corner of your chart. 💡 How to Use Configure each feed to reflect your preferred signals (e.g., trend EMA 200, momentum RSI 14, volume RVOL 20, volatility ATR 14). Watch the Confidence gauge: ✅ Above Bull Threshold → Market acceleration / long bias. ❌ Below Bear Threshold → Momentum loss / short bias. ⚪ Between thresholds → Neutral zone; stay patient. Use the Timeline to confirm trend consistency — more green = bullish regime, more red = bearish. ⚙️ Recommended Setups Scalping: Trend EMA 50 + RSI 7 + RVOL 10 + ATR 7 → Fast response. Intraday: EMA 200 + RSI 14 + RVOL 20 + ATR 14 → Balanced signal. Swing: Multi-TF Trend + MACD + RVOL + ATR → Smooth and steady. ⚠️ Disclaimer This script is not a trading strategy and does not execute trades. All signals are visual aids — always confirm with your own analysis and risk management.Penunjuk Pine Script®oleh pickledness87
NYSE FOMO Indicator (Up/Down Volume Ratio)This script plots the NYSE Sentiment Gauge, based on the daily Up/Down Volume Ratio (UVOL ÷ DVOL). It measures crowd emotion in the overall market: • ≥ 3 = Red: FOMO, extreme buying. • 2–3 = Yellow: Cautious optimism. • 0.5–2 = Grey: Neutral zone. • 0.33–0.5 = Green: Emerging fear. • ≤ 0.33 = Bright Green: Panic selling, potential bottom. The line color and chart background change according to these zones, visually showing shifts in market sentiment.Penunjuk Pine Script®oleh senglee_tan13
Swing Data - SimplifiedThe swing data indicator by jfsrev but simplified. Thank you jfsrev for your work! Penunjuk Pine Script®oleh cimmarron18
Continuation Suite v1 — 5m/15mContinuation Suite v1 — 5m/15m (Non-Repainting, S/R + Trend Continuation) What it does Continuation Suite v1 is a practical intraday toolkit that combines non-repainting trend-continuation signals with auto-built Support/Resistance (S/R) from confirmed pivots. It’s designed for fast, liquid names on 5m charts with an optional 15m higher-timeframe (HTF) overlay. You get: stacked-EMA bias, disciplined pullback+reclaim entries, optional volume/volatility gates, a “Strong” signal tier, solid S/R lines or zones, and a compact dashboard for fast reads. ⸻ Why traders use it • Clear bias using fast/mid/slow EMA stacking. • Actionable entries that require a pullback, a reclaim, and (optionally) a minor break of prior extremes. • Signal quality gates (volume vs SMA, ATR%, ADX/DI alignment, EMA spacing, slope). • Non-repainting logic when “Confirm on Close” = ON. Intrabar previews show what’s forming, but confirmed signals only print on bar close. • S/R that matters: confirmed-pivot lines or ATR-sized zones, optional HTF overlay, and auto de-dup to avoid clutter. ⸻ Signal construction (no magic, just rules) Bullish continuation (base): 1. Trend: EMA fast > EMA mid > EMA slow 2. Pullback: price pulls into the stack (lowest low or close vs EMA fast/mid over a lookback) 3. Reclaim: close > EMA fast and close > open 4. Break filter (optional): current bar takes out the prior bar’s high 5. Filters: volume > SMA (if enabled) and ATR% ≤ max (if enabled) 6. Cooldown: a minimum bar gap between signals Bearish continuation (base): mirror of the above. Strong signals: base conditions plus ADX ≥ threshold, DI alignment (DI+>DI- for longs; DI->DI+ for shorts), minimum EMA-spacing %, and minimum fast-EMA slope. Reference stops: • Longs: lowest low over the pullback lookback • Shorts: highest high over the pullback lookback Alerts are included for: Bullish Continuation, Bearish Continuation, STRONG Bullish, STRONG Bearish. ⸻ S/R engine (current TF + optional HTF) • Builds S/R from confirmed pivots only (left/right bars). • Choose Lines (midlines) or Zones (ATR-sized). • Zones merge when a new pivot lands near an existing zone’s mid (ATR-scaled epsilon). • Touches counter tracks significance; you can require a minimum to draw. • HTF overlay (default 15m) draws separate lines/zones with tiny TF tags on the right. • De-dup option hides current-TF zones that sit too close to HTF zones (ATR-scaled), reducing overlap. • Freeze on Close (optional) keeps arrays stable intrabar; snapshots show levels immediately as bars open. ⸻ Presets • Auto: Detects QQQ-like tickers (QQQ, QLD, QID) or SoFi; else defaults to Custom. • QQQ: Tighter ATR% and EMA settings geared to index-ETF behavior. • SoFi: Wider ATR allowances and longer mid/slow for single-name behavior. • Custom: Expose all key inputs to tune for your product. ⸻ Dashboard (top-right) • Preset in use • Bias (Bullish CONT / Bearish CONT / Neutral) • Strong (Yes/No) • Volatility (ATR% bucket) • Trend (ADX bucket) • HTF timeframe tag • Volume (bucket or “off”) • Signals mode (Close-Confirmed vs Intrabar) ⸻ Inputs you’ll actually adjust Trend/Signals • Fast/Mid/Slow EMA lengths • Pullback lookback, Min bars between signals • Volume filter (vol > SMA N) • ATR% max filter (cap excessive volatility) • Require break of prior bar’s high/low • “Strong” gates: min EMA slope, min EMA spacing %, ADX length & threshold Support/Resistance • Lines vs Zones • Pivot left/right bars • Extend left/right (bars) • Max pivots kept (current & HTF) • Zone width (× ATR), Merge epsilon (× ATR), Min gap (× ATR) • Min touches, Max zones per side near price • De-dup current TF vs HTF (× ATR) Repainting control • Confirm on Close: when ON, signals/SR finalize on bar close (non-repainting) • Freeze on Close: freeze S/R intrabar with snapshot updates • Show previews: translucent intrabar labels for what’s forming ⸻ How to use it (straightforward) 1. Load on 5-minute chart (baseline). Keep Confirm on Close ON if you hate repainting. 2. Use Bias + Strong + S/R context. If a long prints into HTF resistance, you have information. 3. Manage risk off the reference stop (pullback extreme). If ATR% reads “Great,” widen expectations; if “Poor,” size down or pass. 4. Alerts: wire the four alert types to your workflow. ⸻ Notes and constraints • Designed for liquid symbols. Thin books and synthetic “volume” will degrade the volume gate. • S/R is pivot-based. On very choppy tape, touch counts help. Increase min touches or switch to Lines to declutter. • If your chart timeframe isn’t 5m, behavior changes because lengths are in bars, not minutes. Tune lengths accordingly. ⸻ Disclaimers This is a research tool. No signals are guaranteed. Markets change, outliers happen, slippage is real. Nothing here is financial advice—use your own judgment and risk management. ⸻ Author: DaddyScruff License: MPL-2.0 (Mozilla Public License 2.0)Penunjuk Pine Script®oleh DaddyScruffTelah dikemas kini 126