Slope Rank ReversalThis tool is designed to solve the fundamental problem of "buying low and selling high" by providing objective entry/exit signals based on momentum extremes and inflection points.
The System employs three core components:
Trend Detection (PSAR): The Parabolic SAR is used as a filter to confirm that a trend reversal or transition is currently underway, isolating actionable trade setups.
Dynamic Momentum Ranking: The indicator continuously measures the slope of the price action. This slope is then ranked against historical data to objectively identify when an asset is in an extreme state (overbought or oversold).
Signal Generation (Inflection Points):
Oversold/Buy: A 🟢 Green X is generated only when the slope ranking indicates the market is steeply negative (oversold), and the slope value begins to tick upwards (the inflection point), signaling potential mean reversion.
Overbought/Sell: A 🔴 Red X is generated only when the slope ranking indicates the market is steeply positive (overbought), and the slope value begins to tick downwards, signaling momentum exhaustion.
The core philosophy is simple: Enter only when the market is exhausted and has started to turn.
Analisis Gelombang

ECG PRICE - mauricioofsousa📉 ECG PRICE – The Price Electrocardiogram
(explained for traders, scientists, and complete beginners)
🔍 1. WHAT IS THE ECG PRICE?
The ECG PRICE protocol is a market-reading system based on the RSI, but with a surgical twist:
👉 You don’t just calculate RSI from price.
👉 You adjust the price using the RSI, and then calculate RSI over this adjusted price.
This creates a filtered, amplified signal that behaves like a heart monitor for price, detecting micro-impulses and subtle market movements long before they show up in the standard RSI.
🧬 2. CORE IDEA
Just like a real ECG amplifies and reveals electrical rhythms hidden inside the heartbeat,
the ECG PRICE amplifies micro-deformations hidden inside the price’s momentum.
It works in three stages:
Compute the regular RSI
Use the RSI to adjust the price (creating an electrocardiographic price)
Compute a second RSI over this modified price
The result is a meta-derived oscillator—more sensitive, more precise, and better at detecting structural changes.
🧩 3. TECHNICAL BREAKDOWN
3.1. First RSI (classic)
The script calculates:
average gains
average losses
relative strength (RS)
and then the standard 0–100 RSI
This is the “normal heart rate monitor” everyone uses.
3.2. Creating the “Adjusted Price”
adjustedPrice = close * (rsi / 100)
This means:
➡️ When RSI is high (strong buying momentum), price is amplified.
➡️ When RSI is low (strong selling momentum), price is compressed.
This converts raw price into a bio-electrical signal, where the price itself is modulated by its own internal momentum.
It’s the financial equivalent of ECG gain adjustment.
3.3. RSI of the Adjusted Price
Now the script calculates a new RSI from this modified price.
That is the actual ECG PRICE.
This second-order oscillator becomes extremely sensitive to:
micro-momentum shifts
early trend fading
volatility shocks
micro-divergences
institutional pressure waves
It reads the electrical pattern behind the price rather than the superficial movement.
🟩🟥 4. Diagnostic Lines of the Protocol
35 (green dotted)
Pre-oversold fatigue zone.
65 (red dotted)
Pre-overbought exhaustion zone.
30 (white solid)
Classic oversold.
70 (white solid)
Classic overbought.
Together they create two diagnostic corridors:
1. Medical corridor (30–70):
Standard RSI clinical range.
2. Electrical corridor (35–65):
The ECG-sensitive zone where micro-shifts appear first.
🧠 5. In Engineering Language (MGO style)
The ECG PRICE is essentially:
A nonlinear second-order oscillator where the RSI feeds back into price, creating a recursive momentum-modulated signal.
It functions like a:
bioinformational modulator
feedback-driven wave processor
impulse amplifier
micro-PID sensitivity enhancer
Very similar to the informational-wave transformations inside the MGO pipeline.
👨⚕️📉 6. Explained for a Total Beginner
Imagine the price is a heart.
The normal RSI shows if the heart is beating fast or slow.
But the ECG PRICE takes that heartbeat…
feeds it back into the heart…
and then measures the new heartbeat.
This creates a much more sensitive exam that detects problems before the normal test would.
💡 7. What It Gives You in Practice
earlier reversal signals
better trend-fatigue detection
clearer micro-divergences
a clean RSI with reduced noise
a smoother momentum curve
advanced behavioral readings before breakouts
It’s an upgrade.
A second-layer RSI that “hears” the inner electrical impulses of price.

Gold 1&5 Min Trading Strategy [TradingFinder] XAU Scalper Signal🔵 Introduction
Scalping in financial markets is based on immediate price reactions and precise analysis of price action behavior. In this trading approach, the trader must identify signals that originate directly from market structure, momentum shifts, candlestick formations, and the position of price relative to key zones.
Supply and demand areas serve as the primary regions of order concentration and form the foundation of scalping analysis, since they provide the most accurate representation of balance or imbalance between buyers and sellers as well as the active flow of liquidity in the market.
In demand zones, price reactions usually begin with the formation of reversal or continuation candlestick patterns. These patterns include structures such as Pin Bar, Engulfing, Doji, Failure, Rejection, and other forms of false breakout behavior, each of which can indicate a potential short term change in direction.
Liquidity plays a central role in these reactions, because price entering a demand zone typically coincides with the absorption of sell side liquidity and the restoration of order flow. This process often leads to rapid movements that are suitable for scalping. Therefore, combining candlestick confirmation with the location of price inside a supply or demand zone is one of the most reliable methods of identifying low risk scalping signals.
Demand zones include several structural variations, each representing a different form of liquidity behavior. One of the most well known examples is the order block, which is the final bearish candle before a strong bullish movement and indicates the presence of unfilled buy side interest.
Another important structure is the Fair Value Gap, which appears when a price void forms across three consecutive candles due to a lack of liquidity during the moment of displacement. The market often returns to this area to restore balance. Imbalance structures also represent one sided pressure in order flow where the market reacts later to correct these inefficiencies.
Breaker structure is another key element in demand analysis. A breaker is formed when an order block is violated and price returns to the same level after collecting liquidity, then continues in the opposite direction. This pattern often appears near liquidity based highs or lows and reflects a shift in the strength of market participants.
Together, order blocks, Fair Value Gaps, imbalances, and breakers form the core of demand analysis in price action and are widely used in precise scalping strategies due to their strong connection with liquidity and the high predictability of price reactions within them.
Bullish Setup :
Bearish Setup :
🔵 How to Use
This strategy is built on price action analysis, market reactions inside supply and demand zones, and confirmation through candlestick patterns. The first step is to identify key areas such as order blocks, Fair Value Gaps, imbalances, or breakers.
After these zones are located, price behavior within them is examined using candlestick structure and momentum direction. Entries are taken only when price reaches a validated zone, a clear sign of liquidity absorption or injection appears, and a confirming candlestick forms inside the zone.
This approach allows the trader to capture fast and precise entries during moments when the market is actively reacting to decision points.
🟣 Long Setup
In the buy setup, a valid demand zone must first be identified. This can be a bullish order block, an unfilled bullish Fair Value Gap, an imbalance at the lower part of structure, or a bullish breaker. When price enters this zone and shows signs of absorbing sell side liquidity, candlestick behavior must be examined.
Formation of reversal signals such as a Pin Bar with a long lower wick, bullish Engulfing, Rejection Candle, or a false breakout of the low, indicates a favorable shift in order flow. After receiving candlestick confirmation, a buy entry is taken within the same zone and the stop level is placed below the liquidity boundary. Targets are typically based on filling gaps, reaching supply zones, or returning to structural means.
🟣 Short Setup
In the sell setup, a valid supply zone must be recognized. This may include a bearish order block, a bearish Fair Value Gap, an imbalance at the upper part of structure, or a bearish breaker. When price enters this zone and liquidity accumulates above nearby highs, the probability of a fast momentum shift increases.
Confirmation occurs when a bearish reversal pattern forms such as Engulfing, Pin Bar with a long upper wick, indecisive Doji followed by rejection, or a false breakout of the high. After confirmation, the sell entry is placed and the stop level is set above the liquidity zone. Targets are selected based on filling lower Fair Value Gaps, reaching demand zones, or returning to structural midpoints.
🔵 Settings
Last Candle in Signal Direction : When On, a signal is issued only if the last candle moves in the direction required by the signal.
Signal in Nearly Zone : When enabled, the signal becomes valid even if the candle is near the zone rather than strictly inside it. When disabled, only signals formed inside the zone are allowed.
Allow Both Side Signals : When On, signals from both sides of the structure can be issued even if a limiting level exists. When disabled, only signals that do not violate the limiting level are allowed.
🔵 Conclusion
Using price action, supply and demand zones, and candlestick confirmation alongside liquidity analysis creates an effective framework for identifying fast market reactions in scalping conditions. Focusing on structures such as order blocks, Fair Value Gaps, imbalances, and breakers allows the trader to recognize shifts in momentum and changes in order flow with greater precision.
In this approach, entries are taken only when price reaches a validated zone, liquidity behavior is observable, and the confirming candle forms at the correct location. This leads to organized, low risk scalping signals that are aligned with the real time behavior of the market.

RSI + ADX + ATR Strength GaugeThis indicator combines Relative Strength Index (RSI), Average Directional Index (ADX), and Average True Range (ATR) into a unified strength gauge that identifies high-quality trending conditions while filtering out choppy, low-volatility markets.
RSI measures momentum and overbought/oversold conditions.
ADX confirms trend strength (not direction), highlighting when price movement has strong follow-through.
ATR captures volatility expansion, filtering out flat, low-range candles where fake signals occur.
When the components diverge or show contraction, the gauge warns of market chop, suggesting it’s better to avoid entries or reduce position size.
Purpose:
To keep you out of sideways markets and confirm entries only when momentum, trend strength, and volatility all agree — reducing whipsaws and improving trade quality.
Tweak to your liking.

Swing Distance Analyse + TableVisualize swing distances, cumulative supply/demand volume, and Ease of Movement in a structured table for precise market analysis.
Long Description:
This indicator detects pivot highs and lows to analyze market swings, calculating:
Swing distance between consecutive pivots
Cumulative volume for demand (highs) and supply (lows)
Ease of Movement (EMV-style) for each swing
Trend and extension flags for actionable insights
All swing data is displayed in a customizable table panel on your chart. Ideal for traders who want a clear, structured overview of recent swings, volume pressure, and market dynamics.
Features:
Configurable swing length and number of swings displayed
Table shows swing type, supply/demand trends, EMV, extension, duration, and result
Color-coded labels and table cells for quick interpretation
Works on all chart timeframes

Ichimoku Silver Bullet 2026 – Precision Cloud Signals⚡️ Ichimoku Silver Bullet 2026 – Precision Cloud Signals
Take your Ichimoku trading to the next level with Silver Bullet 2026 ⚔️
This advanced system detects Tenkan-Kijun crossovers, Kumo breakouts, and true Cloud confirmations — giving you only the cleanest, most reliable signals.
🔥 Features:
✅ Smart Bull 🟢 & Bear 🔴 alerts with Kumo validation
✅ Precision cloud logic for fewer fake signals
✅ Works on any timeframe & any market
✅ Plug-and-play Ichimoku setup — no clutter, pure signal
🎯 Trade with clarity. Enter with precision. Ride the Silver Bullet. 🌥🚀

Ultimate Ichimoku Trend Board MTF – 6× Cloud Analyzer⚡️ Ultimate Ichimoku Trend Board MTF – 6× Cloud Analyzer
Unleash the full power of Ichimoku with this multi-timeframe trend dashboard ⚙️
Quickly identify whether each timeframe is Bullish 🟢, Bearish 🔴, or Inside the Cloud 🟠, and align your trades with the dominant trend like a pro.
🔥 Features:
✅ 6 customizable timeframes (M5 → H4)
✅ Clean & minimal dashboard — no chart clutter
✅ Instantly visualize market direction across all layers
✅ Perfect for scalpers, intraday, and swing traders
💡 See the Clouds. Read the Trends. Dominate the Market. 🌥💪

Ultimate Prime Hyper Oscillator Pro [TraderCloud]추세, 변동성, 모멘텀, 평균회귀 모든 분석과 원리를 분석할 수 있는 최고의 오실레이터.
맨 상단에는 고래의 매수와 매도 시그널을 보여준다.
중간에는 rsi, mfi, rci, cci 등의 과열/과냉 지표를 로지스틱 회귀 평활화로 복합 운영하는 종합 모멘텀 오실레이터이다. 단기, 중기, 장기 이렇게 3가지의 기간별 다이버전스와 히든 다이버전스를 시각화한다.
또한 오실레이터 중간에 있는 히스토그램은 lazybear의 squeeze momentum oscillator를 기반으로 제작한 히스토그램 지표이다.
주요 변동성 오실레이터 바로 상/하단에는 히스토그램과 UPO 오실레이터의 추세가 동일하거나, 잠재성을 가질 때를 시각화해서 보여준다.
아래에는 중단기 추세를 Chop Zone 형식으로 시각화해서 보여준다.
아래 얇은 막대의 자잘 자잘한 신호들은 중단기적 평균회귀 구간을 보여준다.
마지막으로 테이블은 타임별 오실레이터의 추세를 간략화해서 정리해준다.
“The ultimate oscillator capable of analyzing all aspects of trend, volatility, momentum, and mean reversion.”
At the very top, it displays whale buy and sell signals.
In the middle, it functions as a comprehensive momentum oscillator that combines and smooths overbought/oversold indicators such as RSI, MFI, RCI, and CCI through logistic regression. It visualizes three types of divergences — short-term, mid-term, and long-term — as well as hidden divergences.
The histogram located in the center of the oscillator is based on LazyBear’s Squeeze Momentum Oscillator.
Right above and below the main volatility oscillator, it visualizes when the histogram and UPO oscillator share the same trend or show potential correlation.
At the bottom, mid- to short-term trends are visualized in a Chop Zone style.
The small thin bars below indicate short- to mid-term mean reversion zones.
Finally, the table provides a simplified summary of each oscillator’s trend by timeframe.

Binary Options 1 Minute Signals [TradingFinder] 1 Min Strategy🔵 Introduction
At first sight, price movement in binary options appears random, but behind every move lies a clear logic of liquidity and market imbalance. The market is always driven by the hunt for liquidity and the continuous rebalancing that takes place around Fair Value Gaps (FVGs) and Order Blocks (OBs). These zones are where institutional activity is concentrated and where Smart Money creates the most significant reactions.
When price approaches a key liquidity zone, it often performs a Liquidity Sweep to capture orders resting around previous highs or lows. This move usually presents itself as a False Breakout. Price briefly breaks a level to trigger stop losses and collect liquidity, then quickly reverses direction. Understanding this false breakout behavior is essential for identifying high probability reversals in binary options trading.
After the liquidity sweep, price typically retraces into a Fair Value Gap or Order Block, where the market seeks balance and new orders are introduced. This interaction between liquidity, imbalance, and institutional order flow forms the core logic of every Smart Money trading model.
By focusing on Liquidity Sweeps, False Breakouts, and the structure of FVGs and OBs, traders can read the true intention behind price movements. What seems like random volatility becomes a structured cycle of liquidity collection and reaction, offering clear opportunities for precision-based binary entries.
Bullish Setup :
Bearish Setup :
🔵 How to Use
This indicator works within the Smart Money framework and focuses on the connection between Liquidity Sweep, False Breakout, Fair Value Gap (FVG) and Order Block (OB).
It is created to help traders identify the moment when the market finishes collecting liquidity and begins to show signs of reversal.
The indicator studies how price behaves around zones where liquidity is concentrated, such as previous highs and lows or areas with visible inefficiency. When a clear reaction forms and a valid candle pattern confirms the shift in direction, the indicator generates a signal that represents the activity of Smart Money.
This tool does not respond to random volatility or noise. It waits for structure, liquidity and confirmation to align together before providing an entry. As a result, every signal has a logical base related to institutional order flow rather than ordinary price fluctuations. This approach allows traders to focus only on the movements that reflect true liquidity behavior.
🟣 Long Setup
A bullish setup takes place when the market moves downward and reaches a sell-side liquidity zone located below previous swing lows. In this area, price performs a Liquidity Sweep by moving under key levels to trigger stop losses and capture liquidity from trapped sellers.
This movement usually appears as a False Breakout because the market breaks below a level for a short moment and then quickly moves back inside the range.
Around this zone, a bullish Order Block or Fair Value Gap (FVG) often exists, showing where institutional demand is active.
When the indicator detects the presence of liquidity collection together with a valid bullish confirmation candle near an OB or FVG, it creates a Call signal.
This marks the moment when Smart Money is shifting from selling pressure to accumulation, and a strong bullish move often follows. For binary entries, the best opportunity usually comes immediately after the confirmation candle closes.
The reaction tends to happen quickly because the liquidity grab has completed and new institutional buying pressure is entering the market. This type of setup often provides a clean and precise entry with a high probability of success.
🟣 Short Setup
A bearish setup happens when the market rises and enters a buy-side liquidity area above previous highs. Here, the market performs a Liquidity Sweep to trigger stop losses placed above those highs and to absorb liquidity from trapped buyers.
This pattern forms what traders recognize as a False Breakout because the price only breaks the level temporarily before reversing in the opposite direction. A bearish Order Block or Fair Value Gap (FVG) often appears around this zone, showing where institutional selling interest exists.
Once the liquidity sweep completes and a bearish confirmation candle closes, the indicator produces a Put signal that reflects the shift from buying to selling pressure by Smart Money.
This moment often leads to a fast downward reaction as the market rebalances and fills the nearby inefficiency.
The most effective entry for binary trading is right after the confirmation candle closes, when the false breakout and liquidity collection are both completed. The price usually reacts sharply as the market transitions from liquidity hunting to a new directional move. This setup represents a structured view of how liquidity drives market cycles and how Smart Money creates precise reversals through controlled imbalance and reaction.
🔵 Settings
Time Frame : Defines the timeframe used for analysis. If left blank, the indicator automatically uses the chart’s current timeframe.
Swing Period : Determines how many candles are used to identify structural turning points such as swing highs and swing lows. Higher values increase accuracy but reduce the number of signals.
Signal Type : Specifies the type of signal generated by the indicator. The option All shows every signal, Main Signal displays only the primary one, and Alternative Signal produces a secondary signal that appears one candle after the main signal for additional confirmation.
Candle Pattern : Enables candle pattern logic for reversal confirmation. When active, the indicator issues a signal only when a valid candle formation confirms the market reaction.
Candle LookBack Check : Verifies that the last few candles move in the opposite direction of the signal to be generated. This condition acts as a confirmation filter, ensuring that the signal appears only after a clear counter-move in price.
Last Candle Direction : Considers the direction of the most recent candle in the analysis. It helps determine whether the final candle moves with or against the current trend.
Last Candle Shadow Ratio : Sets the ratio between the last candle’s wick and body to refine confirmation accuracy. Higher values require longer wicks, indicating stronger rejection and a more reliable reversal pattern.
🔵 Conclusion
Trading with Smart Money logic means understanding how liquidity moves through the market.
Each Liquidity Sweep, False Breakout, Fair Value Gap (FVG) and Order Block (OB) reflects the process of collecting and redistributing orders.
This indicator captures that sequence and turns it into precise, structured signals for binary entries. When liquidity is absorbed and a candle confirmation appears, the market reveals its true direction.
At that moment, traders can act with confidence, following institutional flow instead of reacting to random price moves.
Success with this system comes from patience, confirmation, and a clear reading of liquidity behavior, the core principles behind every Smart Money reversal.

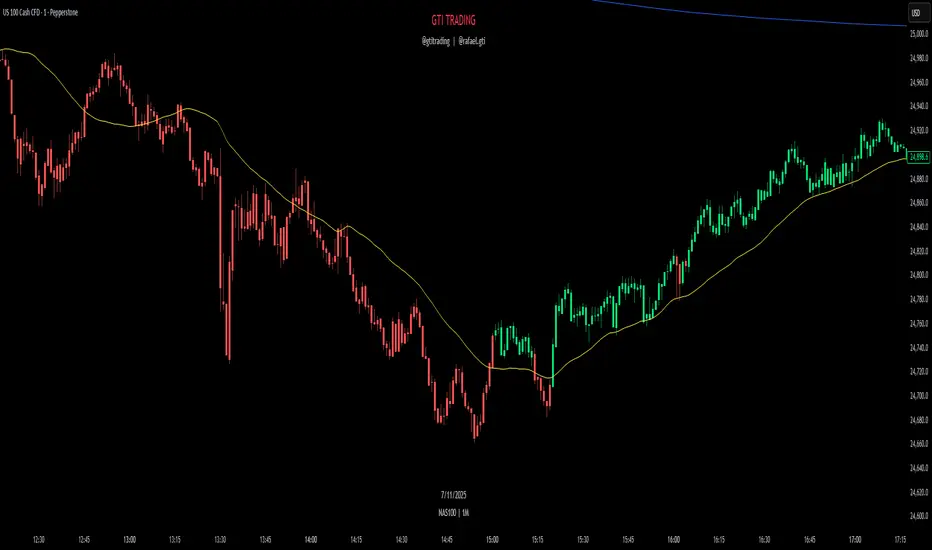
GTI TrendThe GTI Trend is a trend-detection indicator that highlights potential market direction by coloring candles based on internal analysis of higher timeframe momentum and price action behavior.
Unlike simple moving average crossovers or RSI thresholds, GTI Trend uses a proprietary blend of price positioning logic and multi-timeframe validation. Specifically, it evaluates candle structures and key breakout zones from larger timeframes to determine whether short-term movements align with higher timeframe momentum — helping traders avoid false breakouts and identify real trend continuation zones.
The result is a real-time visual cue: green candles for bullish bias and red candles for bearish bias — tuned for lower timeframes like 1m, 3m, and 5m. This helps scalpers and short-term traders align entries with broader market structure.
How It Works
GTI Trend is built around the concept of directional alignment. It compares short-term price action against higher timeframe swing zones and dynamic reference levels. When price confirms breakout behavior while staying within those zones, the candle turns green or red accordingly. This avoids the lag often seen in classic indicators.
The system dynamically adapts to market volatility, making it particularly effective in fast-moving sessions like the New York Open (typically from 10:30 AM GMT -3).
Confluence Strategy
The GTI Trend is most effective when combined with a 38-period short-term moving average. If the candle is green and the price is above the MA, this confirms a bullish continuation. Conversely, a red candle below the MA may suggest a bearish reversal.
Pairing it with VWAP is also recommended, especially in index markets, as this highlights possible support/resistance zones to validate the signal.
Recommended Markets
The GTI Trend performs best on high-volatility assets such as NASDAQ, US30, SP500, Gold (XAUUSD), and the Brazilian mini index. However, it can be applied to any asset with sufficient price movement.
VMMA Wave Edges [MTF]The VMMA Wave Edges is a multi-timeframe (MTF) overlay indicator that plots dynamic upper and lower edges formed by a band of Volume-Weighted Moving Averages (VWMAs) of varying lengths. It computes N VWMAs with lengths increasing arithmetically from start_len by incr, then plots:The maximum of all VWMAs → Upper Edge
The minimum of all VWMAs → Lower Edge
These edges are calculated on a higher timeframe (mtf_tf) and projected onto the current chart, creating a smooth, volume-sensitive envelope that adapts to volatility and trend strength.Use & InterpretationFeature
Purpose
Upper Edge
Dynamic resistance zone; price often reacts when approaching or breaking above.
Lower Edge
Dynamic support zone; price tends to bounce or consolidate near it.
Edge Contraction
Low volatility → potential breakout setup.
Edge Expansion
High volatility → trend continuation or exhaustion.
MTF Projection
Avoids repainting & noise by using cleaner higher-timeframe data.
Trading ApplicationsMean ReversionBuy near Lower Edge, sell near Upper Edge (especially in ranging markets).
Breakout ConfirmationPrice closing above Upper Edge on MTF → bullish breakout.
Below Lower Edge → bearish.
Trend FilterIn uptrend: price above Upper Edge → strong momentum.
In downtrend: price below Lower Edge → strong bearish control.
Support/Resistance FlipBroken Upper Edge → becomes future support (and vice versa).

The Machine – Session Map PRO (final)The Machine – Session Map
Overview
The Machine – Session Map is a session-based analytical indicator that divides the trading day into the three main global sessions — Asia, London, and New York — and maps their price behavior using structured logic. It’s designed for traders who study intraday cycles, session liquidity behavior, and inter-session relationships.
Core Logic
The indicator identifies the start and end times of each major trading session based on user-defined session times. For every session, it:
Captures session range by recording the high, low, and close between session start and end.
Stores previous session data and projects key levels (previous session high, low, and midpoint) into the next day as reference support/resistance zones.
Computes pip range and volatility metrics per session to measure strength and expansion.
Determines directional bias by comparing the session’s close relative to its open and prior session range (expansion above or below prior structure defines bias).
Detects accumulation and distribution zones using session overlap logic and range compression/expansion criteria.
Labels session structures with automatic annotations such as “Expansion,” “Retracement,” or “Reversal” when volatility or bias conditions are met.
Visual Elements
Session Boxes: Colored regions that visually segment the chart into the three sessions.
High/Low Lines: Dynamic lines showing real-time session highs and lows as price develops.
Previous Session Levels: Optional projection of previous highs/lows/midpoints as structural zones.
Bias Labels: Text markers summarizing session direction and volatility conditions.
Dashboard Panel: Displays current session time, range in pips, and directional bias summary.
Use Case
This tool is useful for identifying intraday structure shifts, comparing session volatility, and observing how price behaves relative to prior session levels. It can support strategies involving session-based liquidity cycles, accumulation/manipulation/distribution behavior, or time-based confluence.
Disclaimer
This indicator is designed for technical and educational analysis. It does not generate buy/sell signals or provide financial advice.

Quantum Leap by GSK-Vizag-AP-IndiaQuantum Leap by GSK-Vizag-AP-India
This indicator detects strong impulse price movements, also known as "quantum leaps," in bullish and bearish directions. Using the Average True Range (ATR) to measure market volatility, it identifies candles with body sizes significantly larger than recent average ranges, suggesting strong momentum surges.
The script groups consecutive impulse candles into blocks, highlighting zones of sustained bullish or bearish strength on the chart. These visual blocks aid traders in quickly spotting powerful price moves that may indicate key market shifts or reversals. Additionally, this tool can be effectively used to identify Fair Value Gaps (FVG) in price action, making FVG detection easier and more intuitive for users.
Inputs allow customization for ATR length, impulse strength threshold, and minimum consecutive candles, enabling adaptation to different markets or timeframes.
Important Disclaimer:
This indicator is for educational and informational purposes only. It is not financial advice and does not guarantee future results. Users should conduct their own research and seek professional guidance before making any trading decisions. Trading involves risk, including the potential loss of capital.
Market Profit X (MPX)Hi Traders,
Welcome to Market Profit X (MPX)
Keep
It
Simple
Stupid
I have created MPX to give a main screen visual with simple easy Buy/Sell signals based on your favorite wave trend oscillators.
Traders' learners through to advanced will and I say will PROFIT using MPX easy to follow system.
The 12: Tema and 56: Tema are utilized umm yeah that's right the same ones you are paying thousands for 56 Tema giving you your baseline or zero line on the common Wave Trend Oscillator and the 12 Tema giving you that momentum where all chasing.
One thing after years of studying what really is the bread and butter? Money money money that's what matters money flowing in money flowing out Long/Short yeah. So that's what your BUY/SELL signals are based on and they work.
I have added ATR for stops and have found after extensive trials setting multiplier to 2.5 you are going to have a high % of winning trades which you can thank me with i will send my BTC wallet Addy.
I have added the 8 EMA for another extremely rewarding swing system that i may share with my crew or people I like. I hear you already 8 EMA yeah right that's old worth nothing well it's what I do with this is the magic.
So how do I use? i can see the DM box filling up now because i have been reluctant to release this simple little indicator because i trialed it put in hard yards and know it's a banger.
first one i share and if i get no donations i take down because i know you will be hitting home runs.
Top-down analysis first are we bull or bear? then i drop to the 30m or 15m and wait for BUY/SELL signal go to your favorite wave trend oscillator i have mine over at Marketspy.com and take a good look at your money flow. I will wait for candle to close and confirm then buy next candles open or drop down to the 5m for slight pullback for entry.
Tip one: I like to buy 60 or -60 levels with confidence what will catch you reg bear divs.
like everything not every signal a home run that's why as soon as you take the trade you are looking at your stop and setting it in stone if you get hit o well onto the next. What's your number one? protecting your bank.
Now like i said the 8EMA system is a special spice i may share with special people as it requires training.
Enjoy tell me i suck i don't care i know it works and makes consistent money and my trading group guys will vouch for me.
Thank you, Trader (IKN) I Know Nothing out.

Binary Options Gold Scalping [TradingFinder] 1 & 5 Min Strategy🔵 Introduction
In binary options trading, price movements are often driven by the market’s tendency to reach key liquidity zones. These areas include Liquidity, Fair Value Gaps (FVGs), and Order Blocks (OBs), zones where a large number of pending orders are concentrated.
When price reaches one of these zones, it typically enters a Liquidity Sweep phase to collect available liquidity. After this process, the market often reacts sharply, either reversing direction or continuing its move with renewed momentum. Understanding this cycle forms the foundation of most smart money-based binary options strategies.
In this analytical approach, a Liquidity Sweep is usually seen as a False Breakout, often recognized through a distinctive candle confirmation pattern. The pattern appears when price briefly breaks a level to trigger stops, then quickly returns within range. This formation is one of the most reliable reversal signals for short-term trades and plays a central role in many binary options strategies.
After a liquidity sweep, price often returns to Fair Value Gap (FVG) or Order Block (OB) areas to restore balance in the market. These are zones where institutional orders are typically placed, and reactions around them can create high-probability trade setups. In binary options trading, this quick reaction following a sweep and retrace into an FVG or OB provides one of the best entry opportunities for short-term trades.
By combining the concepts of Liquidity Sweep, Fair Value Gap, and Order Block, traders can build a precise binary options strategy based on smart money behavior, allowing them to identify market reversals with greater confidence and enter at the optimal moment.
Bullish Setup :
Bearish Setup :
🔵 How to Use
This indicator is built on the Smart Money Concept (SMC) framework and serves as a core tool for accurately detecting Liquidity Sweeps, Order Blocks, and Fair Value Gaps in binary options trading.
Its logic is simple yet powerful : when price reaches high-interest liquidity zones and shows reversal signs, the indicator issues an entry signal immediately after a Candle Confirmation is complete.
Signals only activate when both the market structure and the candle confirmation pattern align, ensuring high accuracy in spotting genuine reversals.
🟣 Long Position
A bullish signal appears when the market, after a downward move, reaches sell-side liquidity zones where liquidity has built up below previous lows. In such conditions, a bullish Order Block or Fair Value Gap often exists in the same region, acting as a potential reversal point.
When the indicator detects the presence of liquidity, an imbalance zone (FVG), and a valid candle confirmation simultaneously, it triggers a green Call signal.
In a binary options strategy, the best entry moment is immediately after the candle confirmation closes, as this is when the probability of reversal is highest and the market tends to react strongly within the next few candles.
In the example below, after the liquidity sweep and candle confirmation, price quickly rallied, resulting in a Binary Win setup.
🟣 Short Position
A bearish signal occurs when price, after an upward move, reaches an area of buy-side liquidity and collects liquidity above recent highs. At this stage, the market is typically overbought and ready to reverse. If a bearish Order Block or Fair Value Gap exists in the same area and a candle confirmation pattern forms, the indicator displays a red Put signal.
This setup is highly accurate because multiple structural confirmations occur simultaneously : liquidity has been absorbed, price is rebalancing, and the confirmation candle has closed.
In binary options trading, this is the ideal moment to enter a Put (Sell) position, as the price reaction to the downside is usually quick and decisive.
In the example chart, the indicator generated a bearish signal right after the candle confirmation and completion of the liquidity sweep, price then dropped within minutes, resulting in another Binary Win.
🔵 Settings
Time Frame : Select the desired timeframe for analysis. If left blank, the indicator uses the chart’s current timeframe.
Swing Period : Defines how many candles are used to detect structural pivots (swing highs and lows). A higher value increases accuracy but reduces the number of signals.
Candle Pattern : Enables candle-based confirmation logic. When turned on, the indicator issues signals only if a valid reversal pattern is detected. You can also choose the confirmation filter strength, tighter filters show fewer but more precise signals.
🔵 Conclusion
A deep understanding of Liquidity Sweeps, Order Blocks, and Fair Value Gaps can make a decisive difference between ordinary and professional traders in the binary options market.
This indicator, combining smart money logic with candle confirmation, is one of the most precise tools for detecting true market reversals. When liquidity is collected and structural reversal signs emerge, the indicator automatically recognizes the price reaction and generates a reliable Call or Put signal.
Using this tool alongside market structure analysis and FVG detection allows traders to enter high-probability setups while filtering out false breakouts. For that reason, this binary options strategy is not only suitable for short-term trading but also valuable for understanding deeper smart-money behavior across timeframes.
Ultimately, success with this system comes down to two key principles: understanding the logic of the liquidity sweep and waiting for the candle confirmation to close. When these two conditions align, the indicator can pinpoint the best entry points with remarkable precision, helping you build a structured, intelligent, and profitable binary options strategy.

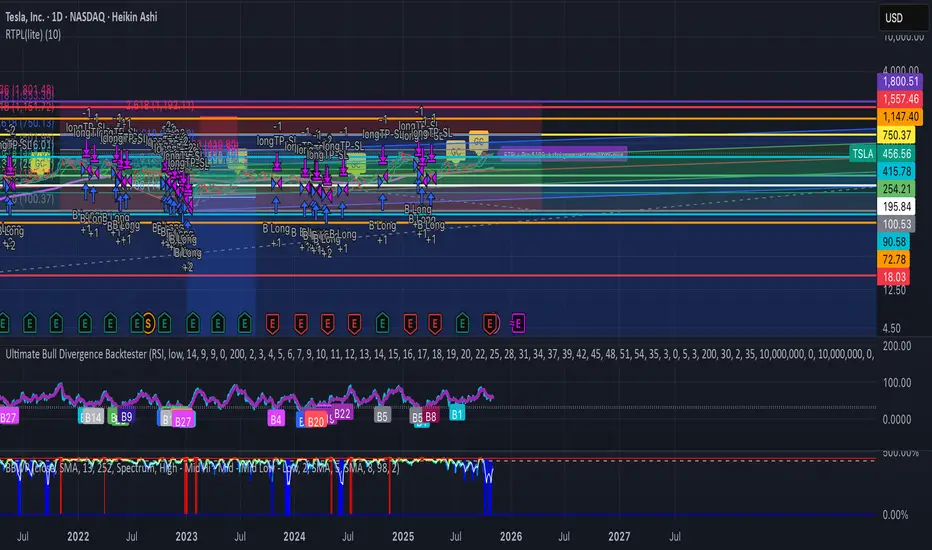
RTPL(lite)RTPL(lite) — Free
Simple, powerful, no cost.
• Auto-detects Wave 5
• Shows TP target
• 400D EMA line
• Golden Cross alert
• Gaussian channel
Works on any chart. No subscription needed.
Full version ($109) → rtpl.gumroad.com/l/rtpl-plus
RSI with SMA + 70/60/50/40/30 LevelsIndicator Name:
RSI with SMA + 70/60/50/40/30 Levels
🧩 Concept Overview:
यह indicator दो popular tools को combine करता है:
RSI (Relative Strength Index) – momentum indicator जो market ke overbought aur oversold zones ko identify karta hai.
SMA (Simple Moving Average) – trend smoother jo RSI ke movement ko average karke lagging confirmation deta hai.
इन दोनों के साथ 70, 60, 50, 40, और 30 की multiple reference lines draw की जाती हैं, ताकि trader को RSI ke swings aur reversals easily samajh aaye.
⚙️ Indicator Components:
RSI Line:
Default Period: 14 (customize kar sakte ho).
Show karta hai price momentum – agar RSI 70 ke upar jaata hai to market overbought zone me hota hai; agar 30 ke niche jaata hai to oversold zone me.
SMA on RSI:
RSI ka smooth version (usually 9-period SMA).
Trend confirmation ke liye – jab RSI line SMA ke upar cross karti hai to bullish signal, aur neeche cross kare to bearish signal.
Horizontal Levels:
70: Overbought zone (potential sell area).
60: Strong bullish momentum line (trend confirmation).
50: Neutral / midline (trend direction flip area).
40: Weak bearish zone (trend losing strength).
30: Oversold zone (potential buy area).
💡 How to Use:
Trend Identification:
RSI > 60 aur SMA ke upar → Bullish trend.
RSI < 40 aur SMA ke neeche → Bearish trend.
Reversal Spotting:
RSI 70 ke upar jaake wapas niche aaye → Sell signal.
RSI 30 ke neeche jaake wapas upar aaye → Buy signal.
Confirmation Using SMA:
RSI cross SMA from below → Confirmed bullish reversal.
RSI cross SMA from above → Confirmed bearish reversal.

Weis Wave Volume MTF 🎯 Indicator Name
Weis Wave Volume (Multi‑Timeframe) — adapted from the original “Weis Wave Volume by LazyBear.”
This version adds multi‑timeframe (MTF) readings, configurable colors, font size, and screen position for clear dashboard‑style display.
🧠 Concept Background — What is Weis Wave Volume (WWV)?
The Weis Wave Volume indicator originates from Wyckoff and David Weis’ techniques.
Its purpose is to link price movement “waves” with the amount of traded volume to reveal how strong or weak each wave is.
Instead of showing bars one by one, WWV accumulates the total volume while price keeps moving in the same direction.
When price direction changes (up → down or down → up), it:
Finishes the previous wave volume total.
Starts a new wave and begins accumulating again.
Those wave volumes help traders see:
Effort vs Result: Big volume with small price move ⇒ absorption; low volume with big move ⇒ weak participation.
Trend confirmation or exhaustion: High volume waves in trend direction strengthen it, while low‑volume waves hint exhaustion.
⚙️ How this Script Works
Trend & Wave Detection
Compares close with the previous bar to determine up or down movement (mov).
Detects trend reversals (when mov direction changes).
Builds “waves,” each representing a continuous run of bars in one direction.
Volume Accumulation
While price keeps the same direction, the script adds each bar’s volume to the running total (vol).
When direction flips, it resets that total and starts a new wave.
Multi‑Timeframe Computation
Calculates these wave volumes on three timeframes at once, chosen dynamically:
Active Chart Timeframe Displays WWV for:
1 min 1 min
5 min 5 min
15 min 15 min
Any other Chart TF
It uses request.security() to pull each timeframe’s latest WWV value and current wave direction.
Visual Output
Instead of plotting histogram bars, it shows a table with three numeric values:
WWV (1): 25.3 M | (15): 312 M | (240): 2.46 B
Each value is color‑coded:
user‑selected Uptrend Color when price wave = up
user‑selected Downtrend Color when wave = down
You can position this small table in any corner/center (top / bottom × left / center / right).
Font size is user‑adjustable (Tiny → Huge).
📈 How Traders Use It
Quickly gauge buying vs selling effort across multiple horizons.
Compare short‑term wave volume to higher‑timeframe waves to spot:
Alignment → all up and big volumes = strong trend
Divergence → small or opposite‑colored higher‑TF wave = potential reversal or pause
Combine with Wyckoff, VSA, or standard trend analysis to judge if a breakout or pullback has real participation.
🧩 Key Features of This Version
Feature Description
Multi‑Timeframe Panel Displays WWV values for 3 selected TFs at once
Dynamic TF Mapping Auto‑adjusts which TFs to use based on chart
Up/Down Color Coding Customizable colors for wave direction
Adjustable Font and Placement Set font size (Tiny→Huge) and screen corner/center
No Histograms Keeps chart clean; acts as a compact WWV dashboard

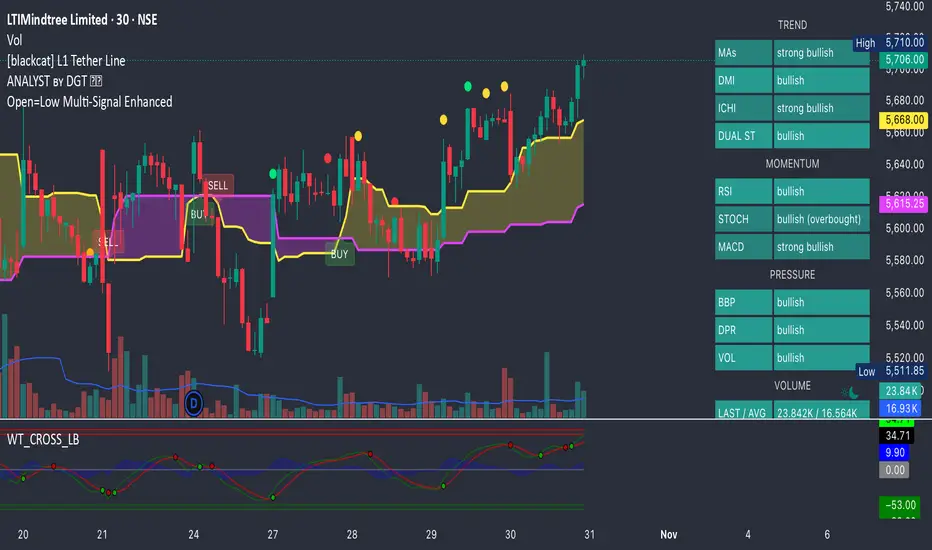
Open=Low Multi-Signal EnhancedPower your trades with all new Open = Low with tolerance added in the price. This script will give Open = Low and also if slight deviation in the Open = Low with rising volume and rising momentum in the price.
Directional Flow Index (DFI) — v2.4Directional Flow Index (DFI) — v2.4
✨ 1) What DFI measures (conceptual)
DFI aims to quantify directional flow —i.e., whether trading activity is skewed toward buying (supportive pressure) or selling (resistive pressure) —and then present it as a normalized oscillator that is easy to compare across symbols and timeframes. It is designed to highlight high-confidence thrusts within a prevailing trend and to detect fatigue as momentum decays.
Positive DFI (> 0) : net buy-side pressure dominates.
Negative DFI (< 0) : net sell-side pressure dominates.
Magnitude reflects intensity after de-trending and Z-score normalization.
While multiple “flow” proxies exist, this version emphasizes a True Volume Delta (TVD) workflow (default) that tallies buy vs. sell volume from a lower timeframe (LTF) inside an anchor timeframe bar, producing a more realistic per-bar delta when supported by the symbol’s data.
✨ 2) Core pipeline (how it works)
Flow construction (TVD default).
Using ta.requestVolumeDelta(LTF, Anchor), the script approximates up-volume vs. down-volume inside each anchor bar.
A per-bar delta is derived (with a reset on anchor switches to avoid jumps).
If TVD is unsupported on the symbol, DFI can fall back to synthetic proxies (e.g., Synthetic Delta Volume: (close-low)/(high-low) × vol), but TVD is the intended default.
CVD-style accumulation.
Per-bar delta is cumulatively summed into a running flow line (CVD-like), providing temporal context to the net pressure.
High-pass de-trending + smoothing.
A high-pass step (EMA-based) removes slow drifts (trend bias) from the CVD line.
A short EMA smoothing reduces noise while preserving thrust.
Z-score normalization.
The de-trended series is standardized (rolling mean/std), so DFI readings are comparable across markets/timeframes.
The Signal line is an EMA of DFI and is used for momentum cross checks.
SuperTrend (regime filter).
A lightweight SuperTrend (ATR len=5, factor=6 by default) provides up/down regime.
DFI coloring and alerts can be conditioned on the regime (optional).
Fatigue % (0–100).
Tracks energy (EMA of |DFI|) vs. peak energy (with adaptive half-life decay).
When energy stays far below the decaying peak, Fatigue% rises, suggesting momentum exhaustion.
The decay rate adapts to DFI volatility and regime alignment, so decay is faster when thrusts are misaligned with trend, slower when aligned and orderly.
Gradient highlight (confidence shading).
Histogram color transparency blends three ingredients:
DFI strength (|DFI| vs user-set bands)
Low fatigue (fresher thrusts score higher)
Regime alignment (DFI sign vs SuperTrend direction)
Result: darker bars indicate higher confidence in thrust quality; faint bars warn of weaker, stale, or misaligned pushes.
✨ 3) Interpreting the plots
DFI histogram (columns):
Green above zero for buy-side thrust, Red below zero for sell-side thrust.
Opacity encodes confidence (darker = stronger alignment & lower fatigue).
Signal (line): EMA of DFI used for momentum regime checks.
Zero line: structural reference for thrust crossovers.
Fatigue Table (optional): shows Fatigue%, SuperTrend regime, and selected Flow Method.
✨ 4) Alerts (examples)
Long Thrust: DFI crosses above zero while in Up regime.
Short Thrust: DFI crosses below zero while in Down regime.
Loss of Momentum (Up): DFI crosses below Signal while DFI > 0 (warns of weakening long thrust).
Loss of Momentum (Down): DFI crosses above Signal while DFI < 0 (warns of weakening short thrust).
✨ 5) How to set the TVD Lower TF (important)
TVD needs a sensible LTF/Anchor ratio for balanced accuracy and performance. As a rule of thumb, aim for ~30–120 LTF bars inside one anchor bar:
1h chart → 1–2m LTF (if seconds not available).
4h → 3–5m.
1D → 15–30m.
1W → 1–2h.
1M → 4h–1D.
Notes: Some symbols/exchanges do not provide seconds. Too small an LTF can be heavy/noisy; too large becomes coarse/laggy.
✨ 6) Practical usage patterns
Trend-following entries:
Look for DFI > 0 in Up regime (green) with low Fatigue%, and DFI crossing above zero or above its Signal.
Prefer darker (higher-confidence) histogram bars.
Trend-following exits / de-risking:
Rising Fatigue% toward your high threshold (e.g., 80–90) suggests exhaustion.
DFI vs Signal crosses against your position can be used to scale down.
Avoid chop:
When DFI oscillates around zero with faint bars and Fatigue% rises quickly, quality is low—be selective.
✨ 7) Inputs (summary)
Flow Method: default True Volume Delta (LTF scan); synthetic fallbacks available.
Processing: Detrend length, smoothing EMA, Z-score window, Signal EMA.
Regime: SuperTrend ATR length & factor (default 5 & 6).
Fatigue%: EMA length, base half-life, adaptive volatility coupling (enable/disable, sensitivity).
UI Highlight: strength thresholds, fatigue cap, alignment weights, opacity range.
Table: toggle Fatigue table, decimals, position.
✨ 8) Compatibility & performance notes
TVD requires supported data for the symbol; if unavailable, DFI can switch to synthetic deltas.
Smaller LTFs increase request load and may introduce noise; prefer a balanced ratio.
The indicator is designed to be self-contained; no other overlays are needed to read the outputs.
✨ 9) Limitations and good practice
This is an oscillator, not a price predictor. Extreme values can persist in strong trends.
Normalization (Z-score) makes values comparable, but distributions differ across assets/timeframes.
Always combine with risk management and position sizing; avoid interpreting any single condition as a guarantee.
✨ 10) Disclaimer
This script is for educational purposes only and does not constitute financial advice. Trading involves risk, including possible loss of principal.
---------------------------------------------------------------------------------------------------------------------
한국어 번역 / Korean version below
✨DFI란 무엇인가?
DFI는 시장의 매수·매도 우위를 Flow(흐름) 형태로 분석하여
그 에너지를 정규화된 오실레이터로 표현하는 지표입니다.
가격의 단순 변동이 아니라, “얼마나 일관성 있는 압력(Flow)이 유지되는가”를 보여줍니다.
DFI > 0: 매수세 우위 (상방 압력)
DFI < 0: 매도세 우위 (하방 압력)
값의 크기: 모멘텀의 강도 (Z-score 기반 정규화)
기본 방식인 True Volume Delta (TVD) 는 상위 봉(Anchor) 내부의 하위 타임프레임(LTF) 데이터를 스캔해
실제 매수/매도 체결량 차이를 계산합니다.
이로써 단순 가격 변화가 아닌 실제 체결 흐름의 방향성을 반영합니다.
✨DFI의 계산 과정 (개념적 흐름)
1. Flow 계산 (TVD 또는 대체 방식)
ta.requestVolumeDelta()를 사용하여 상·하위 TF간 볼륨 델타를 계산합니다.
TVD 미지원 심볼은 자동으로 Synthetic Delta Volume 등 대체 방식으로 전환됩니다.
2. 누적(CVD) 구성
Flow를 CVD처럼 누적하여 순매수/순매도 압력을 누적 추적합니다.
3. 고역통과(High-pass) 필터
누적 흐름(CVD)에서 장기 추세 성분을 제거하여 순수한 변동 에너지만 남깁니다.
4. Z-score 정규화
평균과 표준편차로 표준화해 DFI의 크기를 **일정한 스케일(0 중심)**로 만듭니다.
다른 종목·시간대 간 비교가 용이합니다.
5. SuperTrend 레짐(추세 상태) 인식
ATR 기반 ST(기본: Length=5, Factor=6)를 통해 시장이 상승/하락/중립 중 어디에 있는지를 감지합니다.
DFI 컬럼 색상 및 알림은 이 ST 방향에 따라 동작합니다
6. Fatigue% (피로도 지수)
최근 에너지 평균과 역사적 피크(감쇠)를 비교해 0~100%로 “신선도”를 표현합니다.
높을수록 피로한 상태, 낮을수록 신선한 추세.
또한 변동성과 정렬 여부에 따라 Adaptive Half-Life로 감쇠 속도가 자동 조정됩니다.
7. 그라디언트 하이라이트 (Gradient Highlight)
DFI 강도(|DFI|), Fatigue%, 레짐 정렬 상태를 종합해 히스토그램의 투명도를 연속적으로 변화시킵니다.
강하고 신선하며 정렬된 추세일수록 더 진하게 표시, 반대로 약하거나 피로한 구간은 흐리게 표시됩니다.
✨DFI 차트 해석법
DFI 히스토그램 (컬럼):
위로 향한 초록색 = 매수 우위,
아래로 향한 빨강색 = 매도 우위.
진할수록 “신뢰도 높은 흐름(Aligned + Low Fatigue)”
흐릴수록 “노이즈성 움직임 / 피로 구간”
Signal 선:
DFI의 EMA.
DFI와의 교차는 모멘텀 전환 신호로 사용.
Zero 선:
추세 전환의 기준선.
Fatigue Table:
Fatigue%, Regime, Flow Method 정보를 실시간 표시.
✨알림 조건 (Alerts)
DFI Long Thrust: 상승 레짐에서 DFI가 0 위로 돌파.
DFI Short Thrust: 하락 레짐에서 DFI가 0 아래로 돌파.
Loss of Momentum (Up): DFI>0 상태에서 Signal 아래로 하락.
Loss of Momentum (Down): DFI<0 상태에서 Signal 위로 상승.
TVD (True Volume Delta) 설정 가이드
TVD는 Anchor:LowerTF = 약 30~120배 비율이 가장 효율적입니다.
1시간봉 -> 30초~2분
4시간봉 -> 2~8분
일봉(1D) -> 12~48분
주봉(1W) -> 1~4시간
월봉(1M) -> 4시간~ 1일
참고:
일부 거래소는 초 단위를 지원하지 않습니다 → 분 단위로 대체.
너무 짧은 LTF → 과부하/노이즈,
너무 긴 LTF → 신호 지연/정밀도 저하.
✨활용 전략 예시
추세 추종 (Trend-following):
Up Regime에서 DFI>0 & Fatigue% 낮을 때 롱 신호 우선.
DFI가 Signal 위로 돌파하는 시점이 thrust 시작점.
리스크 축소 (De-risking):
Fatigue%가 80~90 이상이면 추세 과열로 간주.
DFI가 Signal을 역방향으로 교차 시 포지션 축소 고려.
횡보 회피:
DFI가 0선 부근에서 얕게 진동하며 흐릿하게 표시될 때는
방향성이 약한 구간 → 진입 회피.
✨한계 및 권장 사용법
TVD는 심볼/거래소의 지원 여부에 따라 제한될 수 있습니다.
Z-score 정규화로 수치 간 비교는 용이하지만, 자산마다 분포 특성이 달라 절대값 해석은 주의 필요.
Fatigue%는 “모멘텀 신선도” 개념이지, 반전 타이밍이 아닙니다.
리스크 관리 및 전략적 컨텍스트 안에서 사용하세요.
✨면책 (Disclaimer)
이 스크립트는 교육용 도구(Educational purpose)이며,
투자 조언(Financial advice)이 아닙니다.
모든 트레이딩에는 손실의 위험이 있으며,
DFI의 신호나 수치가 수익을 보장하지 않습니다.
✨정리
DFI는 단순한 “추세 오실레이터”가 아니라,
에너지의 흐름 + 피로도 + 레짐 정렬이라는 3요소를 결합해
“지속 가능한 방향성”을 시각적으로 표현하는 지표입니다.
즉, 단순한 ‘방향’이 아니라 “추세의 질(Quality)”을 보여주는
새로운 형태의 Flow 분석 도구입니다.

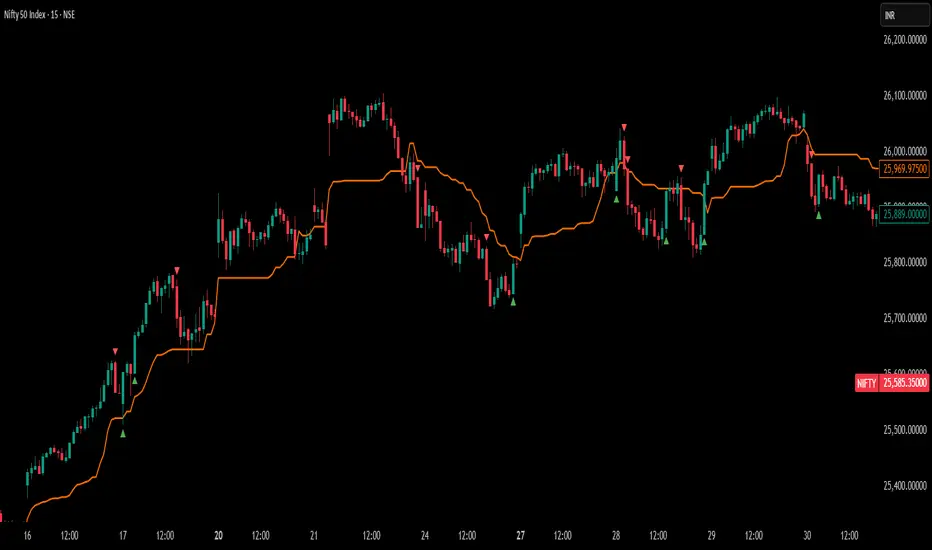
Swing High/Low (Adaptive)Swing High/Low (Adaptive)
Overview
The Indicator is a pivot point detection tool that identifies swing highs and lows with invalidation tracking. The key differentiator of this indicator is its adaptive invalidation system . Most pivot indicators simply mark every detected pivot without considering whether subsequent price action has made earlier pivots less relevant.
How It Works
The indicator uses Pine Script's native ta.pivotlow() and ta.pivothigh() functions combined with custom logic to detect swing points. The adaptive algorithm evaluates each potential pivot against the following criteria:
For Low Pivots:
Confirms a new low pivot when it's the next expected pivot type in the swing sequence
If consecutive lows occur, only accepts a new low if it's lower than the previous low
Marks the previous low as invalidated when a stronger low is detected
For High Pivots:
Confirms a new high pivot when it's the next expected pivot type in the swing sequence
If consecutive highs occur, only accepts a new high if it's higher than the previous high
Marks the previous high as invalidated when a stronger high is detected
This approach ensures that the indicator maintains clean swing structure and automatically adjusts when price action creates stronger pivots, providing a more realistic view of support and resistance levels.
Settings
Pivot Settings:
Left Bars : Number of bars to the left required for pivot confirmation (default: 5)
Right Bars : Number of bars to the right required for pivot confirmation (default: 5)
Pivot Display Settings:
Toggle visibility for low and high pivots independently
Customizable colors for valid pivot markers
Low pivots marked with upward triangle (▲)
High pivots marked with downward triangle (▼)
Invalid Pivot Settings:
Optional display of invalidated pivots
Separate color customization for invalid low and high pivots
Helps visualize where market structure expectations changed
ZigZag Settings:
Toggle ZigZag line display on/off
Separate colors for upward and downward price swings
Adjustable line width
Use Cases
1. Market Structure Analysis
Identify key swing points to understand the current market structure and trend direction. The adaptive invalidation feature ensures you're always looking at the most relevant pivots.
2. Support and Resistance Identification
Use confirmed swing highs and lows as potential support and resistance levels for entry and exit planning.
3. Trend Confirmation
The ZigZag visualization helps confirm trends by showing the sequence of higher highs and higher lows (uptrend) or lower highs and lower lows (downtrend).
Disclaimer
This indicator is designed as a technical analysis tool and should be used in conjunction with other forms of analysis and proper risk management. Past performance does not guarantee future results, and traders should thoroughly test any strategy before implementing it with real capital.

Frankator BBRSI🧭Strategy Description of Frankator BBRSI: Bollinger Bands + RSI Signal (only on 5 min chart)
Overview
This indicator combines Bollinger Bands and the Relative Strength Index (RSI) to identify potential overbought and oversold market conditions.
It generates buy and sell signals when the price reaches extreme levels confirmed by RSI momentum — helping traders anticipate potential reversals or continuation setups.
📊 How It Works
Bollinger Bands
The script plots three lines:
Upper Band: SMA + (Standard Deviation × Multiplier)
Basis (Middle Band): Simple Moving Average (SMA)
Lower Band: SMA - (Standard Deviation × Multiplier)
When the price touches or breaks the upper band, it may indicate an overbought market.
When the price touches or drops below the lower band, it may indicate an oversold market.
RSI Confirmation
RSI measures momentum to confirm whether the market is truly overbought or oversold.
Default RSI levels:
Overbought: RSI > 70
Oversold: RSI < 30
Signal Conditions
Buy Signal:
Price closes at or below the lower Bollinger Band
RSI < 30 (oversold)
A green triangle appears below the candle
Sell Signal:
Price closes at or above the upper Bollinger Band
RSI > 70 (overbought)
A red triangle appears above the candle
Alerts
You can set TradingView alerts for automatic notifications when either a Buy or Sell condition is met.
Go to “Add Alert” → “Condition” → Choose this indicator → Select Buy/Sell Signal, or Any alert for both alerts.
⚠️ Disclaimer
This indicator is a technical analysis tool, not a guarantee of future performance. Always use proper risk management and confirm signals with other indicators or price patterns before entering trades.

EAGLE_HUNTER MSB + Retest + Momentum (v1)This indicator detects Market Structure Breaks (MSB) and confirms them with retest validation and momentum strength filters.
It helps traders identify high-probability breakouts and avoid false signals during weak momentum phases.
Combining structure analysis, volume dynamics, and momentum confirmation, it provides clean visual signals for both trend continuation and reversal setups.
Core Features:
• Automatic MSB detection with visual break markers
• Retest confirmation (validated structure re-entry)
• Momentum filter to remove weak breakouts
• Supports both bullish and bearish structures
• Ideal for 15m, 1H, and 4H timeframes
Note:
Protected script – source code is hidden.
For educational and analysis purposes only.
