Relative Performance Binary FilterDescription:
This indicator monitors the relative performance of 30 selected crypto assets and generates a binary signal for each: 1 if the asset’s price has increased above a user-defined threshold over a specified lookback period, 0 otherwise. The script produces a JSON-formatted output suitable for webhooks, allowing you to send the signals to external applications like Google Sheets.
Key Features:
Configurable lookback period, price source, and performance threshold.
Supports confirmed or real-time bar data.
Monitors 30 crypto assets simultaneously.
Produces a one-line JSON output with batch grouping for easy webhook integration.
Includes an optional visual sum plot showing how many assets are above the threshold at any time.
Use Cases:
Automate performance tracking across multiple crypto assets.
Feed binary signals into external dashboards, trading bots, or Google Sheets.
Quickly identify which assets are outperforming a set threshold.
Webhook

EMA + RSI Autotrade Webhook - VarunOverview
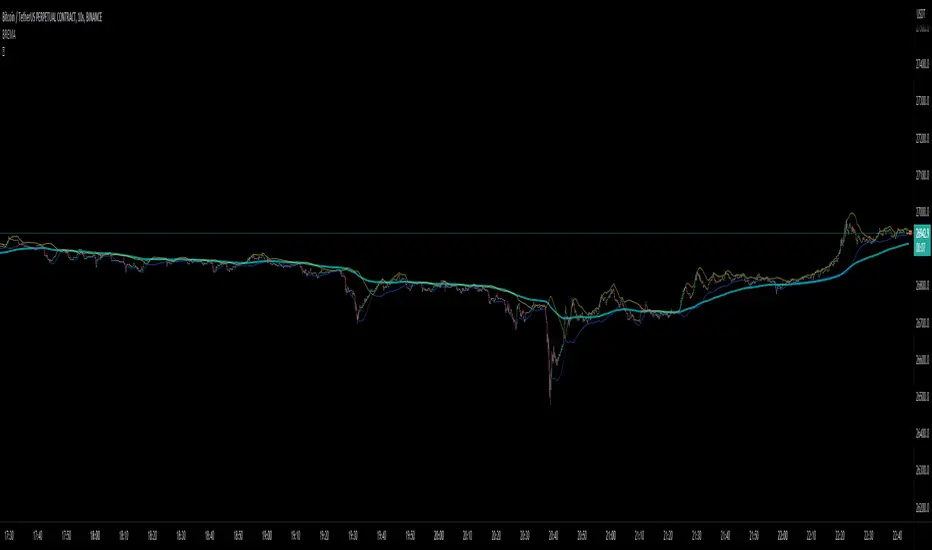
The EMA + RSI Autotrade Webhook is a powerful trend-following indicator designed for automated crypto futures trading. This indicator combines the reliability of Exponential Moving Average (EMA) crossovers with RSI momentum filtering to generate high-probability buy and sell signals optimized for webhook integration with crypto exchanges like Delta Exchange, Binance Futures, and Bybit.Key Features
Simple & Effective: Uses proven EMA 9/21 crossover strategy
RSI Momentum Filter: Eliminates low-probability trades in ranging markets
Webhook Ready: Two clean alerts (LONG Entry, SHORT Entry) for seamless automation
Exchange Compatible: Works with Delta Exchange, 3Commas, Alertatron, and other webhook platforms
Zero Lag Signals: Real-time alerts on crossover confirmation
Visual Clarity: Clean chart markers for easy signal identification
How It Works
Entry Signals:
LONG Entry: Triggers when EMA 9 crosses above EMA 21 AND RSI is above 52 (bullish momentum confirmed)
SHORT Entry: Triggers when EMA 9 crosses under EMA 21 AND RSI is below 48 (bearish momentum confirmed)
Technical Components:
Fast EMA: 9-period (tracks short-term price action)
Slow EMA: 21-period (identifies primary trend)
RSI: 14-period (confirms momentum strength)
RSI Long Threshold: 52 (filters weak bullish signals)
RSI Short Threshold: 48 (filters weak bearish signals)
Best Use Cases
Crypto Futures Trading: Bitcoin, Ethereum, Altcoin perpetual contracts
Automated Trading Bots: Integration with Delta Exchange webhooks, TradingView alerts
Timeframes: Optimized for 15-minute charts (works on 5min-1H)
Markets: Trending crypto markets with clear directional moves
Risk Management: Best used with 1-2% stop loss per trade (managed externally)
Webhook Automation Setup
Add indicator to your TradingView chart
Create alerts for "LONG Entry" and "SHORT Entry"
Configure webhook URL from your exchange (Delta Exchange, Binance, etc.)
Use alert message: Entry LONG {{ticker}} @ {{close}} or Entry SHORT {{ticker}} @ {{close}}
Exchange automatically reverses positions on opposite signals
Advantages
✅ No manual trading required - fully automated
✅ Eliminates emotional trading decisions
✅ Catches trending moves early with EMA crossovers
✅ RSI filter reduces whipsaws in choppy markets
✅ Works 24/7 without monitoring
✅ Simple two-alert system (easy to manage)
✅ Compatible with multiple exchanges via webhooksStrategy Philosophy
This indicator follows a trend-following with momentum confirmation approach. By waiting for both EMA crossover AND RSI confirmation, it ensures you're entering trades with genuine momentum behind them, not just random price noise. The tight RSI thresholds (52/48) keep you aligned with the prevailing trend.Recommended Settings
Timeframe: 15-minute (primary), 5-minute (scalping), 1-hour (swing)
Markets: BTC/USDT, ETH/USDT, high-liquidity altcoin perpetuals
Position Sizing: 100% capital per signal (exchange manages reversals)
Stop Loss: 2% (managed via exchange or external bot)
Leverage: 1-2x for conservative approach, up to 5x for aggressive
Important Notes
⚠️ This indicator generates entry signals only - position reversals are handled automatically by your exchange
⚠️ Always backtest on historical data before live trading
⚠️ Use proper risk management and position sizing
⚠️ Best performance in trending markets; may generate false signals in tight ranges
⚠️ Requires TradingView Premium or higher for webhook functionalityTags
cryptocurrency futures automated-trading ema-crossover rsi webhook delta-exchange tradingview-alerts trend-following momentum bitcoin ethereum crypto-bot algo-trading 15-minute-strategy

AI Bot Regime Feed (v6) — stableThis indicator generates real-time, structured JSON alerts for external trading bots or automation systems.
It combines multiple technical layers to identify market regimes and high-probability buy/sell events, and sends them to any webhook endpoint (e.g., a FastAPI or Zapier listener).

Outside the Bollinger Bands Alerting Indicator Overview
The Outside the Bollinger Bands Alerting Indicator is a comprehensive technical analysis tool that combines multiple proven
indicators into a single, powerful system designed to identify high-probability reversal patterns at Bollinger Band extremes. This
indicator goes beyond simple band touches to detect sophisticated pattern formations that often signal strong directional moves.
Key Features & Capabilities
🎯 Advanced Pattern Recognition
Bollinger Band Breakout Patterns
- Detects "pierce-and-reject" formations where price breaks through a Bollinger Band but immediately reverses back inside
- Identifies failed breakouts that often lead to strong moves in the opposite direction
- Combines multiple confirmation signals: engulfing candle patterns, MACD momentum, and ATR volatility filters
- Visual alerts with symbols positioned below (bullish) or above (bearish) candles
Tweezer Top & Bottom Patterns
- Identifies consecutive candles with nearly identical highs (tweezer tops) or lows (tweezer bottoms)
- Requires at least one candle to breach the respective Bollinger Band
- Confirms reversal with directional close requirements
- Customizable tolerance settings for pattern sensitivity
- Visual alerts with ❙❙ symbols for easy identification
📊 Multi-Indicator Integration
Bollinger Bands Indicator
- Dual-band configuration with outer (2.0 std dev) and inner (1.5 std dev) bands that can be adjusted to suit your own parameters
- Configurable MA types: SMA, EMA, SMMA (RMA), WMA, VWMA
- Customizable length, source, and offset parameters
- Color-coded band fills for visual clarity
Moving Average Suite
- EMA 9, 21, 50, and 200 (individually toggleable)
- Special "SMA 3 High" for help visualizing and detecting Bollinger Band break-outs
- Dynamic color coding based on price relationship
Optional Ichimoku Cloud overlay
- Complete Ichimoku implementation with customizable periods
- Dynamic cloud coloring based on trend direction
- Toggleable overlay that doesn't interfere with other indicators
🚨 Comprehensive Alert System
Real-Time JSON Alerts
- Sends structured data on every confirmed bar close
- Includes all indicator values: BB levels, EMAs, MACD, RSI
- Contains signal states and crossover conditions
- Perfect for automated trading systems and webhooks
{"timestamp":1753118700000,"symbol":"ETHUSD","timeframe":"5","price":3773.3,"bollinger_bands":{"upper":3826.95,"basis":3788.32,"lower":3749.68},"emas":{"ema_9":3780.45,"ema_21":3788.92,"ema_50":3800.79,"ema_200":3787.74,"sma_3_high":3789.45},"macd":{"macd":-10.1932,"signal":-11.3266,"histogram":1.1334},"rsi":{"rsi":40.5,"rsi_ma":39.32,"level":"neutral"}}
Specific Alert Conditions
- MACD histogram state changes (rising to falling, falling to rising)
- RSI overbought/oversold crossovers
- All pattern detections (BB Bounce, Tweezer patterns)
- Bollinger Band breakout alerts
🎨 Visual Elements
Pattern Identification
- ♻ symbols for Bollinger Band breakout patterns (green for bullish, red for bearish)
- ❙❙ symbols for tweezer patterns (green below for bottoms, red above for tops)
- Color-coded band fills for trend visualization
Chart Overlay Options
- All moving averages with distinct colors
- Bollinger Bands with inner and outer boundaries
- Optional Ichimoku cloud with trend-based coloring
Trading Applications
Reversal Trading
- Identify high-probability reversal points at extreme price levels
- Use failed breakout patterns for entry signals
- Combine multiple timeframes for enhanced accuracy
Trend Analysis
- Monitor moving average relationships for trend direction
- Use Ichimoku cloud for trend strength assessment
- Track momentum with MACD and RSI integration
Risk Management
- ATR-based volatility filtering reduces false signals
- Multiple confirmation requirements improve signal quality
- Real-time alerts enable prompt decision making
Suggested Use
- Use on multiple timeframes for confluence
- Combine with support/resistance levels for enhanced accuracy
- Set up alerts for hands-free monitoring
- Customize settings based on market volatility and trading style
- Consider volume confirmation for stronger signals

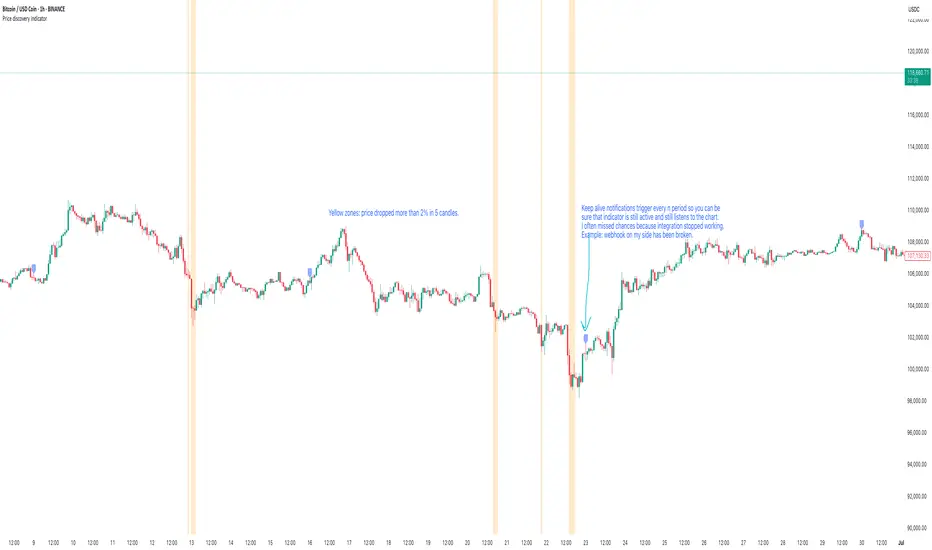
Price discovery indicatorGives an ability to show places where price drops more than n percent in x candles. Use cases: see dips of btc, get a notification when a stablecoin goes crazy, validate that webhook integration works as expected using keep alive messages.
Features included:
- Price dip alerts. Create an alert that sends a notification every time price dips more than expected (yellow zone at the chart).
- Percentage drop threshold. Define how many percents price should drop to trigger an alert and to show a yellow zone.
- Candles length threshold. Define within how many candles this drop should happen. If price drops in 2% within 10 candles, but this option is 5 - the alert will not be triggered because price dropped not as fast as expected.
- Templates of messages on price dip and price recovery. Set your message that should be triggered with alert.
- Keep alive feature. Set to trigger keep alive alerts every period. Can be helpful if you don't check charts often - this feature will trigger alert every period with "hey, the integration is alive" message. I use it to validate on weekly basis that tradingview triggers my alerts (example: you created an alert with expiration date and forgot to recreate it), that webhook integration receives these alerts, that the integration sends these alerts to telegram. Example: I expect to see this message every monday's morning, otherwise something is broken and I have to check what is wrong with my alerting system.
Entry Alert BotThis bot is SIMPLY to trigger an external webhook. You simply enter you take profit, entry, and stop loss %, and it will auto-populate the variables listed to the calculated values. That is all this script does. It does draw the trade on the chart for you. If you want a long, and price crosses up over you entry it will trigger the webhook. If you want a short and price crosses below your entry, it will trigger the webhook.

Trade Ideas to Discord WebhookTakes basic user inputs for entries, exits, stop loss and leverage.
Converts all inputs (removing unused ones) to an alert message.
Intended for use as a single alert / message.
Alert will fire as soon as activated - after that you should delete the alert to prevent multiple alerts being fired on subsequent candles.
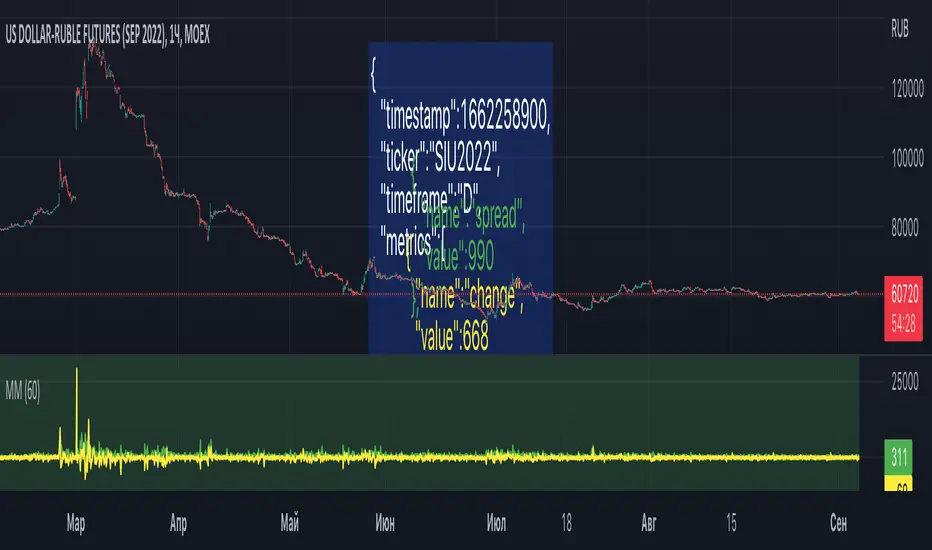
Market MonitorThe script can be used to send a JSON message to the webhook once per time. For example, to store market conditions in an external database. The latter is make sense for smaller timeframes due to TradingView limitations on the number of available bars. The interval between messages can be set in the settings. To set up transmitted market metrics, you will probably need to modify the script code to add metrics that are important to you.
Divergence of DecisionPoint Breadth Swenlin Trading [LazyBear]// This source code is subject to the terms of the Mozilla Public License 2.0 at mozilla.org
// © 03.freeman
//This is indicator from LazyBear is very accurate for stocks and indexes.
//I added some code snippets for spot and draw divergences automatically
//
// @author LazyBear
//
//
Best use with daily time frame.
Enter when a divergence is found (Bull or Bear label) and wait at least a couple of candles before exit.
Next improvement: alerts ready made for webhooks and screener for multiple tickers.
Please use comment section for any feedback.

Study for Squeeze Momentum Indicator [LazyBear]This study is based on LazyBear Squeeze Momentum Indicator and my strategy developed using it.
I added some custom feature and filters.
Main improvements are:
1- study is updated to version 4 of pine script;
2- I added alerts for entry rules and exit rules.
3- Alert syntax can be customized for webhooks: I added one example only for long entry.
You can customize a lot of features to get a profitable strategy.
Here is a link to original study.
Please use comment section for any feedback.
