Institutional Support/Resistance Locator🏛️ Institutional Support/Resistance Locator
Overview
The Institutional Support/Resistance Locator identifies high-probability demand and supply zones based on strong price rejection, large candle bodies, and elevated volume . These zones are commonly targeted or defended by institutional participants, helping traders anticipate potential reversal or continuation areas.
⸻
How It Works
The indicator uses a confluence of conditions to detect zones:
• Large Body Candles: Body size must exceed the moving average body size multiplied by a user-defined factor.
• High Volume: Volume must exceed the moving average volume by a configurable multiplier.
• Wick Rejection: Candles must show strong upper or lower wicks indicating aggressive rejection.
• If all criteria are met:
• Bullish candles form a Demand Zone.
• Bearish candles form a Supply Zone.
Each zone is plotted for a customizable number of future bars, representing areas where institutions may re-engage with the market.
⸻
Key Features
• ✅ Highlights institutional demand and supply areas dynamically
• ✅ Customizable sensitivity: body, volume, wick, padding, and zone extension
• ✅ Zones plotted as translucent regions with auto-expiry
• ✅ Works across all timeframes and markets
⸻
How to Use
• Trend Traders: Use demand zones for potential bounce entries in uptrends, and supply zones for pullback short entries in downtrends.
• Range Traders: Use zones as potential reversal points inside sideways market structures.
• Scalpers & Intraday Traders: Combine with volume or price action near zones for refined entries.
Always validate zone reactions with supporting indicators or price behavior.
⸻
Why This Combination?
The combination of wick rejection, volume confirmation, and large candle structure is designed to reflect footprints of smart money. Rather than relying on fixed pivots or subjective zones, this logic adapts to the current market context with statistically grounded conditions.
⸻
Why It’s Worth Using
This tool offers traders a structured way to interpret institutional activity on charts without relying on guesswork. By plotting potential high-impact areas, it helps improve reaction time.
⸻
Note :
• This script is open-source and non-commercial.
• No performance guarantees or unrealistic claims are made.
• It is intended for educational and analytical purposes only.
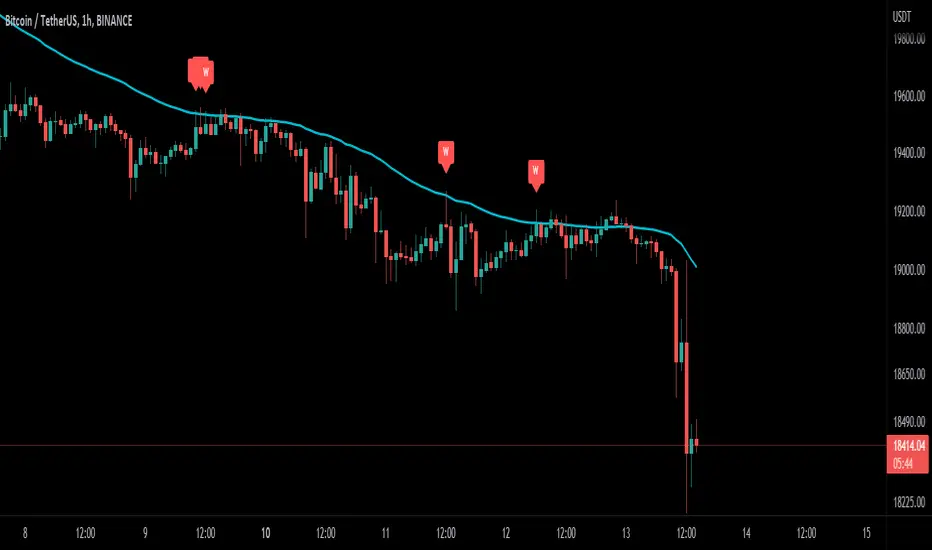
Wickrejection

Wick-off Check Moving Average [Misu]█ This Indicator shows a wick-off check pattern applied to a moving average.
This pattern appears when a candle opens below the moving average and closes above it, or when it opens above a moving average and closes below it. This causes a wick to go through the moving average: a wick-off check moving average.
█ Usages:
This indicator detects small pullbacks in a trend. This is mainly used for trading continuation strategies.
It can also be used to validate a resistance or support level .
█ Features:
> Average Wick Validation: You can validate a wick-off check pattern depending on the average wick size. This is configured with parameters "Lenght Avg Wick Validation" and "Factor Wick Validation".
> Trend Validation: A trend is taken into account when detecting a "continuation pattern". A trend is validated if X candles close above (up trend) or under (down trend) the moving average. This "X" is defined by "Length Bar - Trend Validation" parameter.
> Buy and Sell: Labels are showing wick-of check patterns but can be interpreted as a buy & sell signal.
> Multi Moving Average.
> Alerts.
█ Parameters:
Method Multi MA : The method for calculating the moving average.
Multi MA Length : The length used to calculate the moving average.
Length Bar - Trend Validation : Define the number of bar needed to validate a trend. When price is above the MA, trend is up. When price is under MA, trend is down.
Wickoff Mode : Mode used to detect Wickoff check pattern.
> continuation pattern: only shows wick-off check pattern in a confirmed trend.
> no trend in progress: only shows wick-off check pattern in a not confirmed trend.
> both: shows both.
Lenght Avg Wick Validation : Lenght used to calculate the average wick size.
Factor Wick Validation : Factor used to validate the length of a wick when a wick-off check is detected.
Wick Pressure by SiddWolfMultiple Wicks forming at OverSold & OverBought levels create Buying and Selling Pressure. This Script tries to capture the essence of the buy and sell pressure created by those wicks. Wick pressure shows that the trend is Exhausted.
How it works:
This Wick Pressure Indicator checks for three candles forming the wicks in overbought and oversold zones. The zones are set by RSI and can be changed in settings. Those three candles should form a bit long wick and length of the wick is determined by ATR. The ATR multiple can be changed from settings. And then the script draws a box in the area formed by three candle wicks.
Confluence:
This indicator should not be used on its own. You should include it in your existing trading strategy. Any indicator should be rigorously tested before making any real trades.
Settings is the Key:
Settings are key to all of my indicators. Play around with it a bit. Change the ATR multiplier. Read the tooltips to understand what each settings mean. Tooltips are the (i) button in-front of each settings.
FAQs:
Q. Does the indicator Repaint ?
--- No. None of my indicators repaints. What you see now is what's drawn in real time.
Q. Indicator doesn't show anything ?
--- Maybe you've messed up the settings so reset it. or try different coin/stock.
Q. Does this indicator give financial advice?
--- No. Nope. Nein. Não. नहीं.
Conclusion:
This indicator is very basic but if used correctly it can be very powerful. Hit me up if you'd like to see the screener/scanner for this or any of my indicators. If you have any questions or suggestions feel free to comment below. I'd love to connect with you. Thank you.
~ SiddWolf
