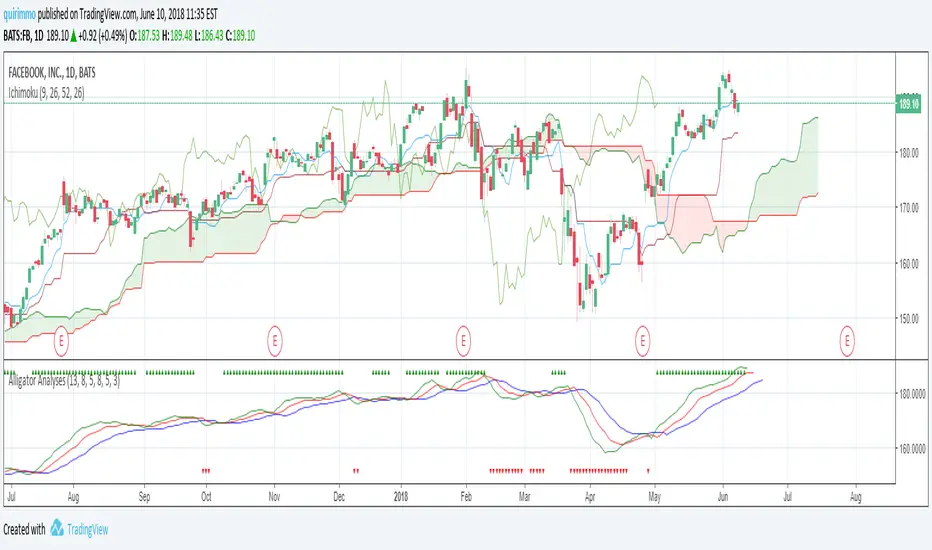
Alligator AnalysesA simple script in order to plot the Alligator Indicator with triangles plotted on the graph in order to see directly if the alligator is sleeping or eating.
You will see green up triangles when the alligator is bullish eating, while red down triangles when the alligator is bearish eating.
You will not see anything on the chart when the alligator is sleeping.
Pengayun Williams
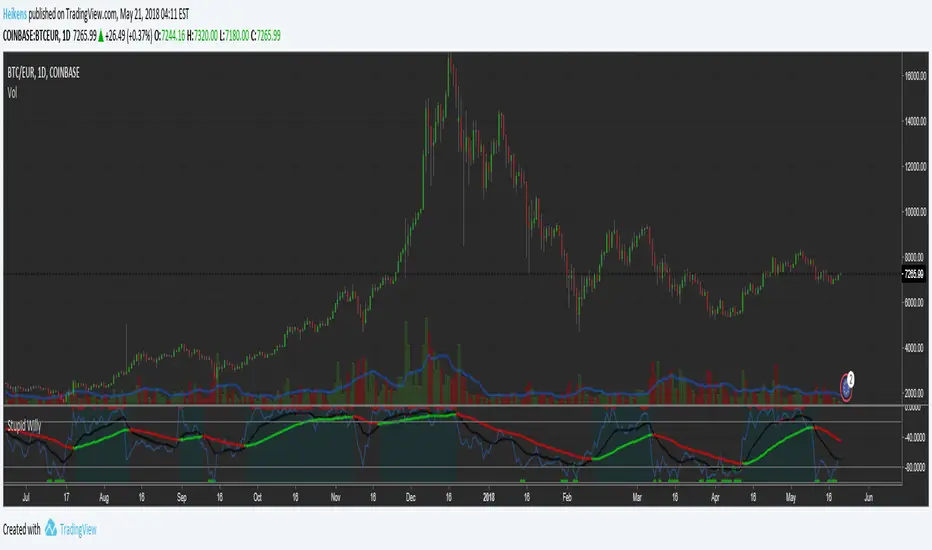
"Cycling Willy" Indicator very good tbuy/sell/trend signals!This oscillator is based on the williams%R combined with EMA's for better signals. it shows momentum and ob/os signals and indicates market cycles.
you can switch between the two EMA's for more direct or filtered signals and smooth the %R if needed.
i added 4 alertconditions to be triggered on crossovers of signal EMA and Filter EMA.
please let me know in the comments what you think about the indicator!!
happy trading!
Willy Magnus
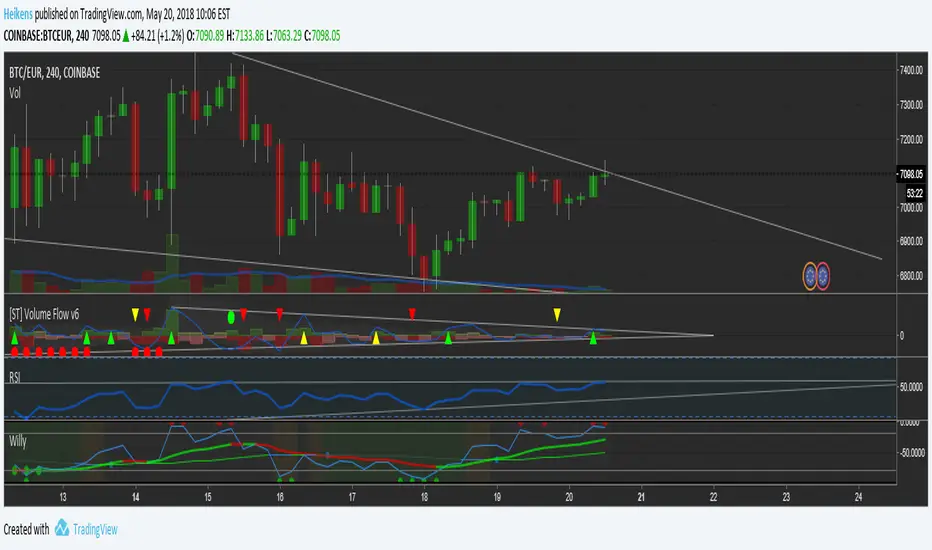
williams%R with EMA's tot filter out noise and trend signals. bgcolor to indicate cycles with top/bottom signals.
inspired on the rational flibbr and magnus indicators by magnus tradinggroup and flibbr!
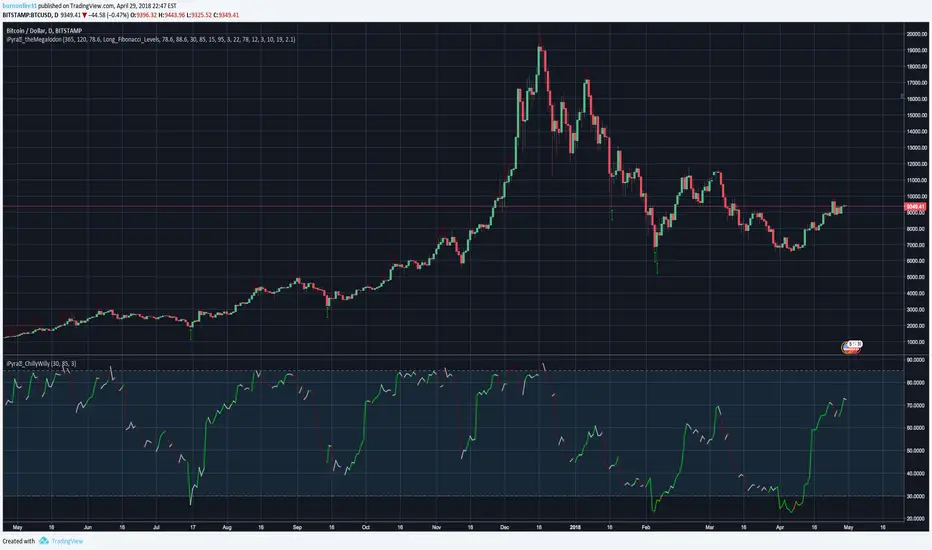
iPyra◬_ChillyWillyCHILLYWILLY
ChillyWilly looks for the momentum trades.
ChillyWilly combines the 4 different well known momentum indicators to bring the best signals.
ChillyWilly works with any kind of market state, any kind of trading, and any kind of asset.
ChillyWilly has more features than any other momentum indicator in the market: Combining shorter term momentum with longer term momentum, and looking for M's and W's for you.
--------------------------------------
ChillyWilly is designed for longer time frame traders and investors.
All you have to do is:
1- Use it like you would use RSI (ChillyWilly is ranging between 0-100 --> Closer to 0 means Long ~~ Closer to 100 means short)
2- Look for green or orange lines. (Orange means momentum is BOTH in a good location to long and showing a W ; Green means EITHER momentum is in a good location to long or showing a W)
3- Look for red or maroon lines. (Red means momentum is BOTH in a good location to short and showing a M ; Green means EITHER momentum is in a good location to short or showing a M)
------------------------------------------------------------
iPyra◬
Enlighten others
Cryptopeep RSI, Stochastic RSI, Stochastic and Williams %R, 4in14 Charts all in one chart, RSI, Stochastic RSI, Stochastic and Williams %R
Hope you like, please let me know your thoughts.
If you would like to be kept up to date please FOLLOW us and try our indicators and strategies here: uk.tradingview.com
If you like it please click the LIKE button.


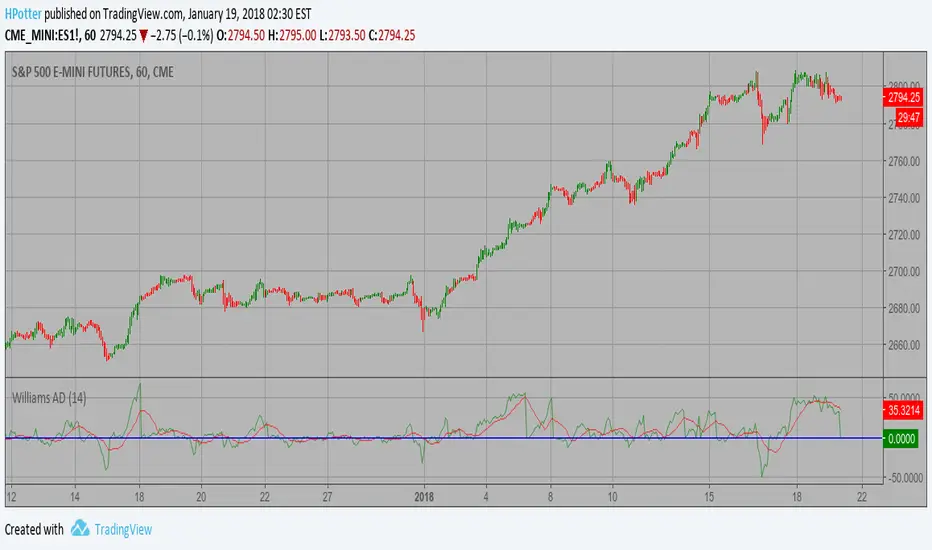
Smoothened Williams A/D Strategy Accumulation is a term used to describe a market controlled by buyers;
whereas distribution is defined by a market controlled by sellers.
Williams recommends trading this indicator based on divergences:
Distribution of the security is indicated when the security is making
a new high and the A/D indicator is failing to make a new high. Sell.
Accumulation of the security is indicated when the security is making
a new low and the A/D indicator is failing to make a new low. Buy.
WARNING:
- This script to change bars colors.
Williams Accumulation/Distribution (Williams AD) Strategy Accumulation is a term used to describe a market controlled by buyers;
whereas distribution is defined by a market controlled by sellers.
Williams recommends trading this indicator based on divergences:
Distribution of the security is indicated when the security is making
a new high and the A/D indicator is failing to make a new high. Sell.
Accumulation of the security is indicated when the security is making
a new low and the A/D indicator is failing to make a new low. Buy.
WARNING:
- This script to change bars colors.

AO and AC Zones (Bill Williams)The colored Zones is the combination of the Awesome Oscillator (AO) and Accelerator Oscillator (AC) indicator by Bill Williams.
If both AO and AC bars are uptrending, the zone is blue
If both AO and AC bars are downtrending, the zone is red
If AO and AC have different colors, the zone is gray
Blue and red zones
This zones allows you to trade more aggressively, you could also add to current positions
Gray zone
You should avoid those flat (or choppy) market and don't open new positions or add to your current ones
You could use this indicator also in combination with MACD.
Please always remember, there is no holy grail indicator!
Klinger Volume Oscillator (KVO) Strategy The Klinger Oscillator (KO) was developed by Stephen J. Klinger. Learning
from prior research on volume by such well-known technicians as Joseph Granville,
Larry Williams, and Marc Chaikin, Mr. Klinger set out to develop a volume-based
indicator to help in both short- and long-term analysis.
The KO was developed with two seemingly opposite goals in mind: to be sensitive
enough to signal short-term tops and bottoms, yet accurate enough to reflect the
long-term flow of money into and out of a security.
The KO is based on the following tenets:
Price range (i.e. High - Low) is a measure of movement and volume is the force behind
the movement. The sum of High + Low + Close defines a trend. Accumulation occurs when
today's sum is greater than the previous day's. Conversely, distribution occurs when
today's sum is less than the previous day's. When the sums are equal, the existing trend
is maintained.
Volume produces continuous intra-day changes in price reflecting buying and selling pressure.
The KO quantifies the difference between the number of shares being accumulated and distributed
each day as "volume force". A strong, rising volume force should accompany an uptrend and then
gradually contract over time during the latter stages of the uptrend and the early stages of
the following downtrend. This should be followed by a rising volume force reflecting some
accumulation before a bottom develops.
WARNING:
This script to change bars colors.

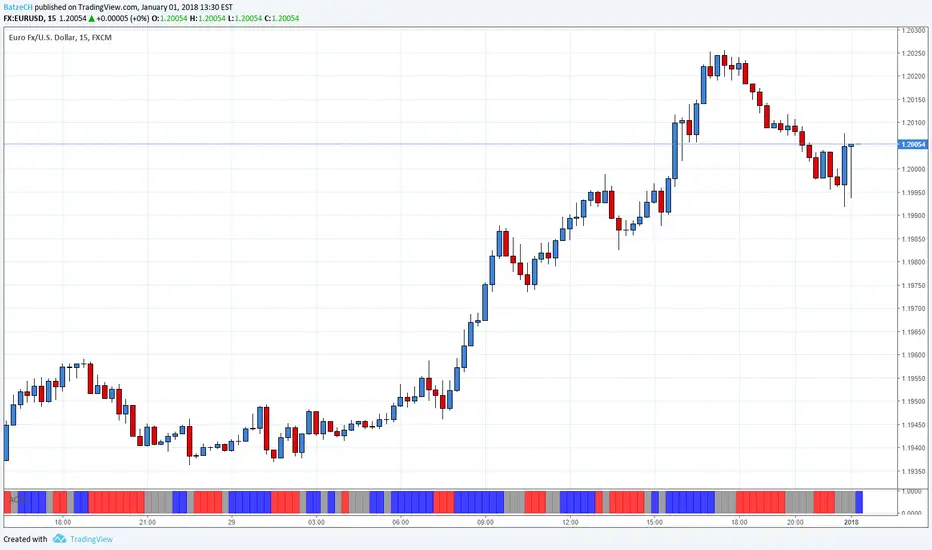
Colored Williams %RThis script is the same as Williams %R except that on green days we plot green and red on red days. If a bar opens and closes the same, we plot black.

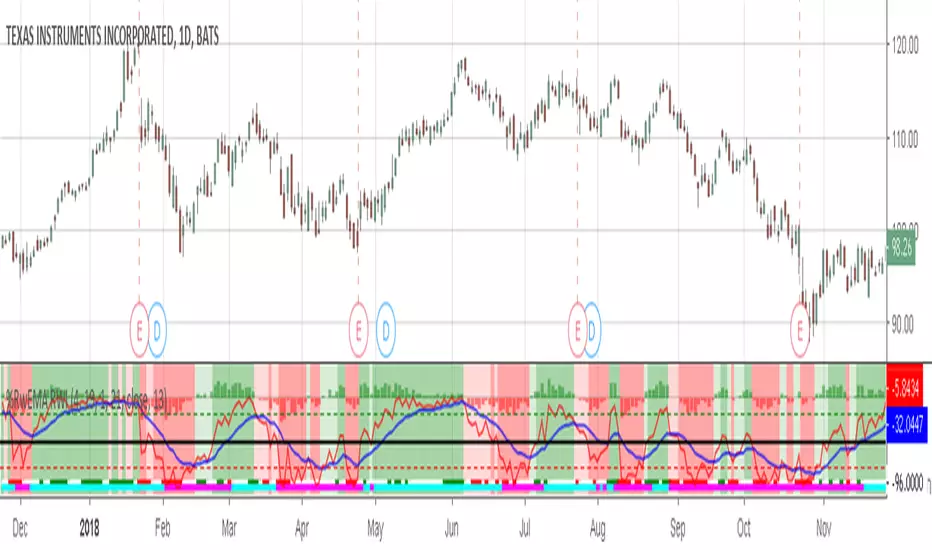
Willams %RwEMAspy
Was looking for something else when surfed into an old question
wanting %R 21 period with EMA 13 period of the %R signal
and being a rookie at this, made this code to post for them.
Tried to comment the script in such a way that other rookies
like me could make better sense of what is being done. Hope
this helps someone. I find it useful as one of my indicators for
trading.
Pinescript for tradingview.com user Tom1trader
All time frames.
Interpretation:
%R (Red) crosses above it's average (Blue) - bull
%R crosses below it's average - bear. Background
color changes green-up red-down with above crossings.
Most but not all of serious price movement takes place
from the time the %R (red) goes into oversold (or bought) and
exits again.
%R centerline crosses can also be useful.
I use various indicators and want all of the confirmation
that I can get for expectations BUT I never know what the
next bar will do and define my risks accordingly.
COT Williams Indicator by BWThis indicator can be thrown on any future contract (such as ES, GC, ZW, ZL, E6, PR, ZC etc.). It shows the Williams Indicator as defined in his book "Trad Stocks Commodities with the Insiders" (2005).

Williams Accumulation/Distribution (Williams AD) Accumulation is a term used to describe a market controlled by buyers;
whereas distribution is defined by a market controlled by sellers.
Williams recommends trading this indicator based on divergences:
Distribution of the security is indicated when the security is making
a new high and the A/D indicator is failing to make a new high. Sell.
Accumulation of the security is indicated when the security is making
a new low and the A/D indicator is failing to make a new low. Buy.

SMI Ergodic Oscillator The SMI Ergodic Indicator is the same as the True Strength Index (TSI) developed by
William Blau, except the SMI includes a signal line. The SMI uses double moving averages
of price minus previous price over 2 time frames. The signal line, which is an EMA of the
SMI, is plotted to help trigger trading signals. Adjustable guides are also given to fine
tune these signals. The user may change the input (close), method (EMA), period lengths
and guide values.
You can use in the xPrice any series: Open, High, Low, Close, HL2, HLC3, OHLC4 and ect...

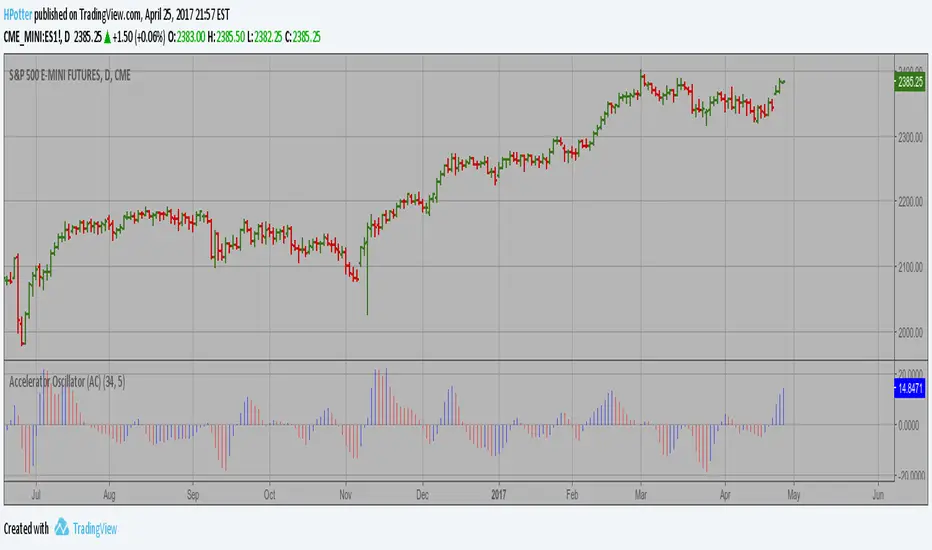
Accelerator Oscillator (AC) The Accelerator Oscillator has been developed by Bill Williams
as the development of the Awesome Oscillator. It represents the
difference between the Awesome Oscillator and the 5-period moving
average, and as such it shows the speed of change of the Awesome
Oscillator, which can be useful to find trend reversals before the
Awesome Oscillator does.
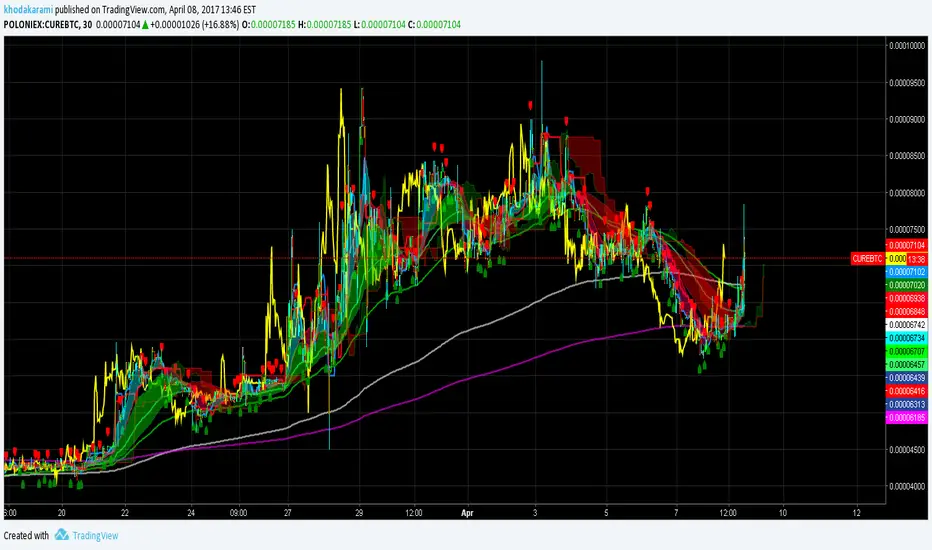
Guerrilla AdvancedThis indicator was designed with people without Pro License in mind (Including many of my close friends).
Basically, you will get a combo of few different tools in one box, with ability to turn them on and off with a single check mark, also, you have total control over the input numbers that was used in calculations if you so want to, for example, sometimes when i see a massive bullish up trend, i reduce the short rally from 12 to 8 even 6 to get faster signal for selling the trend.
So, what will you get in this pack?
1- Ichimoko. Yes, you heard it right, although we have it in the default tools but hey, it will use one indicator slot and if you don't have a pro license, you will use that slot
2- Rally. This is an old yet very powerful system for getting buy or sell signals, basically, you get two lines and for making the life easier i draw a cloud between them. when the trend passes above the cloud and it was bellow it in past, right after the very first candle that gets above the cloud you can put the buy order, and vice versa, the moment a candle body enters the cloud, if you want an aggressive signal, you can sell, if not, you may want to wait to see if the candles drop bellow the cloud or not then decide.
3- Resistance Support Cloud. Most of us always heard about resistance and support "lines" but many of us don't know that, in each trend, the trend line itself is a resistance or support line, and when you are going in a bullish or bearish tunnel, the floor and roof of tunnels are again resistance and supports, using this part of the tool, just like rally, you get a cloud that shows you the resistance / support "zone"
4- William Fractals. To be honest, I got this part of the code from another source available around. Why? looking at those fractal indicators, you can easily eyeball the trend line or existence of a tunnel.
5- Different EMA lines. If you are one of those people that use EMA lines for their trading, have fun with them, there are few different standard ones and even a custom one that you can put your desired number for it.
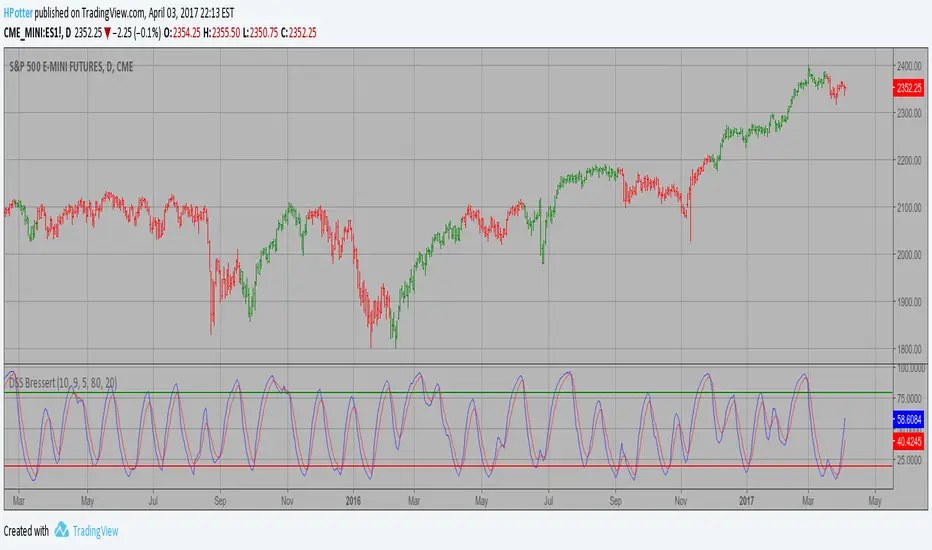
DSS Bressert (Double Smoothed Stochastic) Strategy Double Smoothed Stochastics (DSS) is designed by William Blaw.
It attempts to combine moving average methods with oscillator principles.
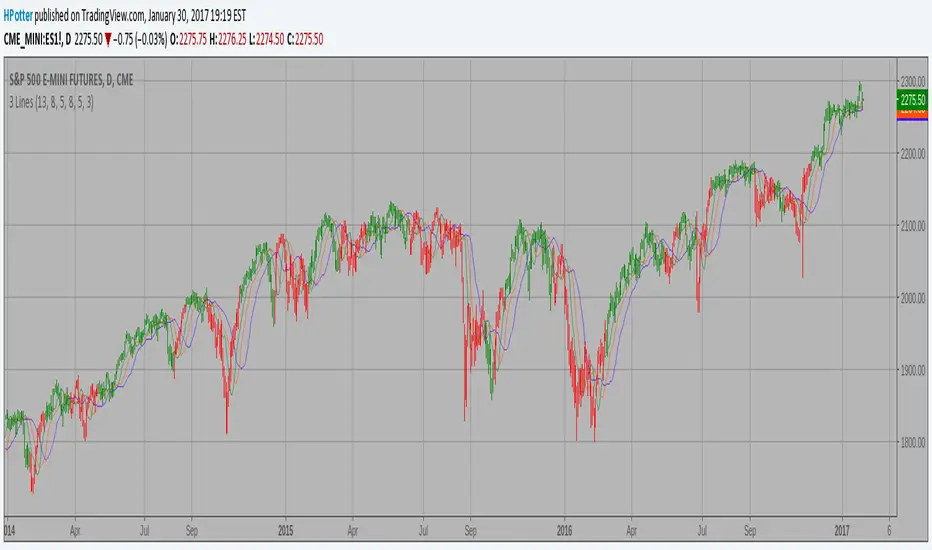
Bill Williams Averages. 3Lines Strategy This indicator calculates 3 Moving Averages for default values of
13, 8 and 5 days, with displacement 8, 5 and 3 days: Median Price (High+Low/2).
The most popular method of interpreting a moving average is to compare
the relationship between a moving average of the security's price with
the security's price itself (or between several moving averages).
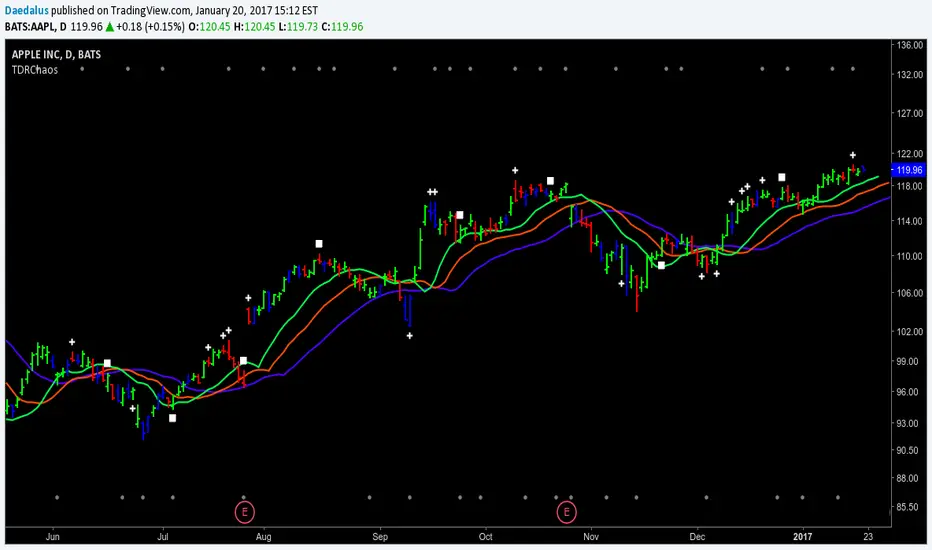
TDRChaos-2.0
TDR's version of the major Chaos Trading tools.
Williams' Alligator
Bullish/Bearish Divergent Bars (white cross above/below bar)
The three consecutive AO bars that start with the opposite bar first. (white square above/below bar)
Fractals (grey circle top/bottom)
*** NEW ***
Squat bars are painted "Blue" -> WARNING: (Does not work on BATS)
Be sure to start at thedaedalusreport.com
ChaosThis script adds a Bill Williams Alligator to your charts and the three wisemen:
1. Wiseman 1 - Bullish or bearish divergent bars shown with a circle (be sure to check angulation manually).
2. Wiseman 2 - Super AO - with a square.
3 Wiseman 3 - Fractal with a triangle.
Be sure to wait until the current bar is closed before using these signals.
Reference: TradingChaos Version 2

Williams %R I needed the %R code in one of my indicators and TradingVeiw have it hidden. So here is my attempt.
Williams Squat BarsSquat bars are a battle of the bulls and the bears, with lots of buying and selling but little price movement.
A squat bar will be one of the top three OR bottom three bars 85% of the time at the end of a trend.
While all trends end with a squat, all squats are NOT the end of a trend.
