Ultimate Pivot PointsLately, there are a plethora of Pivot scripts on TV, I'll be adding one more :3
This is a combination that I use for my personal use so I've coded accordingly. Its the best combination of the regular pivot, woodie pivot, fib, and cams, in my humble opinion. Also added previous day high and low as those are the key levels for intraday traders.
Also, this is a multi-timeframe version.
Enjoy~
Woodie

[Daveatt] BEST Trade Manager Pivots 1.0Hello BEST traders
The BEST Trade Manager got upgraded with many more features
This version allows setting automatically the TP levels on either Fibonacci/Traditional/Camarilla/Woodie pivots
I. 💎 SCRIPTS ACCESS 💎
1. Available only with one-time payment on my website.
2. My website URL is in this script signature at the very bottom (you'll have to scroll down a bit and going past the long description) and in my profile status available here: Daveatt
3. Many video tutorials explaining clearly how all our indicators work are available on your website > guides section.
4. You may also contact me directly for more information
II. 🔎 What is the BEST Trade Manager?🔎
2.1 Concept
The BEST Trade Manager is compatible with any indicator.
Once connected, it adds another layer of good stuff with real-time user custom defined stop loss (8 available options), take profits (4 possible options) + alerts compatible for trading automation.
2.2 How hard is it to update your indicator?
We'll send to our customers, a comprehensive and easy tutorial, to make any indicator compatible.
I guarantee you, it should take no more than 2 minutes per indicator. We made it easy, fun, and awesome. #bolder #statement
III. The amazing benefits of our Plug&Play system
I hope you're ready to be impressed. Because, what I'm about to introduce, is my best-seller feature - and available across many of my indicators.
The BEST Trade manager can be connected to any external indicator
Let's assume you want to connect your RSI divergence to your Trade Manager.
I mentioned an RSI divergence but you may connect any oscillator ( MACD, On balance volume, stochastic RSI, True Strenght index, and many more..) or non-oscillator (divergence, trendline break, higher highs/lower lows, candlesticks pattern, price action, harmonic patterns, ...) indicators.
THE SKY IS (or more likely your imagination) is the limit :)
We go in-depth on our website why the Plug&Play is an untapped opportunity for many traders out there - URL available on my profile status and signature
IV. 🧰 Features 🧰
Candles can be colored to highlight the trend direction better [/b [
4.1 Stop-Loss Management
For what's following, let's assume that 2 is the stop-loss value you inserted in the indicator, and the Algorithm Builder gives a BUY signal.
This is NOT a recommendation at all, only an example to explain how this feature works.
- %Trailing: The Stop-Loss starts 2% away from the entry price - and will move up (because we're on a BUY trade as per our example) every time your trade will gain 2% profit
- Pips Trailing: Same as above but using a distance in pips/USD value
- Percentage: The Stop-Loss stays static 2% away from the entry price. There is no trailing here
- TP Trailing: Trail your stop-loss every time a Take Profit level is hit
- Supertrend: embedded supertrend use as a trailing stop
- Fixed: Set the Stop-Loss at a fixed position (value should be in currency/units)
- ATR multiple: Set the Stop-loss at a multiple of ATR
- External connector: Let's say your indicator already contains embedded stop-loss levels, you can add them in the Trade Manager
4.2 Take Profits Management
You can manage up to 3 take profit levels defined as a percentage or price value or ATR multiple.
The expected input is in percentage value (for instance, setting the % target of TP1 to 2% will set the TP1 level 2% away from the entry price
This version allows setting automatically the TP levels on either Fibonacci/Traditional/Camarilla/Woodie pivots
4.3 Built-in Risk-to-Reward Panel with real-time analytics
The good stuff doesn't stop here.
You'll notice that this sometimes green (when in a LONG), sometimes red (when in a SHORT) panel at the right of your chart.
- Entry Price: the price when the Algorithm Builder will give a signal.
- The Trade PnL in percentage.
- Entry Stop Loss: Distance (in currency/units) between the selected stop-loss algorithm (percent, trailing, TP trailing, etc.) and the entry price.
- Entry TP1/TP2/TP3: Distance (in currency/units) between the entry price and the first take profit
- Risk/Reward TP1/TP2/TP3: Using the Stop-loss distance at entry, and Take Profit 1/2/3 at the entry to compute the risk-to-reward ratio.
- Max drawdown and Max opportunity (value and percentage): respectively the maximum loss and maximum win per trade
For more details, please check the guides section of my website. Links are in my signature and profile status.
V. 🔔 Alerts 🔔
We enabled the alerts on the:
1. Stop-Loss hit
2. Take Profit 1/2/3 hit
3. custom hard exits based on either MACD / RSI divergence/ MM cross
5.1 🤖 Compatible with trading bots? 🤖
It's compatible with all third-parties out there capturing alerts and forwarding them to the brokers.
We enabled TradingConnector and ProfitView alert templates so far.
If you have any doubts or questions, please hit me up directly or ask in the comments section of this script.
BEST regards,
Dave

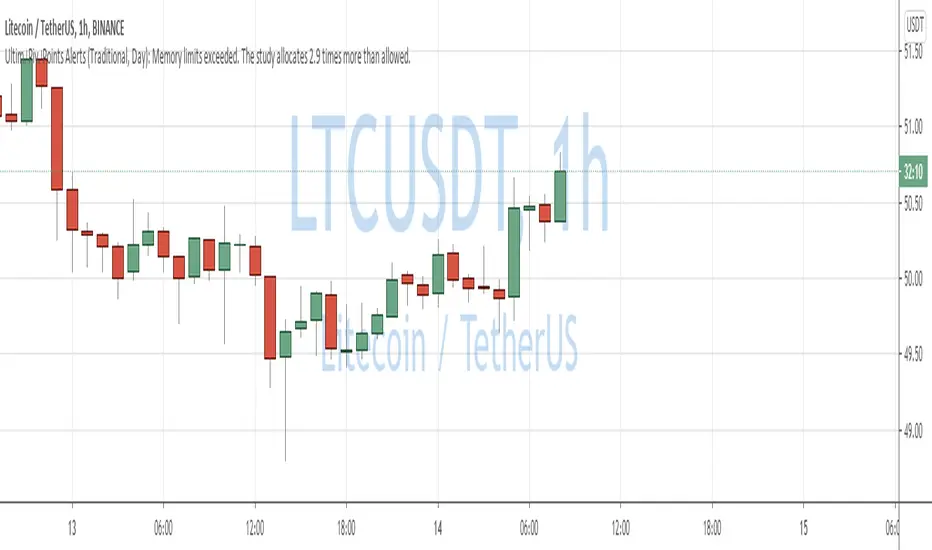
QuantNomad - Ultimate Pivot Points AlertsCreated a universal script for pivot points alerts.
In the script, you can choose one of 4 pivot point types: Traditional, Fibonacci, Woodie, and Camarilla.
You are able to create separate alerts for every level or create one for price crossing any level.
For separate levels, you can choose: "Cross", "Crossover" and "Crossunder".
You can also choose to show/hide:
Historical Levels
Levels Values
Current Levels - Levels calculated on the current period, on close of the period they will become valid levels for next periods. These levels do not participate in alerts calculations.
Because of some TradingView limitations, alerts won't be fired for the first bar of the session.
In the script used new v4 plotting features, so will be able to plot levels and labels nicely. Unfortunately, there is a limit on the number of consecutive lines you can plot on the plot (around 50), so historical lines in the past will disappear after 6-7 periods.
And remember:
Past performance does not guarantee future results.

Woodies SlopeThis is one of the few original things from woodie (At least I Hoope so lol). The slope indicator shows the direction of price movement, the possible future of market's movement, and beside them, it shows which side of the market has the power right now.
This indicator can be switched to use a smoothed version of RSI that is customized too.
Please, don't ask for access, only my students from my classes will have access to this indicator, at least for time being. If at any time in future I wish to sell, you will find the price and how to buy in the comments bellow.

Trader Set - Woodies Super CCIThis a color coded of woodies supper CCI, everyone knows about woodies CCI, but supper CCI is something he put in together lately, like some other things from his system, the original idea of color coding CCI on different lines was not his !
I moved the chopzone to 150, imo, chopzone sitting close to sidewinder gives easier feedback to read, also, if you notice, other than the base line's color code, i have two lines that are similar to eachother, these are showing the relative positions of turbo, cci, and regression with eachother, three circles at the right side show turbo, cci, and regression's positions relative to the horizontal zones. In other words, when things get really close to eachother, no more guessing needed. one more thing that I may add to this tommorrow is to put signalling signs on the lines when they cross to help identifying the crosses and the color would code you toward possible positions in "MY" system.
Please, don't ask for access, only my students from my classes will have access to this indicator, at least for time being. If at any time in future I wish to sell, you will find the price and how to buy in the comments bellow.

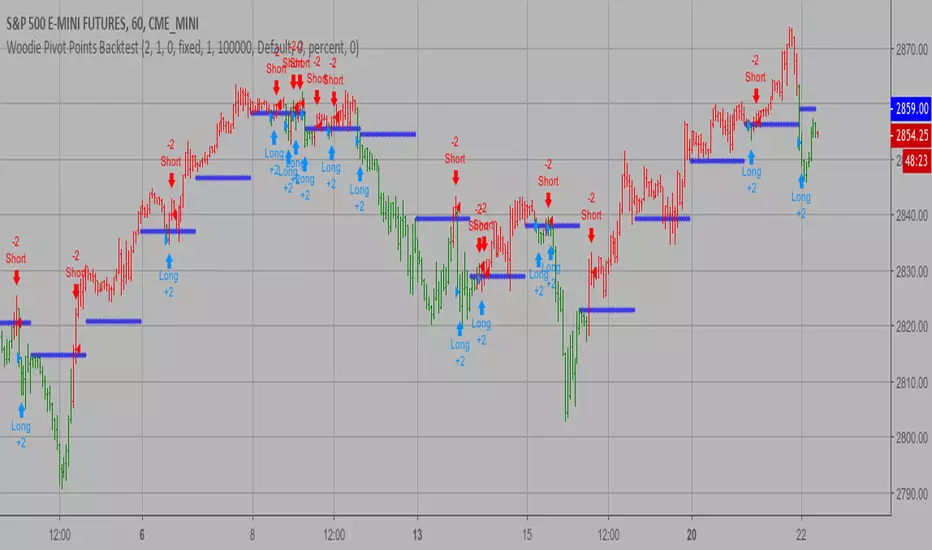
Woodie Pivot Points Backtest Simply input the vales of the high, low and closing price of the previous
period to calculate the Woodie pivot point and the associated resistance
and support levels for the present period.
You can change long to short in the Input Settings
WARNING:
- For purpose educate only
- This script to change bars colors.
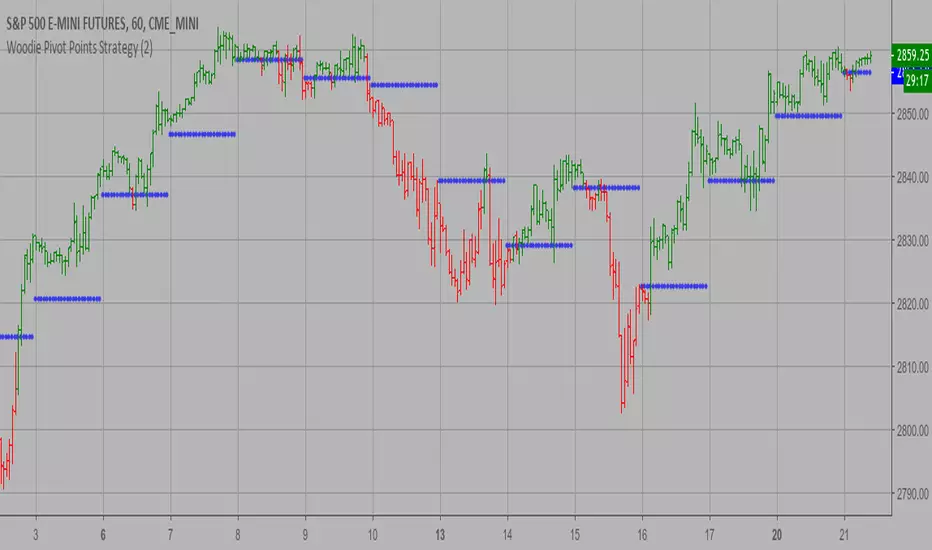
Woodie Pivot Points Strategy Simply input the vales of the high, low and closing price of the previous
period to calculate the Woodie pivot point and the associated resistance
and support levels for the present period.
WARNING:
- This script to change bars colors.