Jackson Volume breaker Indication# Jackson Volume Breaker Beta
### Advanced Volume Analysis Indicator
## Description
The Jackson Volume Breaker Beta is a sophisticated volume analysis tool that helps traders identify buying and selling pressure by analyzing price action and volume distribution. This indicator separates and visualizes buying and selling volume based on where the price closes within each candle's range, providing clear insights into market participation and potential trend strength.
## Key Features
1. **Smart Volume Distribution**
- Automatically separates buying and selling volume
- Color-coded volume bars (Green for buying, Red for selling)
- Winning volume always displayed on top for quick visual reference
2. **Real-time Volume Analysis**
- Shows current candle's buy/sell ratio
- Displays total volume with smart number formatting (K, M, B)
- Percentage-based volume distribution
3. **Technical Overlays**
- 20-period Volume Moving Average
- Dynamic scaling relative to price action
- Clean, uncluttered visual design
## How to Use
### Installation
1. Add the indicator to your chart
2. Adjust the Volume Scale input based on your preference (default: 0.08)
3. Toggle the Moving Average display if desired
### Reading the Indicator
#### Volume Bars
- **Green Bars**: Represent buying volume
- **Red Bars**: Represent selling volume
- **Stacking**: The larger volume (winning side) is always displayed on top
- **Height**: Relative to the actual volume, scaled for chart visibility
#### Information Table
The top-right table shows three key pieces of information:
1. **Left Percentage**: Winning side's volume percentage
2. **Middle Percentage**: Losing side's volume percentage
3. **Right Number**: Total volume (abbreviated)
### Trading Applications
1. **Trend Confirmation**
- Strong buying volume in uptrends confirms bullish pressure
- High selling volume in downtrends confirms bearish pressure
- Volume divergence from price can signal potential reversals
2. **Support/Resistance Breaks**
- High volume on breakouts suggests stronger moves
- Low volume on breaks might indicate false breakouts
- Monitor volume distribution for break direction confirmation
3. **Reversal Identification**
- Volume shift from selling to buying can signal potential bottoms
- Shift from buying to selling can indicate potential tops
- Use with price action for better entry/exit points
## Input Parameters
1. **Volume Scale (0.01 to 1.0)**
- Controls the height of volume bars
- Default: 0.08
- Adjust based on your chart size and preference
2. **Show MA (True/False)**
- Toggles 20-period volume moving average
- Useful for identifying volume trends
- Default: True
3. **MA Length (1+)**
- Changes the moving average period
- Default: 20
- Higher values for longer-term volume trends
## Best Practices
1. **Multiple Timeframe Analysis**
- Compare volume patterns across different timeframes
- Look for volume convergence/divergence
- Use higher timeframes for major trend confirmation
2. **Combine with Other Indicators**
- Price action patterns
- Support/resistance levels
- Momentum indicators
- Trend indicators
3. **Volume Pattern Recognition**
- Monitor for unusual volume spikes
- Watch for volume climax patterns
- Identify volume dry-ups
## Tips for Optimization
1. Adjust the Volume Scale based on your chart size
2. Use smaller timeframes for detailed volume analysis
3. Compare current volume bars to historical patterns
4. Watch for volume/price divergences
5. Monitor volume distribution changes near key price levels
## Note
This indicator works best when combined with proper price action analysis and risk management strategies. It should not be used as a standalone trading system but rather as part of a comprehensive trading approach.
## Version History
- Beta Release: Initial public version
- Features buy/sell volume separation, moving average, and real-time analysis
- Optimized for both intraday and swing trading timeframes
## Credits
Developed by Jackson based on other script creators
Special thanks to the trading community for feedback and suggestions
X-volume

Volume Based Price Prediction [EdgeTerminal]This indicator combines price action, volume analysis, and trend prediction to forecast potential future price movements. The indicator creates a dynamic prediction zone with confidence bands, helping you visualize possible price trajectories based on current market conditions.
Key Features
Dynamic price prediction based on volume-weighted trend analysis
Confidence bands showing potential price ranges
Volume-based candle coloring for enhanced market insight
VWAP and Moving Average overlay
Customizable prediction parameters
Real-time updates with each new bar
Technical Components:
Volume-Price Correlation: The indicator analyzes the relationship between price movements and volume, Identifies stronger trends through volume confirmation and uses Volume-Weighted Average Price (VWAP) for price equilibrium
Trend Strength Analysis: Calculates trend direction using exponential moving averages, weights trend strength by relative volume and incorporates momentum for improved accuracy
Prediction Algorithm: combines current price, trend, and volume metrics, projects future price levels using weighted factors and generates confidence bands based on price volatility
Customizable Parameters:
Moving Average Length: Controls the smoothing period for calculations
Volume Weight Factor: Adjusts how much volume influences predictions
Prediction Periods: Number of bars to project into the future
Confidence Band Width: Controls the width of prediction bands
How to use it:
Look for strong volume confirmation with green candles, watch for prediction line slope changes, use confidence bands to gauge potential volatility and compare predictions with key support/resistance levels
Some useful tips:
Start with default settings and adjust gradually
Use wider confidence bands in volatile markets
Consider prediction lines as zones rather than exact levels
Best applications of this indicator:
Trend continuation probability assessment
Potential reversal point identification
Risk management through confidence bands
Volume-based trend confirmation

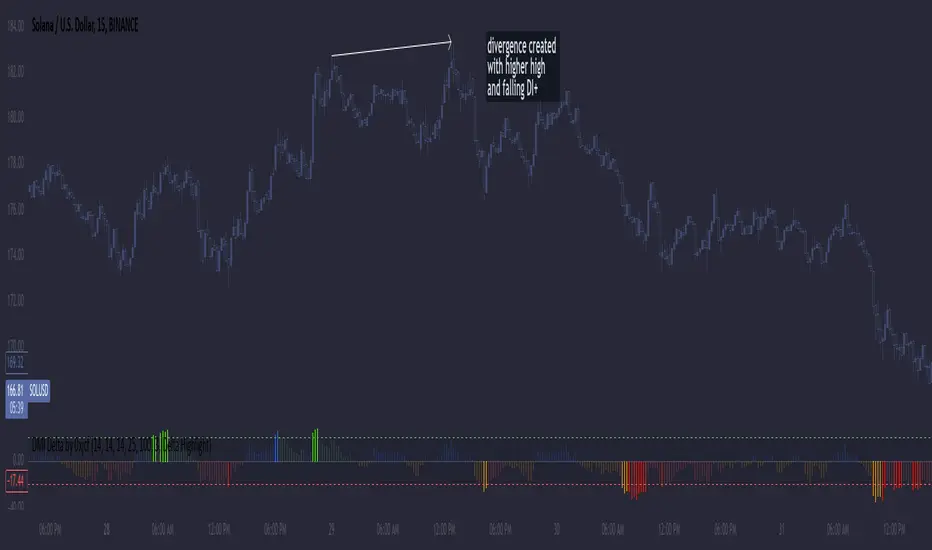
DMI Delta by 0xjcfOverview
This indicator integrates the Directional Movement Index (DMI), Average Directional Index (ADX), and volume analysis into an Oscillator designed to help traders identify divergence-based trading signals. Unlike typical volume or momentum indicators, this combination provides insight into directional momentum and volume intensity, allowing traders to make well-informed decisions based on multiple facets of market behavior.
Purpose and How Components Work Together
By combining DMI and ADX with volume analysis, this indicator helps traders detect when momentum diverges from price action—a common precursor to potential reversals or significant moves. The ADX filter enhances this by distinguishing trending from range-bound conditions, while volume analysis highlights moments of extreme sentiment, such as solid buying or selling. Together, these elements provide traders with a comprehensive view of market strength, directional bias, and volume surges, which help filter out weaker signals.
Key Features
DMI Delta and Oscillator: The DMI indicator measures directional movement by comparing DI+ and DI- values. This difference (DMI Delta) is calculated and displayed as a histogram, visualizing changes in directional bias. When combined with ADX filtering, this histogram helps traders gauge the strength of momentum and spot directional shifts early. For instance, a rising histogram in a bearish price trend might signal a potential bullish reversal.
Volume Analysis with Extremes: Volume is monitored to reveal when market participation is unusually high, using a customizable multiplier to highlight significant volume spikes. These extreme levels are color-coded directly on the histogram, providing visual cues on whether buying or selling interest is particularly strong. Volume analysis adds depth to the directional insights from DMI, allowing traders to differentiate between regular and powerful moves.
ADX Trending Filter: The ADX component filters trends by measuring the overall strength of a price move, with a default threshold of 25. When ADX is above this level, it suggests that the market is trending strongly, making the DMI Delta readings more reliable. Below this threshold, the market is likely range-bound, cautioning traders that signals might not have as much follow-through.
Using the Indicator in Divergence Strategies
This indicator excels in divergence strategies by highlighting moments when price action diverges from directional momentum. Here’s how it aids in decision-making:
Bullish Divergence: If the price is falling to new lows while the DMI Delta histogram rises, it can indicate weakening bearish momentum and signal a potential price reversal to the upside.
Bearish Divergence: Conversely, if prices are climbing but the DMI Delta histogram falls, it may point to waning bullish momentum, suggesting a bearish reversal.
Visual Cues and Customization
The color-coded output enhances usability:
Bright Green/Red: Extreme volume with strong bullish or bearish signals, often at points of high potential for trend continuation or reversal.
Green/Red Shades: These shades reflect trending conditions (bullish or bearish) based on ADX, factoring in volume. Green signals a bullish trend, and red is a bearish trend.
Blue/Orange Shades: Indicates non-trending or weaker conditions, suggesting a more cautious approach in range-bound markets.
Customizable for Diverse Trading Styles
This indicator allows users to adjust settings like the ADX threshold and volume multiplier to optimize performance for various timeframes and strategies. Whether a trader prefers swing trading or intraday scalping, these parameters enable fine-tuning to enhance signal reliability across different market contexts.
Practical Usage Tips
Entry and Exit Signals: Use this indicator in conjunction with price action. Divergences between the price and DMI Delta histogram can reinforce entry or exit decisions.
Adjust Thresholds: Based on backtesting, customize the ADX Trending Threshold and Volume Multiplier to ensure optimal performance on different timeframes or trading styles.
In summary, this indicator is tailored for traders seeking a multi-dimensional approach to market analysis. It blends momentum, trend strength, and volume insights to support divergence-based strategies, helping traders confidently make informed decisions. Remember to validate signals through backtesting and use it alongside price action for the best results.
Nova Volume Indicator (NVI) by SplitzMagicNova Volume Indicator
The Nova Volume Indicator is an innovative trading tool designed to enhance your trading strategy by analysing volume momentum and market dynamics. This indicator empowers traders to make informed decisions by providing clear and actionable buy and sell signals based on real-time data.
How It Works:
The Nova Volume Indicator utilizes advanced algorithms to assess volume changes and price movements. Key features include:
Volume Momentum Calculation: By evaluating the relationship between price changes and volume, the indicator identifies significant momentum shifts, enabling traders to pinpoint entry and exit points with precision.
Trend Direction Filter: The indicator includes a price filter that determines the prevailing market trend based on a moving average. This ensures that trades align with the overall market direction, enhancing the probability of success.
Alert System: With customizable alert thresholds, users receive notifications when momentum crosses defined levels, keeping them informed of potential trading opportunities without the need for constant monitoring.
No Trade Signal: A black background on the histogram indicates that there are no valid trading opportunities at that moment. Use this feature to avoid entering trades during uncertain market conditions.
How to Use the Nova Volume Indicator for Entries:
Identifying the Trend: Before making any trades, check the indicator's trend direction. If the price is above the moving average, focus on bullish signals; if below, look for bearish signals.
Spotting Entries:
Buy Signal: Look for a green histogram bar indicating positive volume momentum. Enter a trade at the close of the candle when the momentum score exceeds your alert threshold and the price is above the moving average.
Sell Signal: A red histogram bar signals negative volume momentum. Enter a short position at the close of the candle when the momentum score falls below the alert threshold and the price is below the moving average.
Setting Stops and Targets: Place your stop-loss below the recent swing low for buy trades or above the recent swing high for sell trades. Aim for a minimum 1:2 risk-to-reward ratio to maximize your profitability.
Customizable Settings:
The Nova Volume Indicator offers several input settings to help you tailor the indicator to your unique trading style:
Signal Period: Adjust the period for calculating the signal line (EMA of momentum score). A shorter period reacts quickly, while a longer one smooths the signals.
Volatility Period: Control the lookback period for assessing market volatility. Shorter periods capture recent fluctuations, and longer periods provide a broader view of price behavior.
Price Filter MA Length: Set the period for the moving average used to filter trades based on price action, helping determine the trend direction.
Alert Threshold: Define the level at which the indicator signals potential buying or selling opportunities. Customize this setting to suit your trading preferences.
The Nova Volume Indicator is a powerful addition to any trader’s toolkit, designed to simplify decision-making and improve trading outcomes. Whether you're a beginner or a seasoned trader, this indicator offers the insights you need to navigate the markets confidently. Explore its customizable features to create a unique trading experience tailored to your needs. Start using the Nova Volume Indicator today and elevate your trading journey!
Any questions you may have or if you have anything to input to improve this then please leave a comment.

CMF and Scaled EFI OverlayCMF and Scaled EFI Overlay Indicator
Overview
The CMF and Scaled EFI Overlay indicator combines the Chaikin Money Flow (CMF) and a scaled version of the Elder Force Index (EFI) into a single chart. This allows traders to analyze both indicators simultaneously, facilitating better insights into market momentum and volume dynamics , specifically focusing on buying/selling pressure and momentum , without compromising the integrity of either indicator.
Purpose
Chaikin Money Flow (CMF): Measures buying and selling pressure by evaluating price and volume over a specified period. It indicates accumulation (buying pressure) when values are positive and distribution (selling pressure) when values are negative.
Elder Force Index (EFI): Combines price changes and volume to assess the momentum behind market moves. Positive values indicate upward momentum (prices rising with strong volume), while negative values indicate downward momentum (prices falling with strong volume).
By scaling the EFI to match the amplitude of the CMF, this indicator enables a direct comparison between pressure and momentum , preserving their shapes and zero crossings. Traders can observe the relationship between price movements, volume, and momentum more effectively, aiding in decision-making.
Understanding Pressure vs. Momentum
Chaikin Money Flow (CMF):
- Indicates the level of demand (buying pressure) or supply (selling pressure) in the market based on volume and price movements.
- Accumulation: When institutional or large investors are buying significant amounts of an asset, leading to an increase in buying pressure.
- Distribution: When these investors are selling off their holdings, increasing selling pressure.
Elder Force Index (EFI):
- Measures the strength and speed of price movements, indicating how forceful the current trend is.
- Positive Momentum: Prices are rising quickly, indicating a strong uptrend.
- Negative Momentum: Prices are falling rapidly, indicating a strong downtrend.
Understanding the difference between pressure and momentum is crucial. For example, a market may exhibit strong buying pressure (positive CMF) but weak momentum (low EFI), suggesting accumulation without significant price movement yet.
Features
Overlay of CMF and Scaled EFI: Both indicators are plotted on the same chart for easy comparison of pressure and momentum dynamics.
Customizable Parameters: Adjust lengths for CMF and EFI calculations and fine-tune the scaling factor for optimal alignment.
Preserved Indicator Integrity: The scaling method preserves the shape and zero crossings of the EFI, ensuring accurate analysis.
How It Works
CMF Calculation:
- Calculates the Money Flow Multiplier (MFM) and Money Flow Volume (MFV) to assess buying and selling pressure.
- CMF is computed by summing the MFV over the specified length and dividing by the sum of volume over the same period:
CMF = (Sum of MFV over n periods) / (Sum of Volume over n periods)
EFI Calculation:
- Calculates the EFI using the Exponential Moving Average (EMA) of the price change multiplied by volume:
EFI = EMA(n, Change in Close * Volume)
Scaling the EFI:
- The EFI is scaled by multiplying it with a user-defined scaling factor to match the CMF's amplitude.
Plotting:
- Both the CMF and the scaled EFI are plotted on the same chart.
- A zero line is included for reference, aiding in identifying crossovers and divergences.
Indicator Settings
Inputs
CMF Length (`cmf_length`):
- Default: 20
- Description: The number of periods over which the CMF is calculated. A higher value smooths the indicator but may delay signals.
EFI Length (`efi_length`):
- Default: 13
- Description: The EMA length for the EFI calculation. Adjusting this value affects the sensitivity of the EFI to price changes.
EFI Scaling Factor (`efi_scaling_factor`):
- Default: 0.000001
- Description: A constant used to scale the EFI to match the CMF's amplitude. Fine-tuning this value ensures the indicators align visually.
How to Adjust the EFI Scaling Factor
Start with the Default Value:
- Begin with the default scaling factor of `0.000001`.
Visual Inspection:
- Observe the plotted indicators. If the EFI appears too large or small compared to the CMF, proceed to adjust the scaling factor.
Fine-Tune the Scaling Factor:
- Increase or decrease the scaling factor incrementally (e.g., `0.000005`, `0.00001`, `0.00005`) until the amplitudes of the CMF and EFI visually align.
- The optimal scaling factor may vary depending on the asset and timeframe.
Verify Alignment:
- Ensure that the scaled EFI preserves the shape and zero crossings of the original EFI.
- Overlay the original EFI (if desired) to confirm alignment.
How to Use the Indicator
Analyze Buying/Selling Pressure and Momentum:
- Positive CMF (>0): Indicates accumulation (buying pressure).
- Negative CMF (<0): Indicates distribution (selling pressure).
- Positive EFI: Indicates positive momentum (prices rising with strong volume).
- Negative EFI: Indicates negative momentum (prices falling with strong volume).
Look for Indicator Alignment:
- Both CMF and EFI Positive:
- Suggests strong bullish conditions with both buying pressure and upward momentum.
- Both CMF and EFI Negative:
- Indicates strong bearish conditions with selling pressure and downward momentum.
Identify Divergences:
- CMF Positive, EFI Negative:
- Buying pressure exists, but momentum is negative; potential for a bullish reversal if momentum shifts.
- CMF Negative, EFI Positive:
- Selling pressure exists despite rising prices; caution advised as it may indicate a potential bearish reversal.
Confirm Signals with Other Analysis:
- Use this indicator in conjunction with other technical analysis tools (e.g., trend lines, support/resistance levels) to confirm trading decisions.
Example Usage
Scenario 1: Bullish Alignment
- CMF Positive: Indicates accumulation (buying pressure).
- EFI Positive and Increasing: Shows strengthening upward momentum.
- Interpretation:
- Strong bullish signal suggesting that buyers are active, and the price is likely to continue rising.
- Action:
- Consider entering a long position or adding to existing ones.
Scenario 2: Bearish Divergence
- CMF Negative: Indicates distribution (selling pressure).
- EFI Positive but Decreasing: Momentum is positive but weakening.
- Interpretation:
- Potential bearish reversal; price may be rising but underlying selling pressure suggests caution.
- Action:
- Be cautious with long positions; consider tightening stop-losses or preparing for a possible trend reversal.
Tips
Adjust for Different Assets:
- The optimal scaling factor may differ across assets due to varying price and volume characteristics.
- Always adjust the scaling factor when analyzing a new asset.
Monitor Indicator Crossovers:
- Crossings above or below the zero line can signal potential trend changes.
Watch for Divergences:
- Divergences between the CMF and EFI can provide early warning signs of trend reversals.
Combine with Other Indicators:
- Enhance your analysis by combining this overlay with other indicators like moving averages, RSI, or Ichimoku Cloud.
Limitations
Scaling Factor Sensitivity:
- An incorrect scaling factor may misalign the indicators, leading to inaccurate interpretations.
- Regular adjustments may be necessary when switching between different assets or timeframes.
Not a Standalone Indicator:
- Should be used as part of a comprehensive trading strategy.
- Always consider other market factors and indicators before making trading decisions.
Disclaimer
No Guarantee of Performance:
- Past performance is not indicative of future results.
- Trading involves risk, and losses can exceed deposits.
Use at Your Own Risk:
- This indicator is provided for educational purposes.
- The author is not responsible for any financial losses incurred while using this indicator.
Code Summary
//@version=5
indicator(title="CMF and Scaled EFI Overlay", shorttitle="CMF & Scaled EFI", overlay=false)
cmf_length = input.int(20, minval=1, title="CMF Length")
efi_length = input.int(13, minval=1, title="EFI Length")
efi_scaling_factor = input.float(0.000001, title="EFI Scaling Factor", minval=0.0, step=0.000001)
// --- CMF Calculation ---
ad = high != low ? ((2 * close - low - high) / (high - low)) * volume : 0
mf = math.sum(ad, cmf_length) / math.sum(volume, cmf_length)
// --- EFI Calculation ---
efi_raw = ta.ema(ta.change(close) * volume, efi_length)
// --- Scale EFI ---
efi_scaled = efi_raw * efi_scaling_factor
// --- Plotting ---
plot(mf, color=color.green, title="CMF", linewidth=2)
plot(efi_scaled, color=color.red, title="EFI (Scaled)", linewidth=2)
hline(0, color=color.gray, title="Zero Line", linestyle=hline.style_dashed)
- Lines 4-6: Define input parameters for CMF length, EFI length, and EFI scaling factor.
- Lines 9-11: Calculate the CMF.
- Lines 14-16: Calculate the EFI.
- Line 19: Scale the EFI by the scaling factor.
- Lines 22-24: Plot the CMF, scaled EFI, and zero line.
Feedback and Support
Suggestions: If you have ideas for improvements or additional features, please share your feedback.
Support: For assistance or questions regarding this indicator, feel free to contact the author through TradingView.
---
By combining the CMF and scaled EFI into a single overlay, this indicator provides a powerful tool for traders to analyze market dynamics more comprehensively. Adjust the parameters to suit your trading style, and always practice sound risk management.

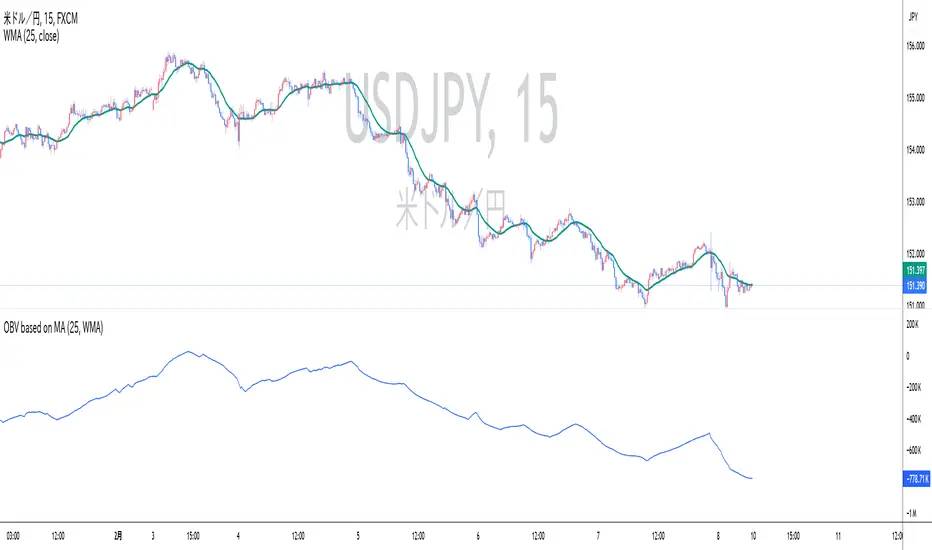
OBV based on MADescription:
This indicator calculates On-Balance Volume (OBV) based on the direction of a Simple Moving Average (SMA). Instead of using price movements, this OBV adds or subtracts volume depending on whether the SMA is rising or falling.
SMA-based OBV: When the SMA rises, the volume is added to the OBV. When the SMA falls, the volume is subtracted from the OBV. This allows traders to observe cumulative volume in relation to the wave patterns created by the SMA.
SMA Period: The period of the SMA can be customized, allowing traders to adjust it according to the wave size they want to observe.
While the cumulative volume indicator already exists, traders who analyze volume patterns can use this indicator to more easily conduct volume analysis across different wave sizes.
Inputs:
SMA Period: Defines the lookback period for calculating the Simple Moving Average (default is 25).
Ideal for:
Traders who want to analyze volume flow relative to moving average trends, rather than price movements. This can help identify underlying strength or weakness in market trends.
説明:
このインジケーターは、単純移動平均(SMA)の方向に基づいてオンバランス・ボリューム(OBV)を計算します。価格の動きではなく、SMAが上昇しているときは出来高を加算し、SMAが下降しているときは出来高を減算します。
SMA基準のOBV: SMAが上昇している場合はOBVに出来高が加算され、SMAが下降している場合は出来高が減算されます。これにより、SMAが作る波形に即した累積出来高を観察することができます。
SMA期間: トレーダーが見たい波のサイズ感に応じて、SMAの期間をカスタマイズできます。
既に累積出来高(Cumulative Volume)というインジケーターは存在しますが、波形を基に出来高を分析しているトレーダーは、このインジケーターを使うことで、様々なサイズの波形に即した出来高分析をより簡単に行うことができます。
入力項目:
SMA期間: 単純移動平均の計算に使用される期間を定義します(デフォルトは25)。
適しているトレーダー:
より波形に即した累積出来高分析を重視するトレーダーに最適です。
Enhanced volumeHi all!
This indicator plots volume at the bottom of the chart and the volume Moving Average (with the choice of Simple Moving Average (SMA) (default), Exponential Moving Average (EMA) and Volume Weighted Moving Average (VWMA)) and desired length (defaults to 20). It then changes the transparency of the volume (and the bars body) based on the close and the volume. It also changes the bar transparency. All these visual changes can be configured in the "Style" tab in the indicators settings.
The opacity will be high when the close is considered to be a "Strong close (%)" and has a bigger volume than any of the red closing in the last 10 bars. This "Strong close (%)" is defaulted to 50 which means that the bar needs to close equal or higher than 50% of the bar.
You also have an option to include red bars, which are excluded by default.
This indicator can help you to spot bars with relevant volume and find reversals.
I hope this explanation makes sense, let me know otherwise. Also let me know if you have any suggestions on improvements.
Best of trading luck!

FuTech V-Spike & V-HighlighterFuTech V-Spike & V-Highlighter
In the context of trading and technical analysis, this volume spike & volume highlighter indicator is the perfect indicator used to assess market activity and make informed trading decisions.
Let's Understand in brief as below :
1) Volume Spike :
A volume spike refers to a sudden, significant increase in trading volume compared to the average volume over a specific period.
This spike can indicate heightened interest in a particular security, often preceding price movements.
Traders may look for volume spikes as signals for potential buy or sell opportunities because they can suggest that a stock is experiencing increased activity, possibly due to news, earnings releases, or other catalysts.
Characteristics of a Volume Spike:
Assess the sudden increase in trading volume.
It Can occur in both upward and downward price movements.
Often compared to the average volume over a defined period (e.g., the last 20 days).
2) Volume Highlighter:
A volume highlighter emphasizes significant changes in trading volume on a price chart. This indicator typically uses color coding to highlight periods of high volume, making it easier for traders to identify volume spikes at a glance.
How this indicator works:
a) Volume Spike will calculate the highest volume spike as per the user defined threshold multiplier. (Multiplier = when volume exceeds a certain threshold)
b) The threshold Multiplier can be set based on a fixed number or as a multiple of the Exponential Moving Average volume. Volume Spike Multiplier default is 1.5, means the EMA volume should cross 1.5 times the user defined lookback period
c) The result is derived from the user defined lookback candles by using its EMA instead of SMA, which will give us more precise results.
d) By default, last 10 candles EMA average is used to calculate the Volume Spike but you can choose your lookback period as many days, weeks, months, years of your choice !
e) In Volume Spike -
- Green candle will show Yellow color Bar as Bullish sentiments, whereas
- Red candle will show Black Bar as Bearish sentiments.
f) Volume Highlighter will highlight the candles background if the highest volume is crossing as per the the user defined lookback period
g) Default Lookback period is 20, Color coding (e.g., Blue for bullish spikes, Red for bearish spikes) helps traders quickly assess the volume context.
h) Volume Highlighter plotting shapes and positions can be modified
Illustration:
From the Above pic,
If last Volume Spike is 10 lookback candles, Spike multiplier is 1.5 and Highlighter lookback candles is 20,
Then yellow candle means the spike in volume which is 1.5 times higher than the last 10 candles
Highlighting color defines the highest volumes trading from the last 20 candles which is either Blue (Bullish) or Red (Bearish) sentiments
Conclusion :
Using FuTech V-Spike & V-Highlighter indicator - will help traders identify potential trading opportunities and better understand market dynamics.
By analyzing volume in conjunction with price movements, traders can make more informed decisions based on market sentiment.
Thank you !
Jai Swaminarayan Dasna Das !
He Hari ! Bas Ek Tu Raji Tha !

Freak VolumeFreak Volume is a technical indicator designed to identify bars with exceptionally high trading volume. It operates by calculating the mean volume over a specified period and determines high volume thresholds using both multiples of the mean and standard deviations from this mean.
High Volume Identification:
Standard Deviation Threshold: Bars with volume exceeding a specified number of standard deviations above the mean are highlighted within the indicator and on the corresponding candlesticks on the chart.
Mean Multiple Threshold: Bars with volume exceeding a multiple of the average volume are also highlighted. This highlighting is secondary to the standard deviation threshold, meaning standard deviation-based highlights take precedence.
Price Range Plotting: The indicator offers an option to display the price range of high volume candles, which may serve as potential supply and demand zones or support and resistance levels.
Freak Volume assists traders in visually identifying significant volume spikes that could indicate important market activity or potential turning points by providing multiple methods of high volume detection.

Low Volume Supply and Demand by (MS Traders)"Low Volume Supply and Demand" is a custom TradingView indicator designed to help traders identify potential supply and demand zones based on low-volume candle patterns. This indicator highlights bullish and bearish candles with lower volume compared to the previous two candles, making them significant in identifying possible market reversals or continuation points.
Bullish (Demand): The indicator highlights bullish candles with lower volume than the previous two candles, suggesting a potential demand zone.
Bearish (Supply): The indicator highlights bearish candles with lower volume than the previous two candles, indicating a possible supply zone.

Farley's Accumulation-Distribution Accelerator (ADA)Farley's ADA (From The Master Swing Trader)
What it is :
ADA is designed to track volume oscillations in the market and reduce the impact of shock events.
It observes the supply-demand dynamics within the market, which can trigger natural levels of price reversals.
How It Works
Volume and Price Relationship: ADA measures the lag between price and volume movements. It highlights when volume leads or lags behind price changes, helping traders identify potential reversals or trends.
Signal Generation: ADA can generate faster and cleaner signals compared to traditional indicators like On-Balance Volume (OBV).
Usage
Support and Resistance: ADA formations can help identify support and resistance levels and trendlines.
detect natural levels where price reversals might occur.
Trend Identification: Look for significant divergences between ADA and price action to identify potential trend reversals.
Volume Analysis: Use ADA to anticipate pauses in price movements when volume leads, and expect dynamic trends when ADA significantly moves ahead of price action.

High Volume Zone HighlightDescription:
The High Volume Zone Highlight highlights areas on the chart where the volume exceeds a user-defined threshold based on a moving average. This helps traders visually identify zones of high trading activity.
The moving average period and volume threshold are fully customizable.
Background color highlights appear when the current volume is greater than a specified multiple of the volume moving average.
Ideal for traders who want to spot significant volume changes relative to historical averages.
Inputs:
Volume MA Length: The number of periods for calculating the volume moving average.
Volume MA Factor: A multiplier to define the threshold. For example, setting this to 1.5 will highlight when the volume is 150% of the moving average.
Style Customization:
Users can adjust the color and transparency of the highlighted zones from the settings.
説明:
ハイ・ボリューム・ゾーン・ハイライトは、出来高が移動平均に基づいたユーザー定義の閾値を超えたエリアをチャート上で強調表示します。
移動平均期間と出来高閾値は自由にカスタマイズ可能です。
現在の出来高が出来高移動平均の指定した倍数を超えた場合、背景色が強調表示されます。
過去の平均と比較して重要な出来高の変化を検出したいトレーダーに最適です。
設定項目:
出来高移動平均期間: 出来高移動平均を計算する際の期間。
出来高MA係数: 閾値を定義するための係数。たとえば、1.5に設定すると、出来高が移動平均の150%を超えたときにハイライトされます。
スタイルカスタマイズ:
設定からハイライトされたゾーンの色や透明度を調整できます。
Volume CalendarDescription:
The indicator displays a calendar with Volume data for up to 6 last months. It is designed to work on any timeframe, but works best on Daily and below. It is also consistent in that it displays the same data even if you go to lower timeframes like 5 minutes (even though the data is used is Daily).
Features:
- displays volume data for last N months (volume, volume change, % of weekly, monthly and yearly volume)
- display total volume for each month
- display monthly sentiment
- find dates with volume spikes
Inputs:
- Number of months -> how many last months of data to display (from 1 to 6)
- Volume Type -> display only Bullish, only Bearish or all volume
- Cell color is based on -> Volume - the brighter the cell the higher volume was on that day; Volume Change - the brighter the cell the higher was the volume change that day; Volume Spike - the brighter the cell the higher was volume spike that day (volume spike is based on volume being above its average over last N candles)
- Cell color timeframe -> Weekly - the cell color is calculated comparing volume of that cell with weekly volume; Monthly - comparing volume with monthly volume
- Use volume for sentiment -> take the volume into account when calculating monthly sentiment (otherwise calculate it based on number of Bullish and Bearish days in the month)
- Spike Average Period -> period of the moving average used for spike calculation
- Spike Threshold -> current volume must be this many times greater than the average for it to be considered a spike
- Table Size -> size of the table
- Theme -> colouring of the table

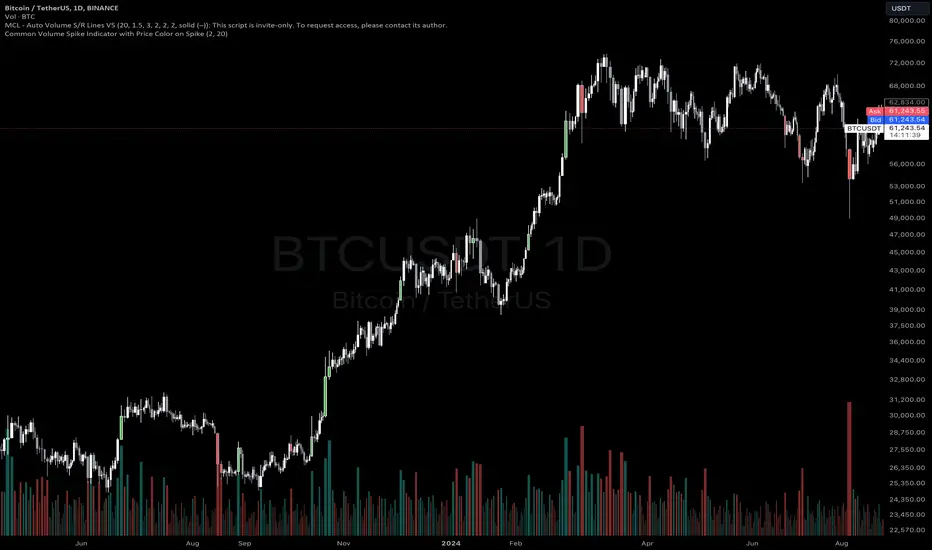
Common Volume Spike Indicator with Price Color on SpikeIndicator Name: Common Volume Spike Indicator with Price Color on Spike
Description:
The “Common Volume Spike Indicator with Price Color on Spike” is designed to detect significant volume spikes and highlight them on the chart. It not only identifies moments when the trading volume exceeds a certain threshold but also colors the price bars based on price movement during these spikes.
Key Features:
• Volume Spike Detection: Detects volume spikes when the current volume exceeds a specified multiple of the average volume over a user-defined lookback period.
• Dynamic Volume Break: Highlights bars where the volume exceeds a threshold, dynamically calculated as a multiple of the average volume (default is 10x the average volume).
• Price Color on Volume Spike: When a volume spike occurs, bars are colored green if the price closes higher than the previous bar, and red if the price closes lower. This feature helps traders easily identify significant price movements during high-volume periods.
• Customizable Parameters:
• Threshold Multiplier: Adjust the sensitivity of volume spike detection.
• Lookback Period: Define the period over which the average volume is calculated.
• Volume Break Multiplier: Set a multiplier for the average volume to identify extreme volume breaks.
This indicator is suitable for traders who want to quickly spot critical market events driven by significant increases in volume. It helps to visualize both the volume activity and the corresponding price movement, providing an additional layer of market insight.
How to Use:
1. Green Bars: When the volume spike condition is met and the price closes higher than the previous bar, the bar is colored green.
2. Red Bars: When the volume spike condition is met and the price closes lower than the previous bar, the bar is colored red.
3. Blue Bars: Indicates a significant volume break, where the current volume exceeds a specified multiple of the average volume (default: 10x).
Ideal for intraday and swing traders who rely on volume and price action for market entries and exits. This indicator works well across different asset classes, including stocks, forex, and cryptocurrencies.
You can adjust the input parameters to fit your specific trading strategy and timeframe.
Disclaimer: This indicator is a tool to help with market analysis and should not be considered financial advice. Always perform your own due diligence before making any trading decisions.
This description outlines the key functionality and how the indicator can benefit traders on TradingView.
Bubbles Volume [BigBeluga]The Bubbles Volume indicator is an innovative visualization tool designed to represent trading volume in a more intuitive and visually appealing manner. By displaying volume as bubbles of varying sizes and colors on the price chart, this indicator helps traders quickly identify significant volume levels and potential areas of interest.
Important Note:
For correct visual representation of indicator, layout it to front:
🔵 KEY FEATURES
● Volume Bubbles
Represents trading volume as bubbles on the price chart
Bubble size increases with higher volume levels
Color intensity changes based on volume significance
Provides an intuitive visual representation of volume distribution
● Heatmap Coloring
Optional feature to color bubbles based on volume intensity
Uses a color gradient from cool (low volume) to hot (high volume) colors
Helps quickly identify extremely high volume areas
● Significant Volume Levels
Option to display horizontal lines at significant volume levels
Shows volume amount as labels for highly significant levels
Helps identify potential support/resistance areas based on volume
Volume Levels:
Levels with HeatMap:
Levels without Volume Bubles:
● Normalized Volume Calculation
Uses normalized volume to account for overall market volume trends
Provides a more accurate representation of volume significance
🔵 HOW TO USE
● Volume Analysis
Larger bubbles indicate higher trading volume
Clusters of large bubbles may suggest areas of high interest or potential reversals
Use in conjunction with price action to identify potential breakouts or fakeouts
● Trend Confirmation
Strong trends often show increasing bubble sizes in the trend direction
Diminishing bubble sizes might indicate weakening trends
● Support and Resistance
Significant volume levels (displayed as lines) can act as potential support/resistance
Pay attention to price reactions at these levels for trading opportunities
● Divergences
Look for divergences between price action and bubble sizes
Price making new highs/lows with smaller bubbles might indicate weakening momentum
● Volatility Assessment
Periods with consistently large bubbles indicate high volatility
Can be used to adjust trading strategies or position sizing
🔵 CUSTOMIZATION
The Bubbles Volume indicator offers several customization options:
Toggle bubble display on/off
Adjust volume threshold for filtering low volume bubbles
Enable/disable heatmap coloring for enhanced visual analysis
Show/hide significant volume levels
Adjust the number of significant levels displayed
Customize colors to suit personal preferences
By fine-tuning these settings, traders can adapt the indicator to various market conditions and personal analysis preferences.
The Bubbles Volume indicator provides a unique and intuitive way to visualize trading volume directly on the price chart. This approach allows traders to quickly identify areas of significant trading activity and potential price levels of interest without the need for a separate volume sub-chart.
This tool can be particularly useful for traders focusing on volume analysis, breakout strategies, or those looking to confirm price action with volume. The visual nature of the bubbles makes it easy to spot volume patterns and anomalies at a glance, potentially leading to faster and more informed trading decisions.
As with all technical indicators, it's recommended to use the Bubbles Volume indicator in conjunction with other forms of analysis and within the context of a well-defined trading strategy. While this indicator provides valuable volume insights, it should be considered alongside other factors such as overall market trends, price patterns, and fundamental analysis when making trading decisions.

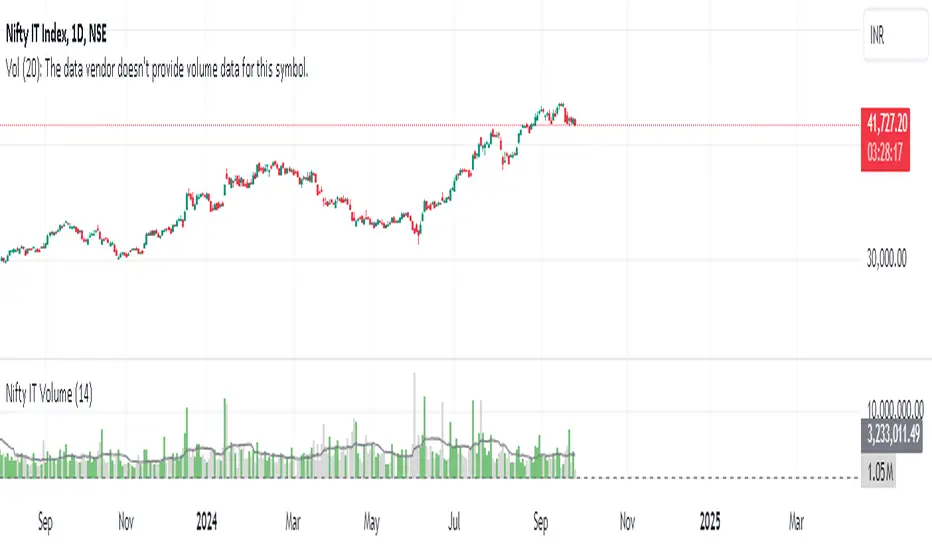
Nifty IT VolumeHello everyone,
Here I present Nifty IT index volumes calculated based on weighted volumes of all constituents.
A simple formula for calculation:
constituent1.volume*weightage + constituent2.volume*weightage + ....
You can change color and code if there is a change in constituents of the index from NSE. I will share other index volumes soon.
Enjoy!
Thrax - Intraday Market Pressure ZonesTHRAX - INTRADAY MARKET PRESSURE ZONES
This indicator identifies potential support and resistance zones based on areas of significant market pressure. It dynamically plots these zones and adjusts their visibility based on real-time price action and user-defined thresholds. The indicator is useful for traders seeking to understand intraday market pressure, visualize zones of potential price reversals, and analyze volume imbalances at critical levels.
1. Support/Resistance Zones: Wherever the price retraces significantly from its high a support zone is drawn and when it retraces significantly from it low a resistance zone is drawn. The significant retracing is measured by the wick threshold percentage. For instance, if set to 75%, it implies price retracement of 75% either from high or from low for a particular candel
Volume delat: Displays volume delta information where the zones are formed. This can be used by trader to consider only those zones where delta is significant.
2. Breakout Detection: Monitors for price breakouts beyond established zones, deleting zones that are invalidated by price movement. when the price breaks a given zone with the threshold, it is considered to be mitigated and chances of trend continuation is decent.
Candle Coloring: Uses color codes (green, red, and yellow) to represent bullish, bearish, and indecisive (doji) candles, aiding quick visual assessment.
INPUTS
1. Wick Threshold (%) : Sets the minimum wick percentage required for a candle to be considered a support or resistance candidate.
2. Breakout Threshold (%) : Determines the percentage above or below a support or resistance zone that defines a breakout condition. if breaks a zone with the set threshold then the zone will be considered mititgated.
3. Max Number of Support/Resistance Zones : Limits the maximum number of support/resistance zones displayed on the chart, ranging from 1 to 5.
4. Show Wick Percentage Labels : Toggles the display of percentage values for upper and lower wicks on each candle.
TRADE SETUP
Identifying Entry Points: Look for the formation of support or resistance zones. Wait for price to retrace to these zones. if you are willing to take risk, you can consider even zones with low delta. If you want to be more cautious you should consider zones with high delta.
Volume Confirmation: Use the volume information to confirm the strength of the zone. Strong volume differences (displayed as labels) can indicate significant market pressure at these levels.
Breakout Trades: If price breaks through a support/resistance zone by more than the breakout threshold, consider this a signal for a potential trend continuation in the breakout direction.
Risk Management: Set stop-loss levels slightly outside of the identified zones to minimize risk in case of false breakouts. This can be set in input setting for breakout threshold.
Bonus Tip : Mark your significant highs and lows from where prices have retraced multiple times in the near past and if the zone is near these levels it can serve s a strong candidate of support or resistance
Therefore, in conclusion monitor the zones, based on delta and volume presence filter out the zone, wait for price retracement to the zone, intiate the trade with stop loss below zone with a set percentage.
MM Relative Volume (RVOL)What this script does:
This script shows you the "Relative Volume" (RVOL) value up to the current minute. RVOL is the volume from market open up to the current minute today, compared to the average of the same over the last n (30 by default) days.
How this script works:
There are a lot of indicators out there for RVOL, but they all take shortcuts that result in sub-par data. This indicator goes the distance to store data for every minute for the last n days for the current chart, then in sums the volume up to the current minute today along with the average of the same up-to-the-minute data from the prior n days to calculate the relative volume of the stock. It's super important to get this data up to the current minute, because most traders use this information primarily during the first 90 minutes of trading, and need to know if this value is going up or down.
How to use this script:
Relative volume can be used to gauge how "In Play" a stock is. If RVOL is less than 1 it is not "In Play" on this trading day and you might not want to trade it. If RVOL is above 2, it is "In Play" and you may want to trade it. When stocks are very "In Play", you can see an RVOL of 5 and above. The higher the RVOL the more "In Play" the stock is. You can also used RVOL for position sizing. If RVOL is <1 you may decide not to take a large position in the name. If RVOL is >3, this may give you more confidence to take a larger position as more reward and more liquidity should be present.
What makes this script original:
This particular implementation of RVOL has never been done before on TradingView to my knowledge. Most other indicators use a rolling average of the prior 30 days which is much easier to do, but this doesn't actually work properly because instead of getting large volume spikes from prior days filtered out correctly, it takes a LOT longer for those to even out as the rolling average eventually smooths down. Instead, with this indicator, any large/small volume days will truly drop off after the moving average length and the calculated average daily volume (ADV) will be accurate up to the minute. For more details on the original concept behind this indicator, check out the blog linked on my profile.

Advanced Volume-Driven Breakout SignalsThe "Advanced Volume-Driven Breakout Signals" indicator is a cutting-edge tool designed to help traders identify high-potential trading opportunities through sophisticated volume analysis techniques. This indicator integrates volume flow analysis, moving averages, and Relative Volume (RVOL) to provide a comprehensive view of market conditions, going beyond traditional Volume Spread Analysis (VSA) methods.
Key Features:
Volume Flow Analysis: Distinguishes bullish and bearish volume flows with distinct colors, making it easier to visualize market sentiment and potential breakout points.
Volume Flow Moving Averages: Calculates moving averages for volume using various methods (SMA, EMA, WMA, HMA, VWMA), accommodating different trading strategies. This includes settings for adjusting the type of moving average and its period, as well as thresholds for high, medium, and low volume levels.
Volume Spikes Detection: Identifies significant volume spikes based on user-defined multipliers and moving averages, highlighting unusual trading activity.
Volume MA Cloud Settings: Computes general moving averages of volume to track trends and detect deviations. This feature includes options to select different moving average types and adjust thresholds for detecting high volume activity.
Relative Volume (RVOL): Measures current volume relative to historical averages, triggering signals when RVOL exceeds predefined thresholds, indicating notable changes in trading activity.
Entry Conditions: Provides clear long and short entry signals based on combined volume flow conditions and RVOL, offering actionable trading opportunities.
Volume Visualization:
— Bullish Volume Flow: Light and dark green bars indicate bullish volume flow.
— Bearish Volume Flow: Light and dark red bars denote bearish volume flow.
— High Volume Bars: Highlighted in yellow, and extreme volume bars in orange for additional context. These bars are plotted for visual aid and do not directly influence trade signals, focusing instead on the quality and strength of the volume flow.
Alerts: Allows users to create alert notifications for long and short entry signals when the criteria are met, enabling traders to respond promptly to trading opportunities.
Usage:
Overlay: Apply the indicator directly to your price chart to visualise real-time signals and volume conditions.
Customisable: Adjust settings for moving averages, RVOL, and other parameters to match your trading strategy and preferences.
Comparison to VSA Scripts: The "Advanced Volume-Driven Breakout Signals" indicator extends beyond traditional VSA scripts by incorporating a wider range of analytical features. While VSA primarily focuses on volume spread patterns and price action, this indicator offers enhanced functionality with advanced RVOL metrics, customizable moving averages, and detailed volume spike detection, making it a more versatile tool for identifying breakout opportunities and managing trades. It is particularly effective when used alongside key levels and order blocks.
Acknowledgements: Special thanks to @oh92 and @goofoffgoose for their invaluable scripts, which served as inspiration in the development of this advanced trading indicator.
Notes: The script is continually evolving, with ongoing refinements aimed at enhancing accuracy and performance.

Decoding the Volume of candlesThe indicator is designed for traders who are more interested in market structures and price action using volumes. Volume analysis can help traders build a clearer understanding of zones of buyer and seller interest, as well as liquidity gathering points (traders' stop levels).
Key Features:
The indicator visualizes on the chart the volumes selected according to the trader's chosen settings.
The indicator highlights candle volumes in selected colors, where the volume is greater individually than the volumes of the trader's chosen number of preceding candles. Or the volume that is greater than the sum of volumes of the trader's chosen number of preceding candles.
The indicator mark selected volumes on the chart based on the type of candle. The candle type (1, 2, or 3) is determined by its result (close) relative to other candles.
Volume marked for a type 3 candle draws the trader’s attention to the lack of results from the applied volume compared to the previous candle, indicating potential weakness of the candle’s owner. This is especially important in buyer or seller context areas.
Volume marked for a type 2 candle highlights the presence of results from the applied volume but only relative to the previous candle. In buyer or seller context areas, this can signal weakness of the candle’s owner.
Volume marked for a type 1 candle signals a strong result from the applied volume, indicating potential strength of the candle’s owner.
The marking of volumes can be displayed either on the main chart or on the volume chart, depending on the trader's preference. Colors and symbols for marking can be customized on the Style tab.
Volumes can be filtered on both the volume chart and the main chart according to their marking. This feature can be useful, for example, for traders who don’t work with signs of buyer or seller weakness. In such cases, they can filter out volumes only for type 1 candles.
Good luck exploring the impact of volumes on price behavior!
Prime OscilatorPrime Oscilator is a powerful tool designed to help traders track momentum shifts and confirm trends in volatile markets. This oscillator-based tool integrates advanced market analysis techniques to provide a clear picture of momentum and trend direction, helping traders stay in sync with the prevailing market conditions.
Core Features of Prime Oscilator
Oscillator-Based Momentum Tracking: Prime Oscilator operates as a dynamic oscillator that tracks shifts in market momentum by analyzing the relationship between the A/D line and its signal line. This allows traders to identify potential changes in market direction and confirm trend strength.
Trend Confirmation Filter: Prime Oscilator incorporates a long-term trend filter, using a 50-period Simple Moving Average (SMA) to confirm whether the market is trending upward or downward. This helps traders focus on trades that align with the broader market direction.
Adaptive Signal Line: The oscillator’s signal line adjusts dynamically to reflect short-term momentum changes, allowing traders to react quickly to evolving market conditions. This makes the Prime Oscilator highly responsive to both fast-moving and stable markets.
Color-Coded Oscillator Line: The oscillator line changes color based on the current market conditions, providing a visual cue of momentum shifts. The line remains green during upward momentum and red during downward momentum, giving traders an easy way to gauge the market direction.
How Prime Oscilator Works
Prime Oscilator blends the power of trend analysis with momentum tracking to provide a comprehensive view of market conditions. By analyzing the Accumulation/Distribution (A/D) line and comparing it to a dynamic signal line, traders can monitor momentum shifts and confirm trends.
A/D Line Crossover: The indicator uses the relationship between the A/D line and the signal line to detect potential momentum changes. When the A/D line moves relative to the signal line, it reflects shifts in market momentum, allowing traders to follow the direction of the trend.
Trend Filtering: To ensure that momentum is aligned with the broader market direction, Prime Oscilator uses a 50-period SMA as a trend filter. This confirms whether the market is in an uptrend or downtrend and helps traders avoid focusing on short-term fluctuations that go against the prevailing trend.
Why It's Useful for Traders
Prime Oscilator is especially valuable for traders looking for a reliable way to track momentum shifts while aligning their trades with the overall market trend. This reduces noise and ensures that traders focus on opportunities that are in line with broader market movements.
Momentum-Based Trend Analysis: By tracking momentum changes, Prime Oscilator helps traders stay on top of potential market shifts without the noise that comes from traditional indicators.
Clear Visual Feedback: The color-coded oscillator line provides instant feedback on market conditions, allowing traders to focus on decision-making rather than analyzing multiple indicators.
Flexible Across Markets and Timeframes: Whether you are trading in volatile markets or more stable environments, Prime Oscilator adapts to different market conditions, ensuring you always have a clear picture of momentum and trend.
Prime Oscilator is ideal for traders who:
Scalp or trade intraday: Quickly captures momentum shifts in short timeframes.
Swing traders: Identifies potential trend reversals in higher timeframes while confirming momentum strength.
Trend followers: Ensures your trades are aligned with the prevailing market trend by confirming momentum shifts.
By combining momentum analysis with trend direction, Prime Oscilator offers a dynamic view of the market, helping traders navigate changing conditions with ease.
Why It's Worth Paying For
Prime Oscilator provides several unique advantages that make it a valuable tool for traders:
Clear and Actionable Insights: The oscillator-based momentum tracking gives traders a clear understanding of when the market's momentum is shifting, allowing for more informed trading decisions.
No Lagging: Unlike some trend-following indicators, Prime Oscilator reacts dynamically to market changes, helping traders stay aligned with the current market direction.
Adaptable and Flexible: Whether you trade on shorter timeframes or hold longer positions, Prime Oscilator adapts seamlessly to various market conditions. The trend filter ensures that traders remain aligned with broader market trends.
Visual Simplicity: The color-coded oscillator line and background shading provide an easy-to-read way of monitoring market conditions, enabling faster decision-making.
How to Get Access
To gain access to Prime Oscilator , please send me a direct message on TradingView or follow the provided link to request access. Ensure that access requests are made privately so the comments section remains focused on discussions related to the script’s performance and use.
Risk Disclaimer
While Prime Oscilator offers valuable insights into market momentum and trends, it’s important to note the following:
Past performance is not indicative of future results: Prime Oscilator ’s trend and momentum analysis are based on historical data, and no indicator can predict future price movements with certainty.
Market Conditions: The effectiveness of the Prime Oscilator may vary across different market conditions, and traders should always use proper risk management when trading.
Trading Risks: Like any trading tool, Prime Oscilator should be used as part of a comprehensive trading strategy that includes risk management techniques such as stop-loss orders and position sizing.

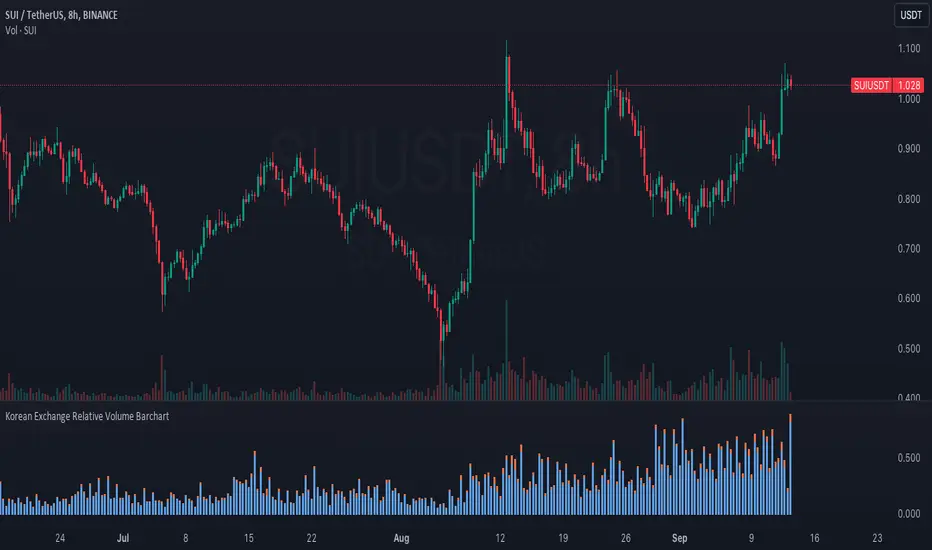
Korean Exchange Relative Volume BarchartKorean Exchange Relative Volume Barchart
The Korean Exchange Relative Volume Barchart indicator compares the trading volume of a cryptocurrency on any symbol with the combined volumes of major Korean exchanges, Upbit and Bithumb. This tool helps traders understand regional trading activities, offering insights into market sentiment influenced by Korean markets.
For example 0.5 would indicate that the Korean exchanges are doing 50% of the volume of the selected symbol.
Features:
Exchange Selection: Include or exclude Upbit and Bithumb in the comparison.
Automatic Symbol Mapping: Automatically maps the current chart's symbol to equivalent symbols on Upbit and Bithumb.
Stacked Bar Chart Visualization: Plots a stacked bar chart showing the relative volume contributions of Binance, Upbit, and Bithumb.
Usage:
Add the Indicator: Apply it to a cryptocurrency chart on TradingView.
Configure Settings: Toggle inclusion of Upbit and Bithumb in the settings.
Interpret the Chart: The stacked bar chart displays the proportion of trading volumes from each exchange.
Notes:
Symbol Compatibility: Ensure the cryptocurrency is listed on the Korean exchanges for accurate comparison.
Data Accuracy: Volumes are compared in the same base currency (e.g., BTC), so no exchange rate conversion is necessary.
Enhance your trading analysis by understanding the influence of Korean exchanges on cryptocurrency volumes with the Korean Exchange Volume Comparison indicator.
VWAP Periodic Close [LuxAlgo]The VWAP Periodic Close script offers an advanced tool for analyzing the Volume Weighted Average Price (VWAP) across various timeframes.
This tool enables traders to visualize VWAP close levels for daily, weekly, monthly, quarterly, and yearly periods, offering a comprehensive view of price behavior across different time frames. It helps in identifying key levels where the VWAP closes at the end of each specified period.
🔶 USAGE
This script is designed to enhance your trading strategy by plotting VWAP close levels on your chart for different time periods. This helps traders easily identify historical VWAP levels and analyze price action relative to these levels, particularly useful for identifying key support and resistance levels providing insights into potential future price behavior.
Supports VWAP closes for multiple timeframes, including historical periods (e.g., 3 months back, 3 quarters back, 3 years back). The labels provide context and detailed information about the VWAP close at a specific point in time and enhance the clarity and usefulness of the VWAP data presented on the chart.
Users can toggle the display of VWAP lines for different periods and customize the colors for each timeframe (e.g., distinct colors for monthly, quarterly, and yearly closes).
🔶 SETTINGS
The script offers a range of customizable settings to tailor the analysis to your trading needs.
🔹 Volume Weighted Average Price (VWAP)
VWAP Close Level: Toggle the display of VWAP levels at the end of each period (daily, weekly, monthly, quarterly, yearly).
VWAP Origin: Toggle the display of the VWAP line for each period.
VWAP Source: Choose the data source for VWAP calculations (default is HLC3).
Historical Closes: Define the number of historical VWAP levels to plot.
Line/Label Offset: Adjust the offset for positioning lines and labels on the chart.
🔹 Themes
Theme Selection: Choose between "Day," "Night," or "Custom" themes to adjust the color scheme of VWAP lines and labels.
