OSPL Volume [Community Edition]NSE:BANKNIFTY1!
This indicator is based on the concepts popularized by @OptionsScalper123 "Siva" of OiPulse. His ideology Is that large moves come after high volume candles. For Nifty, high volume is considered to be a candle above 125k volume and for BankNifty it’s 50k.
This indicator allows you to cut the noise and focus only on the high volume candle. It shows high volume candle in a brighter shade and lower volume candles in a less visible shade.
You can set the minimum volume threshold limit for Nifty and BankNifty. The indicator smartly recognizes which index you are using it in and uses the respective threshold volume limit.
All colors are customizable.
Thanks for Siva for all the ideas and wonderful products he has given to the community
Thanks to all the wonderful Pinescipters for developing awesome indicators and keeping the source open.
The source code of this indicator is just a few lines. Hope you can use it in your projects and learn something from this just how I learned from other scripts.
Any changes or updates needed in this indicator, please suggest. I was thinking some kind of alerts can be added when volume crosses the threshold. Let me know.
Boost/like this indicator and comment if you find this useful. Cheers and happy trading!!!
X-volume

Volume-Weighted Supertrend Strategy [wbburgin]This is a script that can be used as a strategy or a standalone indicator.
The Volume-Weighted Supertrend is a supertrend based on a rolling VWAP, instead of a normal price source. The strategy has two components - a supertrend based off of this VWAP (shown on the chart) and a supertrend from volume itself (not plotted on the chart directly). The supertrend from volume is an example of my "Supertrend Any Source" indicator, where a custom ATR is created from non-OHLC data; this is available as both a separate public script and also in my "wbburgin_utils" library for you to use in your own script creation.
The supertrend from volume acts as a confirmation filter for the VWAP-supertrend shown on-chart. If the volume supertrend is trending up and the VWAP-based supertrend is also trending up, a buy signal is generated. Likewise, if the volume supertrend is trending down and the VWAP-supertrend is trending down, a sell signal is generated. The colors are based off of whether both supertrends are trending up or down: green for both up, blue for only price up, orange for only price down, and red for both down.
The settings enable you to change the volume length and the ATR length separately, as well as the multiplier and the source for the price supertrend. If you load the indicator for the first time and see no entries and exits, this is because "Show Strategy Entries and Exits" is disabled in the settings. This is if you plan on using the strategy as an indicator and don't want to be bothered by the entry and exit symbols on the chart. Additionally, for those who like clean charts (like me), you can turn all the labels off in the settings, as well as the highlighting.
My default strategy settings for the strategy results shown below are as follows: 5% equity per trade, 5 degrees of pyramiding, commissions of 0.08% per trade. This strategy doesn't come with stops yet, so please be aware of that before using it to trade - I highly suggest you create your own stops based off of your R/R ratio and personal risk tolerance. Additionally, it works best on trending assets (b/c of the supertrends) with high volume. This might mean it does not work as well on lower timeframes.

Average Daily Volume with Anomalies A trigger program to print volume triggers on stocks that are being watched.
It helps with identifying the trigger volume on a candle and helps determine whether one can enter a position or not.

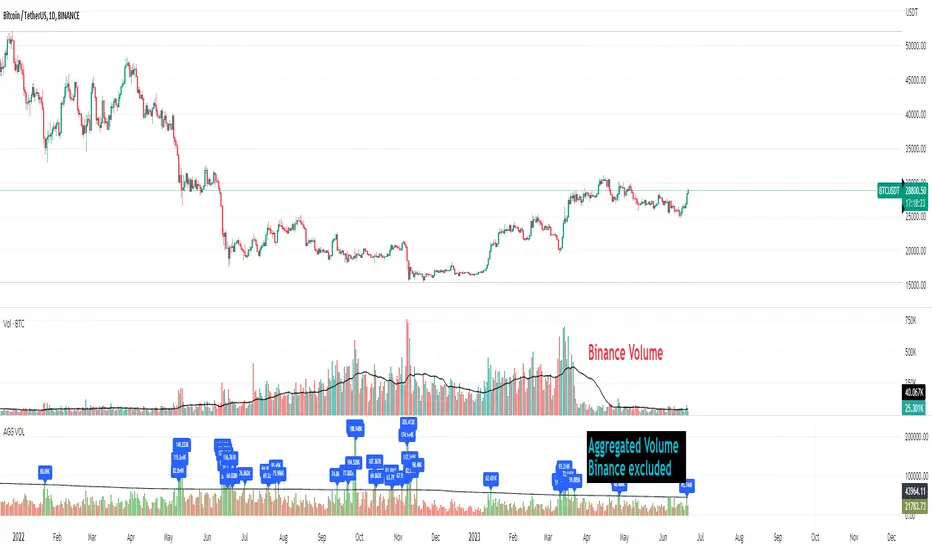
Crypto Aggregated Volume «NoaTrader»If you use volume in your crypto analysis, you may have encountered the situation which an exchange's policy change can affect your judgement falsely. For example, you can see the huge difference of volume on the given chart since binance transferred its fee discount from USDT to TUSD pair.
This script sums up volume of all major centralized exchanges ( according to coinmarketcap ) on the symbol you are visiting and has an option to exclude Binance's volume which can give you a more stable understanding for judgement when needed (and you can see the difference on the chart).
The colors also give a good vision about the relative volume in the area which can show the interest of market in trading.
The script only aggregates the same symbol on different exchanges and does not get the volume from other pairs.
Included CEXs are:
binance
bitstamp
coinbase
huobi
kraken
bitfinex
bybit
okx
kucoin
bithumb
VOLD Ratio (Volume Difference Ratio) by TenozenAnother helpful indicator is here! VOLD Ratio is calculated by the net volume of a buying candle, divided by the net volume of a sell candle.
Formula:
buying net volume/selling net volume
It's a simple indicator, but don't underestimate this simplicity. It's a powerful indicator that would help you to decide whether the volume is getting interested in the direction that the market would take. So assume when the market is above the Bollinger Bands, it means that the volume is at a buying extreme, by that, we could expect the market to get back towards the mean, as there is a lot of buying demand that entered the market. How about below the Bollinger Bands? it means that the volume is at a selling extreme, we could expect that there is a lot of volume getting in toward the sellers, so we could take advantage of the opportunity to go for a long. Lastly, the Bollinger Bands would help you guys to determine the liquidity of the market, if the Bollinger Bands get smaller over time, it means there is no interest for the market to enter yet, and if the Bollinger Bands get bigger over time, it means there is interest for the market to enter in the session.
Tips & Reminder:
- We shouldn't use this indicator by itself, make sure to use an Indicator that would help you guys to determine the momentum and the liquidity of the market.
- The higher the timeframe, the slower this indicator would signal an entry, by that use a smaller timeframe... I suggest using a 15M chart for the execution.
- Always trade in the medium-longterm direction if you want to have a high probability trade.
- Be patient in your execution, it's more likely the market would go higher or lower after going in the extreme of the Bollinger Bands.
Well, that's it! Hope you guys enjoy using this indicator, let me know if there is any question or suggestion. Ciao...

MonkeyblackmailThis script consists of several sections. test it and tell me your concerns. a lot of more works will be done
Volume Accumulation : The first part of the script checks for a new 5-minute interval and accumulates the volume of the current interval. It separates the volume into buying volume and selling volume based on whether the closing price is closer to the high or low of the bar.
Volume Normalization and Pressure Calculation : The script then normalizes the volume with a 20-period EMA, and calculates buying pressure, selling pressure, and total pressure. These calculations provide insight into the underlying demand (buying pressure) and supply (selling pressure) conditions in the market.
RSI Calculation and Overbought/Oversold Conditions : The script calculates the RSI (Relative Strength Index) and checks whether it is in an overbought (RSI > 70) or oversold (RSI < 30) state. The RSI is a momentum indicator, providing insights into the speed and change of price movements.
Volume Condition Check and Wondertrend Indicator : The script checks if the volume is high for the past five bars. If it is, it applies the Wondertrend Indicator, which uses a combination of the Parabolic SAR (Stop and Reverse) and Keltner Channel to identify potential trends in the market.
Swing High/Low and Fibonacci Retracement : The script identifies swing high and swing low points using a specified pivot length. Then, it draws Fibonacci retracement levels between these swing high and swing low points.
he monkeyblackmail script works well in the 5 minutes chart and combines several elements of technical analysis, including volume analysis, momentum indicators, trend-following indicators, volatility channels, and Fibonacci retracements. It aims to provide a comprehensive view of the market condition, highlighting key levels and potential trends in an easily understandable format. Don’t be too quick to start trading with it, first study how it work and you will blackmail the market.

B/S Volume with Timeframe InputDaytrading For Success's volume indicator with timeframe input selection added. Example shown is 1 minute time frame with 5 minute input selected.

Volume Profile Bar-Magnified Order Blocks [MyTradingCoder]Introducing "Volume Profile Bar-Magnified Order Blocks", an innovative and unique trading indicator designed to provide traders with a comprehensive understanding of market dynamics. This tool takes the concept of identifying order blocks on your chart and elevates it by integrating a detailed volume profile within each order block zone.
Unlike standard order block indicators, Volume Profile Bar-Magnified Order Blocks pulls data from lower timeframe bars and assigns it to various segments of the order block. By providing this volume profile inside the order block, the indicator supplies a deeper, multi-dimensional view of market activity that can enhance your trading decisions.
Crucially, users have the ability to fine-tune the detection of order blocks. This is made possible through a single input setting called "Tuning". This integer value allows you to control the significance and frequency of the order blocks. Higher numbers will produce more significant order blocks, though they will appear less frequently. Lower numbers, on the other hand, will yield less significant order blocks, but they will occur more often. This enables you to adjust the sensitivity of the indicator according to your specific trading strategy and style.
Key Settings:
Number of Segments: Customize the level of detail in your volume profile by selecting the number of segments you want inside each order block.
Tuning: Adjust the sensitivity of order block detection to align with your trading strategy. Higher values produce more significant but less frequent order blocks, while lower values yield less significant but more frequent order blocks.
Color Inputs: Personalize the look of your chart by selecting the colors for various elements of the indicator. This ensures a seamless integration with your current chart aesthetics and improves visual clarity.
Here is a s creenshot that beautifully demonstrates the power of this indicator. You'll see how the price rejects perfectly off the highest volume segment in an order block, showcasing the indicator's potential for pinpointing high-impact price levels.
While Volume Profile Bar-Magnified Order Blocks offers many unique features, it should be used in conjunction with other indicators and forms of analysis for a complete trading strategy. As with all tools, it does not guarantee profitable trades but is intended to give traders more information to base their decisions on. Use it to complement your existing analysis and enhance your understanding of market behavior.
Experience a new level of clarity in your trading with Volume Profile Bar-Magnified Order Blocks - an indicator that goes beyond the surface to help you navigate the markets more effectively.

ETN - Volume CandleHighlights candlestick based on volume data.
Indicator looks back and analyzing volume to find the volume bar with the largest numerical value
Indicator highlights the corresponding candlestick .
Indicator marks the high and low of that candlestick.
Users can adjust lookback period. Default is set to 50 .
Users can adjust how the indicator plots the high and low.
I currently have the high and low not being displayed on the charts until I come up with a better version.
On my chart, indicator colored the candlesticks YELLOW.
improved volumeIt is an indicator that displays the trading volume.
Red-colored candle bars indicate a decrease in trading volume.
Green-colored candle bars indicate an increase in trading volume.
The transparent yellow cloud above the volume bars represents the 21-bar moving average volume, which shows the average volume over the specified period. (You can change the number of bars and the type of moving average from the indicator settings.)
This allows for easier comparison between the current trading volume and the average volume.
In the price scale section, there are 4 target levels. They represent the following in ascending order: Average volume, Average volume multiplied by 2, Average volume multiplied by 3, Average volume multiplied by 4.
Additionally, you can use the alarm feature based on these average volume levels.

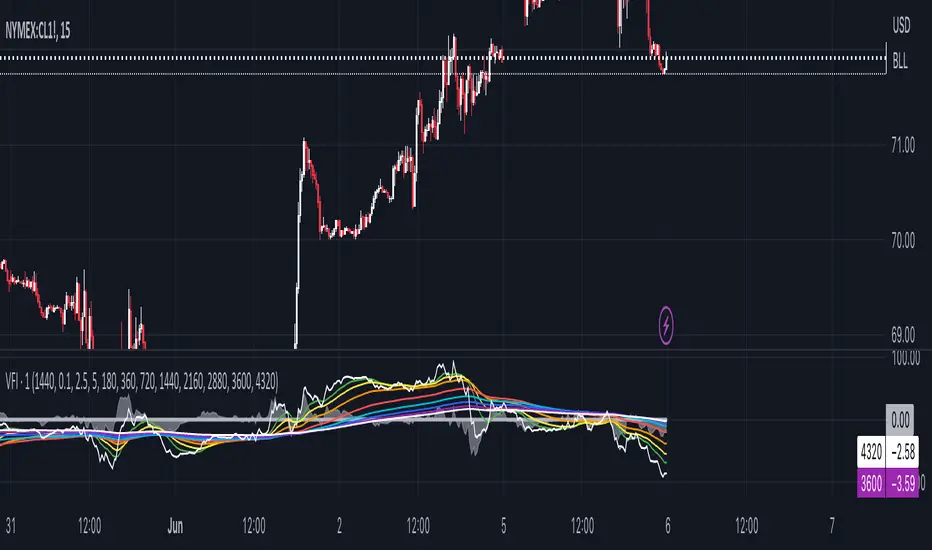
1 min Volume Flow Indicator (VFI) with EMA ribbonOriginally Markos Katsanos' indicator that LazyBear made popular here on TW. Now updated to Pine Script version 5, which makes multi-timeframe charting easier.
The initial Katsanos' idea for the indicator is the following:
"The VFI is based on the popular On Balance Volume (OBV) but with three very important modifications:
Unlike the OBV, indicator values are no longer meaningless. Positive readings are bullish and negative bearish.
The calculation is based on the day’s median instead of the closing price.
A volatility threshold takes into account minimal price changes and another threshold eliminates excessive volume. ...
A simplified interpretation of the VFI is that values above zero indicate a bullish state and the crossing of the zero line is the trigger or buy signal.
The strongest signal with all money flow indicators is of course divergence.
The classic form of divergence is when the indicator refuses to follow the price action and makes lower highs while price makes higher highs (negative divergence). If price reaches a new low but the indicator fails to do so, then price probably traveled lower than it should have. In this instance, you have positive divergence."
I set up default settings for intraday trading I personally have found the most useful. And what I have found useful is how and which volume flows in and out on 1 min chart. For 1 min volume flow I find it convenient to have specific EMAs as guidance: 360, 720, 1440, 2160, 2880, 3600, 4320 -- the logic is derived from how many minutes there are per specific hours and days. Since short term trends typically last for three days, 1440 and 4320 EMAs are the ones I myself concentrate the most. That is to say, quite often 1min volume flow pivots around 1440 and 4320 EMAs.
If you want to see 1 min volume flow on some other timeframe than 1 min, change the timeframe in the settings.
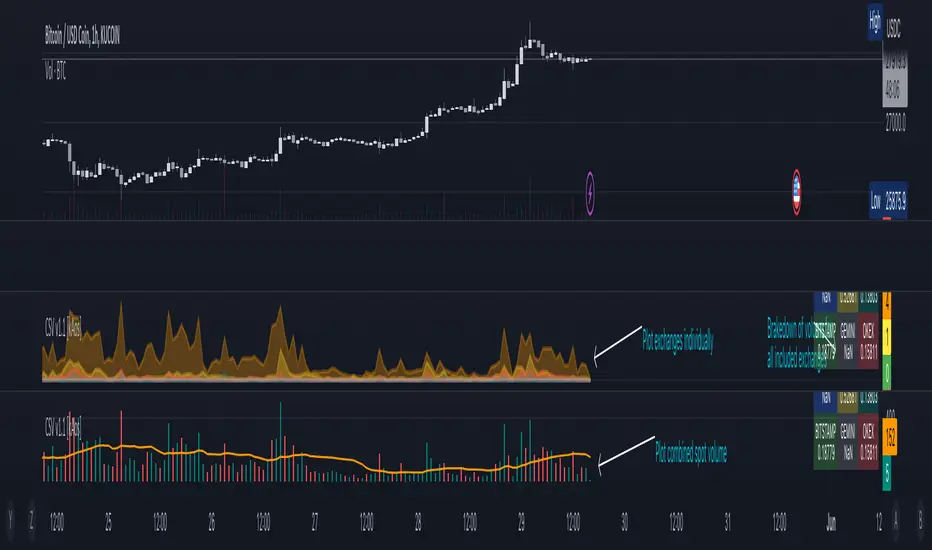
Combined Spot Volume | Crypto v1.1 [kAos]This script combines the "ticker volume" from 9 different exchanges. The default settings are for Crypto Assets only. In the settings window you can choose to plot the "combined volume" in a histogram form or "individual exchange volume" in an area view. (as shown on the chart) Addition to the plots there is also an Info Table in the bottom right corner that brakes down the volume to individual exchanges, shows how much volume was traded on which exchange. If the Table shows "NaN" on an exchange you need to check the spelling of that exchange, if thats correct, than the ticker is not available on that exchange.
Volume accumulation [TCS] | VTAThe indicator calculates buy and sell volume values for different look-back periods, based on the high, low, close, and tick volume data of the chart.
The calculated buy and sell volume values are stored in separate variables, which represent cumulative volume values over the respective look-back periods.
It's important to note that the code provided calculates the buy and sell volume values individually for each look-back period and after sum them.
It can be useful to understand who is in control of the market based on the look-back period.
For example if the price is decreasing but the volume in the past candle are bullish it means that the trend probably will turn.
Please note that this indicator is for educational purposes only and should not be used for trading without further testing and analysis.

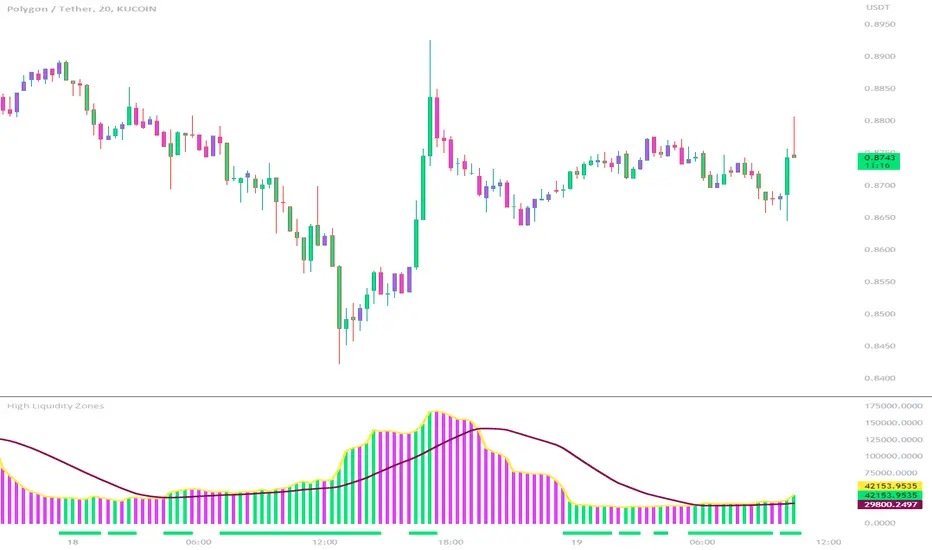
High Liquidity Zones and Threshold VolumeThe High Liquidity Zones indicator is designed to identify areas of significant liquidity in the market. It helps traders recognize regions where trading volume is notably higher, indicating potential areas of increased market activity and interest.
The indicator calculates the average volume over a specified lookback period, which can be customized according to individual preferences. This average volume acts as a reference point to determine the threshold volume level. The threshold percentage input allows users to set the sensitivity of the indicator, defining the minimum volume required for an area to be considered a high liquidity zone.
When the current volume surpasses the threshold volume level, the indicator highlights these areas as high liquidity zones. This visual representation allows traders to quickly identify and focus on periods of heightened trading activity. The high liquidity zones are marked with square shapes below the histogram, providing a clear visual indication on the chart.
The first plot line represents the threshold volume level as a histogram, showing the volume levels in relation to the threshold. This histogram helps traders assess the magnitude of the volume in the identified high liquidity zones.
The second plot line represents the threshold volume's simple moving average (SMA) over the lookback period. The SMA acts as a reference line, smoothing out fluctuations in the threshold volume and providing a more stable measure of high liquidity zones. Traders can use this line to better understand the overall trend and dynamics of liquidity.
The High Liquidity Zones indicator offers flexibility, allowing traders to adapt it to their preferred trading style and timeframe. By adjusting the lookback period and threshold percentage, users can fine-tune the sensitivity of the indicator based on their trading strategies and market conditions.
Furthermore, traders can combine the High Liquidity Zones indicator with other technical analysis tools to confirm trading signals or identify areas of potential support and resistance. It can help them locate price levels where market participants have a substantial presence and where significant buying or selling pressure may occur.
Overall, the High Liquidity Zones indicator is a valuable tool for traders seeking to gain insights into market liquidity dynamics. By highlighting areas of intense trading activity, it assists in making informed trading decisions and identifying opportunities within the market.
Open Interest Profile [Fixed Range] - By LeviathanThis script generates an aggregated Open Interest profile for any user-selected range and provides several other features and tools, such as OI Delta Profile, Positive Delta Levels, OI Heatmap, Range Levels, OIWAP, POC and much more.
The indicator will help you find levels of interest based on where other market participants are opening and closing their positions. This provides a deeper insight into market activity and serves as a foundation for various different trading strategies (trapped traders, supply and demand, support and resistance, liquidity gaps, imbalances,liquidation levels, etc). Additionally, this indicator can be used in conjunction with other tools such as Volume Profile.
Open Interest (OI) is a key metric in derivatives markets that refers to the total number of unsettled or open contracts. A contract is a mutual agreement between two parties to buy or sell an underlying asset at a predetermined price. Each contract consists of a long side and a short side, with one party consenting to buy (long) and the other agreeing to sell (short). The party holding the long position will profit from an increase in the asset's price, while the one holding the short position will profit from the price decline. Every long position opened requires a corresponding short position by another market participant, and vice versa. Although there might be an imbalance in the number of accounts or traders holding long and short contracts, the net value of positions held on each side remains balanced at a 1:1 ratio. For instance, an Open Interest of 100 BTC implies that there are currently 100 BTC worth of longs and 100 BTC worth of shorts open in the market. There might be more traders on one side holding smaller positions, and fewer on the other side with larger positions, but the net value of positions on both sides is equivalent - 100 BTC in longs and 100 BTC in shorts (1:1). Consider a scenario where a trader decides to open a long position for 1 BTC at a price of $30k. For this long order to be executed, a counterparty must take the opposite side of the contract by placing a short order for 1 BTC at the same price of $30k. When both long and short orders are matched and executed, the Open Interest increases by 1 BTC, indicating the introduction of this new contract to the market.
The meaning of fluctuations in Open Interest:
- OI Increase - signifies new positions entering the market (both longs and shorts).
- OI Decrease - indicates positions exiting the market (both longs and shorts).
- OI Flat - represents no change in open positions due to low activity or a large number of contract transfers (contracts changing hands instead of being closed).
Typically, we monitor Open Interest in the form of its running value, either on a chart or through OI Delta histograms that depict the net change in OI for each price bar. This indicator enhances Open Interest analysis by illustrating the distribution of changes in OI on the price axis rather than the time axis (akin to Volume Profiles). While Volume Profile displays the volume that occurred at a given price level, the Open Interest Profile offers insight into where traders were opening and closing their positions.
How to use the indicator?
1. Add the script to your chart
2. A prompt will appear, asking you to select the “Start Time” (start of the range) and the “End Time” (end of the range) by clicking anywhere on your chart.
3. Within a few seconds, a profile will be generated. If you wish to alter the selected range, you can drag the "Start Time" and "End Time" markers accordingly.
4. Enjoy the script and feel free to explore all the settings.
To learn more about each input in indicator settings, please read the provided tooltips. These can be accessed by hovering over or clicking on the ( i ) symbol next to the input.

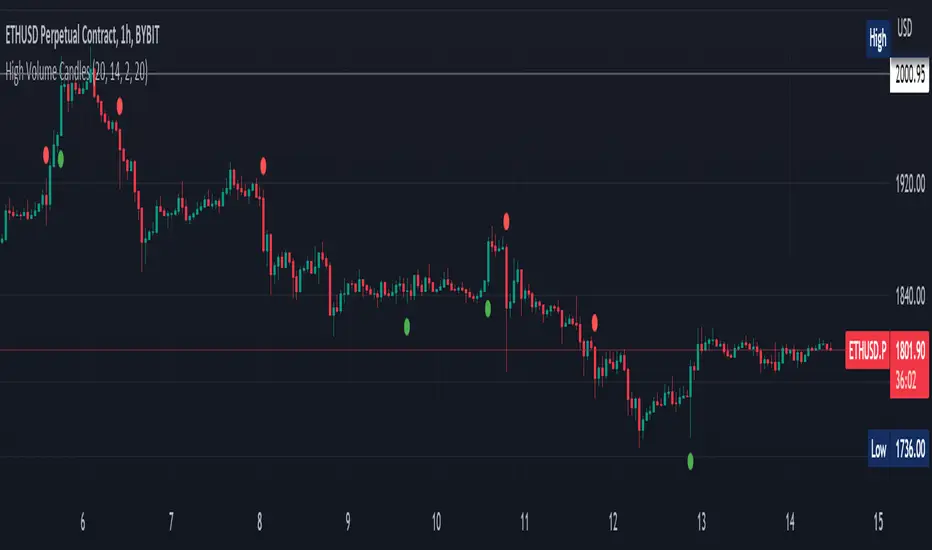
High Volume Candles Detector - Open Source CodeGreetings, fellow traders!
Throughout my trading career, I've been intrigued by the dynamic interplay between candlestick patterns and trading volume. This fascination led me to develop an open-source indicator to help illuminate these patterns for the broader trading community.
Upon researching the Public Library, I found that many indicators relating to candlestick/volume analysis are proprietary and not open-source. This discovery further fueled my commitment to contribute a free, accessible tool that traders of all levels can utilize in their technical analysis.
Thus, I am excited to present to you our High Volume Bars Indicator. A unique tool that I believe fills a gap in the Public Library. I truly hope you find it beneficial in your trading journey and that it empowers you to make more informed decisions.
Description:
The High Volume Bars Detector is designed to help traders identify bars with significantly higher volume than the average. Users can filter in the settings menu:
1) The length of the Simple Moving Average (SMA) for volume, allowing you to define the average volume over a specific number of bars.
2) The Volume Multiplier, a factor that determines how much greater the volume of a bar should be compared to the SMA to qualify as a high-volume bar.
3) The Lookback Period, a specified number of candles used as a comparative benchmark for identifying the highest volume.
4) If the Volume bar is green or red, so if the candle price is --> close > open or open > close
Examples to better understand the logic of the indicator:
1) Length of the Simple Moving Average (SMA) for Volume: This setting allows you to define the average volume over a specific number of bars. For instance, if you set the SMA length to 20, the indicator will calculate the average volume of the past 20 bars and use it as a baseline to identify high volume bars.
2) Volume Multiplier: This is a critical factor that determines the threshold for what constitutes a high-volume bar. If you set the volume multiplier to 2.0, for example, the indicator will flag any bar where the volume is twice the value of the SMA volume as a high-volume bar.
3) Lookback Period: This setting lets you specify the number of candles that the indicator should consider when determining the highest volume. For instance, if the lookback period is set to 14, the indicator will compare the volume of the current bar with the volumes of the previous 14 bars. If the current bar's volume is the highest, it will be flagged.
4) Volume Bar Color: This filter helps you identify whether a high-volume bar is bullish or bearish. If the bar is green (close > open), it suggests buyers were dominant during that period. If the bar is red (open > close), it suggests sellers had the upper hand. By setting this filter, you can choose to focus on high volume bars that are either bullish (green) or bearish (red) or both, depending on your trading strategy.
Remember, these filters offer a level of customization that allows you to tailor the High Volume Bars Detector to your unique trading style and requirements. Always remember to adapt these settings to align with your overall trading plan and risk tolerance.
Keep attention!
It is important to note that no trading indicator or strategy is foolproof, and there is always a risk of losses in trading. While this indicator may provide useful information for making conclusions, it should not be used as the sole basis for making trading decisions. Traders should always use proper risk management techniques and consider multiple factors when making trading decisions.
Support me:)
If you find this new indicator helpful in your trading analysis, I would greatly appreciate your support! Please consider giving it a like, leaving feedback, or sharing it with your trading network. Your engagement will not only help me improve this tool but will also help other traders discover it and benefit from its features. Thank you for your support!
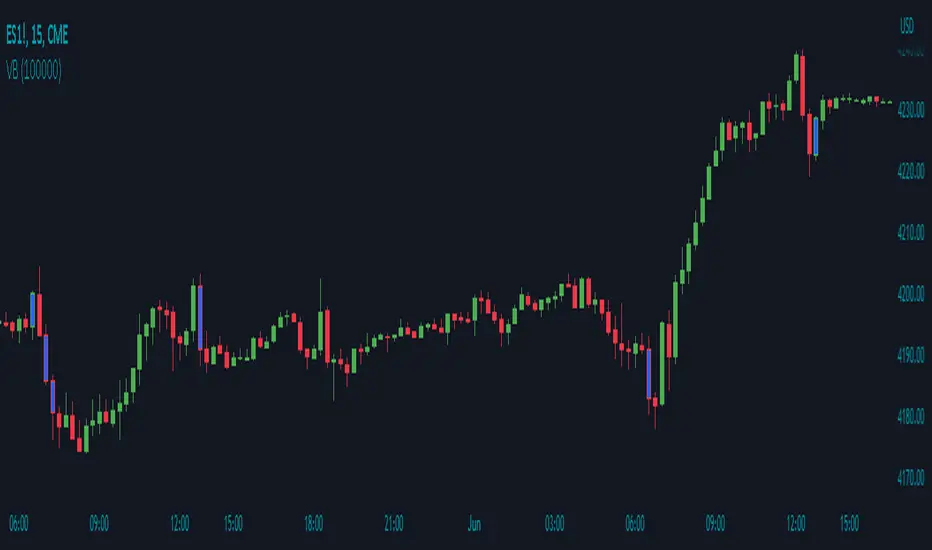
Volume Breakout by Chosen VolumeDescription:
The Volume Breakout indicator (VB) is a technical analysis tool that highlights candles with significant trading volume. It helps traders identify potential breakout periods characterized by high volume activity.
How it Works:
The Volume Breakout indicator compares the volume of each candle with a user-defined minimum volume threshold. If the volume of a candle exceeds or is equal to the specified minimum volume requirement, the indicator identifies it as a volume breakout and marks it accordingly.
Usage:
To effectively utilize the Volume Breakout indicator, follow these steps:
1. Apply the VB indicator to your chart by adding it from the available indicators.
2. Customize the minimum required volume parameter according to your trading preferences. This parameter determines the threshold volume level that a candle must meet or exceed to be considered a breakout candidate.
3. Observe the candles on the chart:
- Candles that meet or exceed the minimum required volume are highlighted with a specific color (yellow by default), indicating potential breakout periods.
4. Pay attention to the volume breakout indications within the candles, as they suggest periods of increased trading activity.
5. Analyze the price action accompanying the volume breakout candles. Breakouts often indicate a surge in buying or selling pressure, potentially leading to significant price moves or trend reversals.
6. Combine the analysis of volume breakout candles with other technical analysis tools, such as trend lines, support and resistance levels, or indicators, to confirm potential trade setups.
7. Implement appropriate risk management strategies, including setting stop-loss orders and position sizing, to manage your trades effectively and protect your capital.
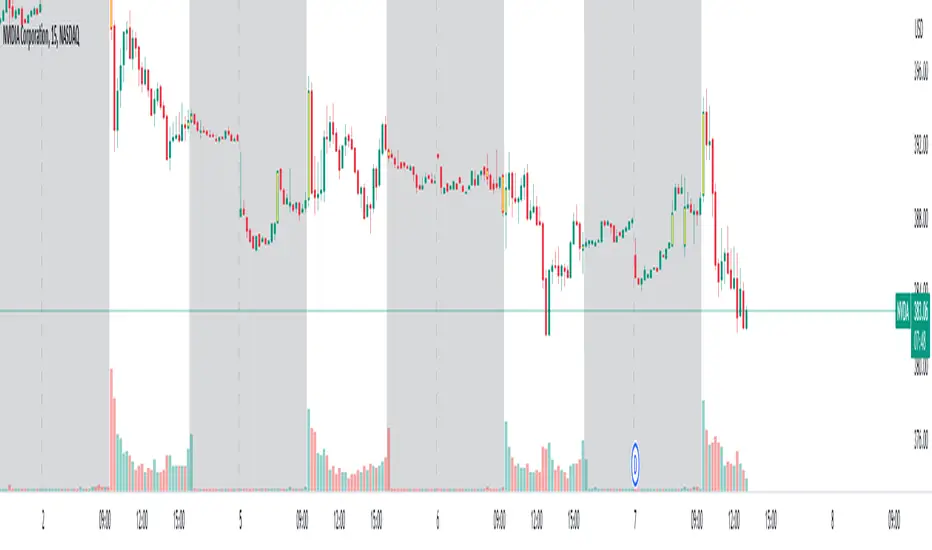
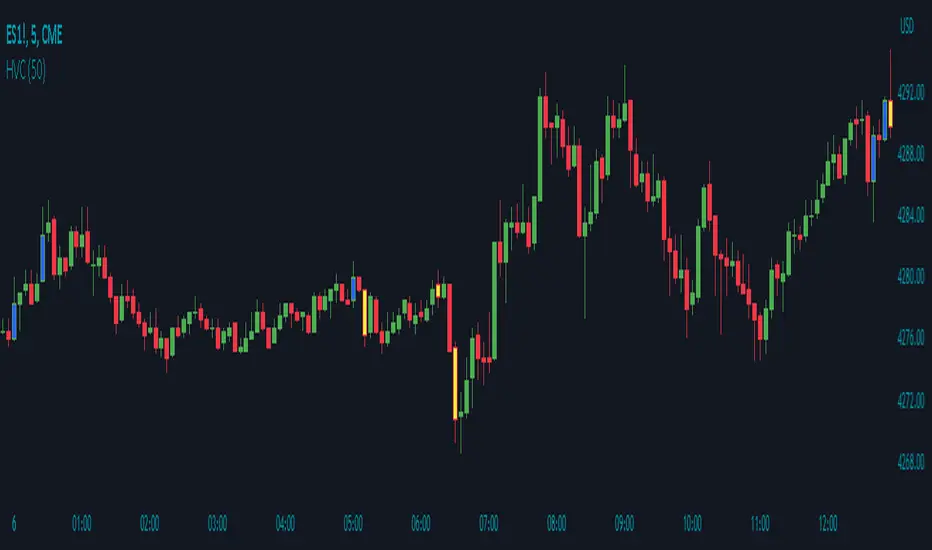
High Volume Candles by Time PeriodDescription:
The High Volume Candles indicator (HVC) is a technical analysis tool designed to identify candles with high trading volume. It allows traders to quickly spot periods of significant market activity based on volume.
How it Works:
The HVC indicator analyzes the volume of each candle in relation to the highest volume observed over a specified lookback period. The indicator compares the current volume with the highest volume within the defined lookback period and identifies candles that have volume equal to or greater than this threshold. It then distinguishes between bullish and bearish candles and assigns custom colors to highlight these high volume occurrences.
Usage:
To effectively utilize the High Volume Candles indicator, follow these steps:
1. Apply the HVC indicator to your chart by adding it from the available indicators.
2. Customize the lookback period according to your trading preferences. This parameter determines the number of previous candles to consider when calculating the highest volume.
3. Observe the candles on the chart:
- Bullish candles (blue by default) indicate periods of high volume when the closing price is higher than the opening price.
- Bearish candles (yellow by default) indicate periods of high volume when the closing price is lower than the opening price.
4. Pay attention to the color-coded volume indications within the candles, which highlight periods of high trading activity.
5. Analyze the volume patterns in conjunction with price action to identify potential trading opportunities. High volume candles often indicate increased market participation and can suggest significant price moves or reversals.
6. Combine the analysis of high volume candles with other technical analysis tools, such as trend lines, support and resistance levels, or indicators, to confirm potential trade setups.
7. Implement appropriate risk management strategies, including setting stop-loss orders and position sizing, to manage your trades effectively and protect your capital.
Volume Tick ExperimentThis ticks-based indicator provides real-time volume information for a trading asset. Volume is analyzed and updated continuously, not just at candle close. It is based on DGT's Bull vs Bear Power indicator but adds a gas signal that activates when buying or selling volume percentage reaches a predetermined threshold.
This indicator can also help traders determine the direction and aggressiveness of pushes in buying or selling volume. By monitoring the volume percentages and gas signals, traders can get an idea of whether the market is pushing in a particular direction and how strong the push is. This information can be helpful in making trading decisions and identifying potential entry or exit points.
The indicator uses open, high, low, and close prices of the asset to calculate volume information. It determines the average volume over a selected period and calculates volume for both buying and selling. This information is used to calculate the percentage of buying and selling volume. A gas signal is triggered when either the buying or selling percentage reaches a predetermined threshold.
Enjoy!

Open Interest All ExchangesThe indicator collects data from available exchanges based on open interest. The indicators are calculated in the amount of Bitcoin.
Below are the tickers of the exchanges that provide the data:
- BITFINEX:BTCUSD
- BITFINEX:BTCUST
- KRAKEN:BTCUSDPERP
- BITMEX:XBTUSD
- BITMEX:XBTUSDT
- BINANCE:BTCUSDTPERP
- BINANCE:BTCUSDPERP (due to low volumes and limitations of 40 requests of the request.security function, the code contains data without using the calculation)
For me, Open Interest indicators play an important role in the trading system, for this reason I share with you. I am not a financial advisor.
**Open for cooperation**
Volume Shaded CandlesDescription:
The Volume Shaded Candles indicator (VSC) is a technical analysis tool designed to represent price candles on a chart with transparency based on the volume traded during each candle. This overlay indicator enhances visual analysis by providing a visual representation of volume intensity.
How it Works:
The VSC indicator calculates the volume-to-transparency ratio by dividing the current volume by the highest volume within the last 10 periods. The ratio is then used to determine the shading intensity of the price candles. Higher volume relative to the recent highest volume results in lower transparency, while lower volume results in higher transparency.
Usage:
To effectively utilize the Volume Shaded Candles indicator, follow these steps:
1. Apply the Volume Shaded Candles indicator to your chart by adding it from the available indicators.
2. Configure the indicator's inputs:
- Specify the color for bullish candles using the "Bullish Color" input.
- Specify the color for bearish candles using the "Bearish Color" input.
3. Observe the shaded candles on the chart:
- Bullish candles are colored with the specified bullish color and shaded according to the volume intensity.
- Bearish candles are colored with the specified bearish color and shaded according to the volume intensity.
4. Interpret the shaded candles:
- Darker shading indicates higher volume during the corresponding candle.
- Lighter shading indicates lower volume during the corresponding candle.
5. Combine the analysis of shaded candles with other technical analysis tools, such as trend lines, support and resistance levels, or candlestick patterns, to identify potential trade setups.
6. Implement appropriate risk management strategies, including setting stop-loss orders and position sizing, to manage your trades effectively and protect your capital.
Awesome Cumulative Volume OscillatorThe indicator is called the "Awesome Cumulative Volume Oscillator" (ACVO), which analyzes the cumulative trading volume of the underlying asset.
The indicator also plots the deviation of the cumulative trading volume from the first SMA value, which is referred to as the "Cumulative Volume Deviation". The zero-line is plotted as a reference point.
If the "Cumulative Volume Deviation" is greater than 0, it indicates an uptrend, as the cumulative trading volume is above the first SMA value. If the "Cumulative Volume Deviation" is less than 0, it indicates a downtrend, as the cumulative trading volume is below the first SMA value.
However, it is important to note that using a single indicator is not sufficient to conduct a comprehensive market analysis. It is necessary to combine multiple indicators and analysis methods to make informed trading decisions.

Volume Profile Matrix [LuxAlgo]The Volume Profile Matrix indicator extends from regular volume profiles by also considering calculation intervals within the calculation window rather than only dividing the calculation window in rows.
Note that this indicator is subject to repainting & back-painting, however, treating the indicator as a tool for identifying frequent points of interest can still be very useful.
🔶 SETTINGS
Lookback: Number of most recent bars used to calculate the indicator.
Columns: Number of columns (intervals) used to calculate the volume profile matrix.
Rows: Number of rows (intervals) used to calculate the volume profile matrix.
🔶 USAGE
The Volume Profile Matrix indicator can be used to obtain more information regarding liquidity on specific time intervals. Instead of simply dividing the calculation window into equidistant rows, the calculation is done through a grid.
Grid cells with trading activity occurring inside them are colored. More activity is highlighted through a gradient and by default, cells with a color that are closer to red indicate that more trading activity took place within that cell. The cell with the highest amount of trading activity is always highlighted in yellow.
Each interval (column) includes a point of control which highlights an estimate of the price level with the highest traded volume on that interval. The level with the highest traded volume of the overall grid is extended to the most recent bar.
