Volume Profile [LuxAlgo]Displays the estimate of a volume profile, with the option to show a rolling POC (point of control). Users can change the lookback, row size, and various visual aspects of the volume profile.
Settings
Basic:
Lookback: Number of most recent bars to use for the calculation of the volume profile
Row Size: Determines the number of rows used for the calculation of the volume profile
Show Rolling POC: Determines whether to display the rolling POC of the volume profile
Style:
Width (% of the box): Determines the length of the bars relative to the Lookback value
Bar Width: Width of each bar
Flip Histogram: Flips the histogram, when enabled, the histogram base will be located at the most recent candle
Gradient: Allows to color the volume profile bars with a gradient, with a color intensity determined by the length of each bar
Rows Solid Color: Color of each bar when 'Gradient' is disabled
POC Solid Color: Color of the POC when 'Gradient' is disabled
Usage
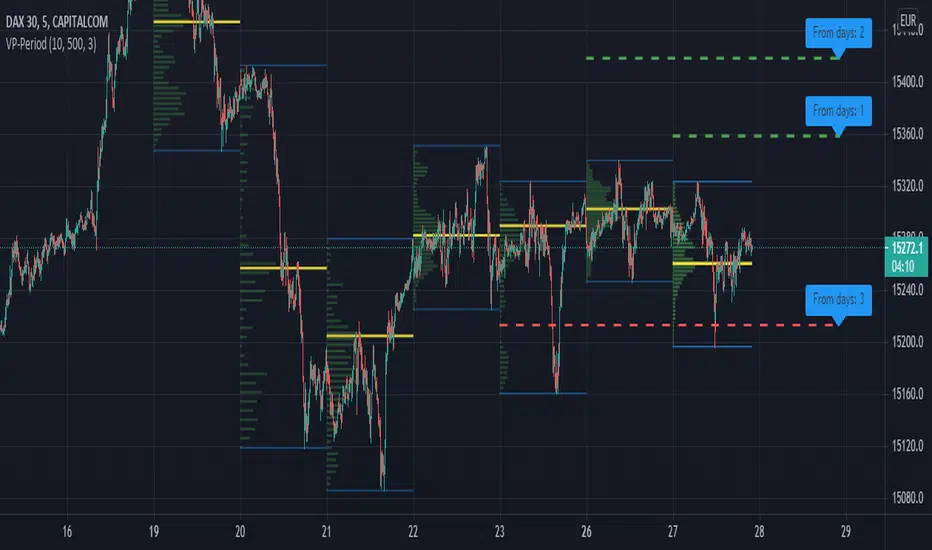
It is very common to display volume over time in order to visualize the trading activity made over a specific candle, however this is not the only way to display volume and it can be interesting to put it in relation with the price, which is what volume profiles do.
Volume profiles are displayed as price relative histograms showing the accumulated volume within certain price areas, the number of areas are determined by the row size of the volume profile. Knowing which price's area accumulated the most volume allow highlighting areas of interest to market participants.
Most accumulated volume will be encountered in zones of equilibrium between buyers and sellers; that is zones of local price stationarity. These zones are highlighted by high volume nodes in the volume profile. Imbalance between buyers and sellers are highlighted by thinner zones of the volume profile.
The price level with the most accumulated volume is highlighted by the "point of control" (POC), displayed by the dotted line in the indicator.
The POC is often considered an important level, commonly used as support/resistance by traders. One can verify the accuracy of this use case by using the rolling POC (assuming one would use the POC over time as SR).
Indicator Limitations
Volume profiles are calculated using tick data, which is not the case of this estimate, as such you won't have an accurate representation of an actual volume profile.
The rolling POC can introduce time outs in the script computation, use lower lookback and row size value to display it.
X-volume

Average Dollar VolumeDollar volume is simply the volume traded multiplied times the cost of the stock.
Dollar volume is an extremely important metric for finding stocks with enough liquidity for market makers to position themselves in. Market Liquidity is defined as market's feature whereby an individual or firm can quickly purchase or sell an asset without causing a drastic change in the asset's price. The key concept you want to understand is that these big instructions with billions of dollars need liquidity in a stock in order to even think about buying it, and therefore these institutions will demand a large dollar volume. A good dollar volume amount, that represents a pretty liquid name, is typically above 100 million $ average. Why are institutions important? Simple because they are the ones who make stocks move, and I mean really move. If you want to see large growth from a stock in a short amount of time, you need institutions wielding billions of dollars to be fighting one another to buy more shares. Institutions are the ones who make or break a stock, this is why we call them market makers.
My script calculates average dollar volume using four averages: the 50, the 30, the 20, and the 10 period. I use multiple averages in order to provide the accurate and up to date information to you. It then selects the minimum of these averages and divides this value by 1 million and displays this number to you.
TL;DR? If you want monster moves from your stocks, you need to pick names with average high liquidity(dollar volume >= $100 million). The number presented to you is in millions of whatever currency the name is traded in.

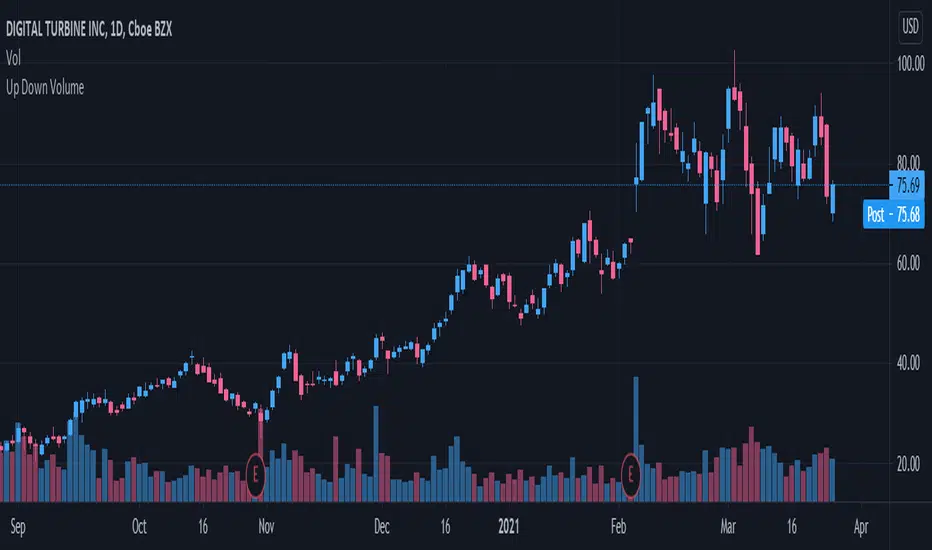
Up/Down Volume RatioUp/Down Volume Ratio is calculated by summing volume on days when it closes up and divide that total by the volume on days when the stock closed down.
High volume up days are typically a sign of accumulation(buying) by big players, while down days are signs of distribution(selling) by big market players. The Up Down volume ratio takes this assumption and turns it into a tangible number that's easier for the trader to understand. My formula is calculated using the past 50 periods, be warned it will not display a value for stocks with under 50 periods of trading history. This indicator is great for identify accumulation of growth stocks early on in their moves, most of the time you would like a growth stocks U/D value to be above 2, showing institutional sponsorship of a stock.
Up/Down Volume value interpretation:
U/D < 1 -> Bearish outlook, as sellers are in control
U/D = 1 -> Sellers and Buyers are equal
U/D > 1 -> Bullish outlook, as buyers are in control
U/D > 2 -> Bullish outlook, significant accumulation underway by market makers
U/D >= 3 -> MONSTER STOCK ALERT, market makers can not get enough of this stock and are ravenous to buy more
U/D values greater than 2 are rare and typically do not last very long, and U/D >= 3 are extremely rare one example I kind find of a stock's U/D peaking above 3 was Google back in 2005.
MAKE SURE TO HIT THE SETTINGS WHEEL AND CHECK THE BOX NEXT TO PLOT IN ORDER TO GET RID OF THE PLOTTED LINE.
Performante's Average Bitcoin Volume EMA Indicator This is the average Bitcoin volume with the data collected from the major retail exchanges + the exponential moving average (EMA) for the volume added on to better understand relative volume.
Thank you Julio!

Volume Changes with Bollinger Bands & Signal/AlertJapanese below / 日本語説明は下記
---------------------------------------------
Hello traders,
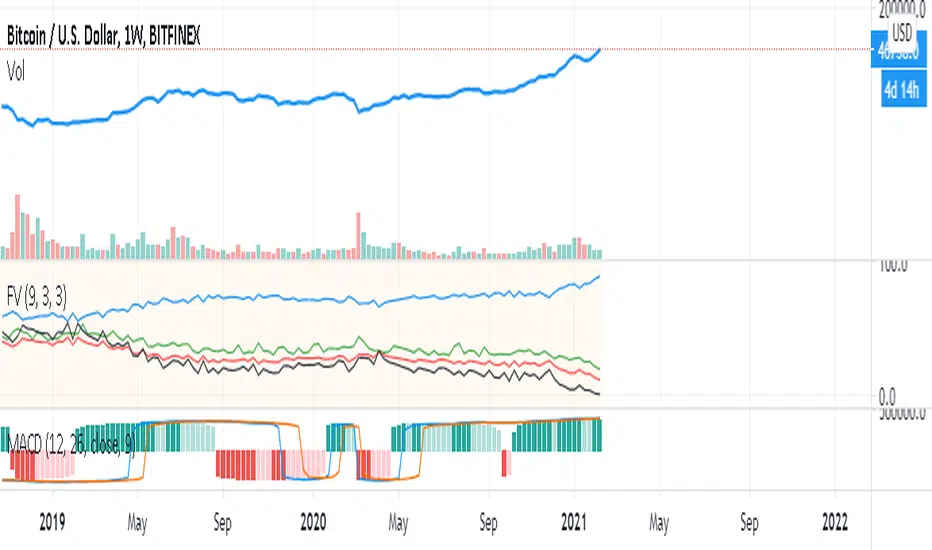
This indicator shows volume changes in percentage over the past periods as well as Bollinger Bands of volume changes with +2σ band.
The formula to calculate volume changes is;
(Today’s volume / average volume of past n periods ) *100
** n is user input
Bar color changes to green if close >= open, else if red.(You can change colors.)
Bollinger band
The reason I included Bollinger band here is if volume changes crosses over +2σ bands, that would suggest strong buying or selling pressure behind which might contribute price surging or dropping.
The following chart is BTCUSD daily chart.
Some correlation between volume changes and price movement can be observed.
For example, when volume changes surpasses BB+2σ with green bar, bullish trend occurs while in case of red bar, bearish trend happened.
Signal/Alert
Signal can be shown when volume changes cross over BB +2σ or upper band.(% changes, user input) Alert condition is same.
——————————————
出来高変化率のインジケーターです。過去n期間の出来高平均と当日出来高を比較してオシレータとして表示するとともに、出来高変化率のボリンジャーバンド+2シグマバンドを表示します。
出来高変化率の計算式は以下の通りです。
(当日出来高 / 過去n期間の平均出来高) * 100
* nはユーザ指定
終値>=始値の場合は緑色のバーで、終値<始値の場合は赤色のバーで表示します。(色は変更可能)
ボリンジャーバンド
出来高変化率が、出来高変化率のボリンジャーバンド+2シグマを超えるということはそれだけ強い買い・売りの存在を示唆していることになるのではと考え表示可能なようにしています。
以下のチャートはビットコイン/米ドルの日足チャートです。
例えば出来高変化率がBB+2シグマを超えて陽線で引けた場合、以降上昇トレンドが発生していることが確認できます。同様に出来高変化率がBB+2シグマを超えて陰線で引けた場合は下降トレンドが発生していることが確認できます。
これらは裏に強い買い、売り圧力が存在していることを示唆していると読み取ることができます。
ボリンジャーバンドが不要な場合は、出来高変化率のアッパーバンド(%, ユーザ指定)を表示して、変化率の度合いを測ることが可能です。
シグナル/アラート
出来高変化率がボリンジャーバンド+2σを超えた場合、もしくはアッパーバンドを超えた場合にシグナル表示します。
同じ条件でアラート設定も可能です。


[SK] Custom Klinger OscillatorThis Custom Klinger Oscillator allows you to change the time frames for the Force Volume and Signal calculations to use instead of it's default values. Although the default Fibonacci values ( 34, 55 and 13 ) provide exceptional signals, you can now explore using lower Fibonacci numbers and get faster signals for your own adventures in the market.
This indicator adds conditional coloring of the Klinger line when over / under the signal along with a transparent fill cloud between both lines colored by the same condition. You can change colors to your preference on the style configurations.
--
Below is more information on the KIinger Oscillator from investopedia:
Interpretations for Price Direction
The Klinger Oscillator is fairly complex to calculate, but it's based on the idea of force volume, which accounts for volume, trend (positive or negative), and temp (based on multiple inputs and if/then statements). Using this data, the oscillator is created by looking at the difference between two exponential moving averages of force volume involving different time frames (typically 34 and 55). The idea is to show how the volume flowing through the securities is impacting its long-term and short-term price direction.
The Signal Line
A signal line (13-period moving average) is used to trigger buy or sell signals. This technique is very similar to signals that are created with other indicators such as the moving average convergence divergence (MACD). While these are the basic signals generated by these indicators, it's important to note that these techniques may generate a lot of trading signals that may not be as effective in sideways markets.
The Uptrend
When an asset is in an overall uptrend—such as when it is above its 100-period moving average and the Klinger is above zero or moving above zero—traders could buy when the Klinger oscillator moves above the signal line from below.
Klinger noted that when a stock was in an uptrend, and then dropped to unusually low levels below zero, and then moved above its signal line, this was a favorable long position to take.
The Downtrend
When an asset is in an overall downtrend, traders could sell or short-sell when the Klinger oscillator moves below the signal line from above. Klinger noted this was especially noteworthy when the indicator had seen an uncharacteristic spike above zero.
The zero line is also used by some traders to mark the transition from an uptrend to downtrend, or vice versa. While such signals won't always agree with price movements, a move above zero helps confirm a rising price, while a drop below zero helps confirm a falling price.
Klinger Oscillator and Divergence
The Klinger oscillator also uses divergence to identify when the indicator's inputs are not confirming the direction of the price move. It's a bullish sign when the value of the indicator is heading upward while the price of the security continues to fall. It is a bearish signal when the price is rising but the indicator is falling. Divergence can be coupled with signal line crossovers to generate trades. For example, if a bearish divergence forms, a sell or short-sell could be initiated the next time the Klinger crosses below the signal line.

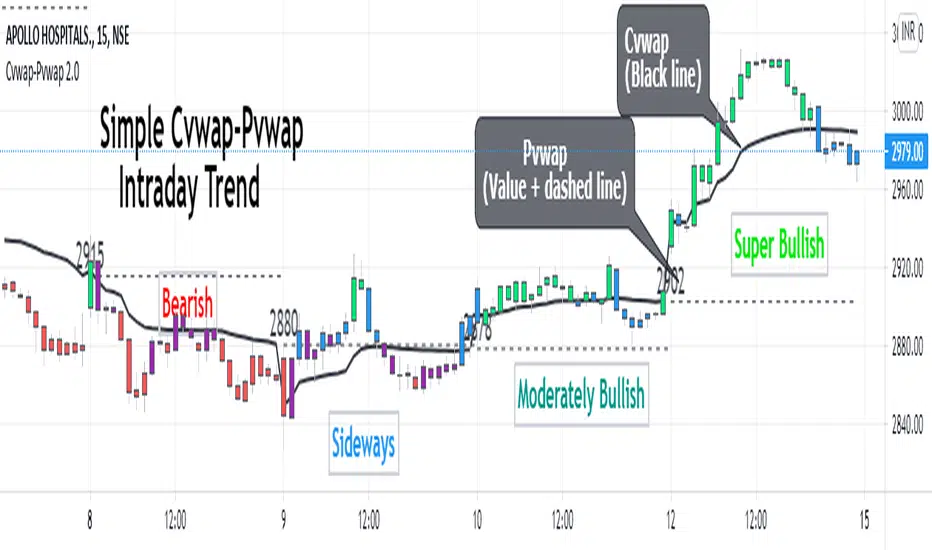
Cvwap-Pvwap 2.0A simple vwap based Intraday trend indicator.
Volume-Weighted Average Price (VWAP) - the average price weighted by volume, starts when trading opens and ends when it closes. This can help institutions buy or sell in large orders, without disturbing the market.
After buying or selling, institutions compare instrument price to closing VWAP values at end of the day.
For big financial institutions;
A buy order executed below the VWAP value, considered a good fill because the security was bought at a below average price.
A sell order executed above the VWAP would be deemed a good fill because it was sold at an above average price.
Simple price based moving average is not helpful for them; = as it doesn't incorporates volume traded. Hence - VWAP :)
So how it helps us in decoding the IntraDay-trend? - Through a 2 day vwap co-relation.
So, Closing value of previous day vwap = Pvwap
Today's running vwap = Cvwap
Defining the IntraDay Trend:
Moderately Bullish = candle closing price above Pvwap but below Cvwap
Super Bullish = Closing price is above both (Cvwap and Pvwap)
Moderately Bearish = Closing price is above Cvwap but below Pvwap
Super Bearish = Closing Price is below both (Cvwap and Pvwap)
A big gap between the Cvwap and the candle closing price defines the strong participation from institutions in that direction. (Strong Trend)
Moving with the smart money, in the overall trend is a wise decision for any intraday trader and this helps at its best.
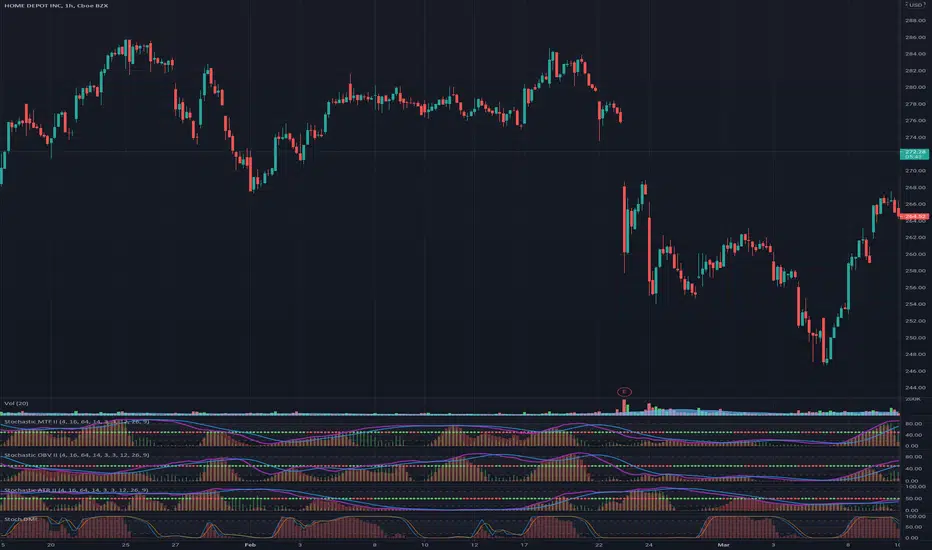
Stochastic OBV IIUses OBV to plot a stochastic graph. Incorporates the macd of obv and plots a stochastic of this macd. Additionally stochastic rsi of OBV is plotted in histograms.
The stochastic OBV is in the higher timeframe(current time frame * 4).
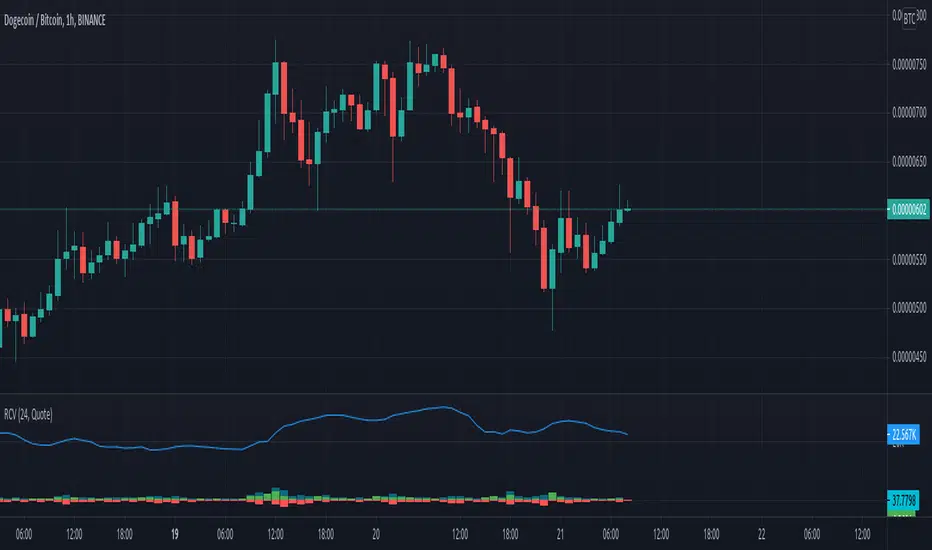
Rolling Cumulative VolumeThis indicator show a simple rolling cumulative volume. A field is specified. Then all last volume indicators are summed.
For example it could calculate last 24h Volume if you use the 1h bars and set the length for 24.
Volume Profile per day with support/resistance linesThis indicator shows the volume profile by daily blocks and draws on the chart the support or resistance lines produced by the previous volume profile block. A support line will be created if in the previous block, the VPOC line was closer to the lowest price line of that block. This support line will be placed below the VPOC line, at a distance equal to the difference between the highest price of that block and the VPOC price. For the case of the resistance line, the logic applied is analogous.
These support and resistance lines are introduced because, according to the Gaussian bell, the VPOC is likely to be located in the middle, and these deviations can be used to trace support and resistance.
In addition, the indicator includes the following features:
- Change the colors of all plotted lines.
- Define the number of daily blocks to be displayed.
- Define the resolution when calculating the volume of each candle.
- Define the number of support/resistance lines to be displayed.
- Highest and lowest price lines, as well as vpoc line, volume histogram and support and resistance lines.
- Display or not, the vpoc line and the volume histogram.
The calculations performed by the script improve if the candles used are of a lower timeframe. This indicator has been tested in several markets, including cryptos, CFDs, Forex and Indices.
Dull Volume by EpullemanDull volume indicator with Stochastic oscillator
Blue = Dull
Red = Super Dull
helps to determine low volume movement on oversold

Volume Correlation Indicator [Fournier-Eaton]This script combines two correlation indicators into one:
Volume Oscillator Correlation
Price Correlation
Rationale : This script is predicated on the following premise: we rely often on price correlation. However, we overlook volume-volume correlation too often. The volumetric correlative decoupling of an equity and index or equity - equity can yield important information (and produce it as early or earlier than price-correlation).
Mechanism :
The primary component of this chart is the Volume Correlation Indicator (as red histogram). This is the correlation between the Volume Oscillator of current chart's symbol and the VO of your chosen comparison.
Secondarily, the standard price correlation is also charted for added information in line format.
Example : In the chart attached to this publication, note the following cases:
Case 1: The price correlation with QQQ was increasing as earnings approached. However, the volume correlation with QQQ was clearly decoupled as earnings approached.
Case 2: Contrastingly, other dips in price correlation can be found were volume correlations were behaving in tandem.
Note1: This is the first in a series of volume correlation indicators. Please let me know if you find this useful.

Zeta Volume Profile ProWhat is Volume Profile?
Volume Profile is an advanced order flow analysis which displays volume distribution at various price points over time. It may be called a recent biodata of a stock which is displayed on a chart as a horizontal histogram. Volume Profile can help reveal significant price levels where smart money is sitting.
Why Volume Profile is important?
The life of a Future Contract is of maximum 3 months. All the near month contracts expire on the last Thursday of the respective month. But, the traders who want to continue holding on to their winning positions would likely take the same position in the next series. So they often close the existing position near the expiry and take position in the next series. This activity is termed as Rolling Over the position and mostly it catches strength about 5-6 days before the expiry.
If we start tracking Volume Profile 5-6 days before the monthly expiry, we get to know the levels where maximum concentration of volume is located. In layman terms, we want to see where the biggest crowd is sitting. In this crowd, there will be equal number of buyers and sellers and when either party starts feeling the heat (market goes against them), they try to limit their loss by Buying/Selling and the random walks become a unidirectional march.
Zeta Volume Profile Pro tries to detect this crowd behavior by tracking maximum volume concentration area and when price leaves this area, it generates Buy/Sell Signals.
What is unique about Zeta Volume Profile Pro?
There are other volume profile indicators also in the market but Zeta Volume Profile Pro is unique in following aspects:
1. Whenever last Thursday of any month starts, Zeta Volume Profile Pro resets automatically and starts calculating volume and price levels from 30 bars backwards (default value which the user can change). Assuming we are looking at 30 Min. Time-Frame chart and your Stock Exchange opens for 6 hours a day, the last 30 candles cover 5 days data. If in your time zone, stock exchange remains open for longer hours, you can either increase minimum number of bars to be considered or you may increase your time-frame. The idea is you should cover 5-6 days of data on last Thursday of the month.
2. Once you set the minimum number of bars and time-frame relevant to you, leave everything to Zeta Volume Profile Pro. Now with every passing tick, the volume profile created by Zeta Volume Profile Pro will keep changing and more and more price bars will keep adding to the minimum number of bars set by you till last Wednesday of the current month occurs.
3. On any given day or time, whenever price breaks out of maximum volume concentration area, the indicator generates a Buy/Sell Signal and often such breakouts give handsome returns.
What markets it is suitable for?
It can be used in any time-zone on any stock exchange. However, since the concept is based upon Volume Concentration, it works best on highly liquid stocks, commodities, currency pairs and indices.
It will not give good results if the underlying security is illiquid because volume profile generated will not be efficient one.
Since Future Contracts volume tends to be more than cash segment, it gives much better results on Futures Charts.
Which time frames are best for this indicator?
Choose such time-frame and minimum number of bars which are equivalent to 5-6 trading sessions in your time-zone. In settings, there is an option to set your time-zone.
How to Take Buy/Sell Entry with Zeta Volume Profile Pro?
Whenever you see a Buy Signal appearing on your chart, take Buy Entry and whenever you see a Sell Signal, take Sell side Entry.
Your STOP LOSS would be high or low of candle which occurs just before the Buy/Sell Signal respectively.
Keep moving your STOP LOSS up as the price moves in your favor and when market turns around and you see a SELL signal, it is time to book your BUY position profit and take Entry on SELL Side now and so on.
What are the limitations of this indicator?
Sometimes price takes a break out of maximum volume concentration area and then again comes back which might hit your stop loss. However, as the backtested data shows, having faith in the indicator will give you some so nice breakouts that a single trade will cover your 10 to 20 Stop Loss hits.
How to get this indicator?
This is invite-only indicator. Get in touch with us using information given below in Signature field to try this tool FREE for 02 live sessions. After that, it is subscription based access.

Volume Trend MeterSweet little indicator which measures volume pressure over a specific period of time.
i call it Volume Trend Meter, or just VTM,
The indicator sums up all green candles volume and red candles volumes over a specific period of bars (you set in settings) and plots their values.
Use this indicator to identify increasing volume with the green candles (close higher than open) and increasing volume of the red candles (close is lower than open).
======= Calculation ==========
For Green Column: Total volume of green candles is higher than total red candles volume.
For Red Column: Total volume of red candles is higher than total green candles volume.
======= Volume Trend Meter Colors =======
Green: Increasing buying pressure.
Red: Increasing selling pressure.
Like if you like and Follow me for upcoming indicators/strategies.

Relative Volume with Hull ma and Donchian channelA trader introduced the relative volume to me; I like the concept but its presentation doesn't fit my "visual" taste.
What I did was to color the relative volume bar based on the relationship among (1) hull moving average of the close (2) close vs. open and (3) the relative volume bar reading.
Red -> bearish price action with a lot of volume
Green -> bullish price action with a lot volume
Black -> no clear relationship between volume and price action.
I also added a Donchian channel to the relative volume to further gauge the strength of the relative volume.
All of my posts are for entertainment only.
Buy_Sell_Pressure_v0.62This is a script that I've been using for some time, which covers Volume for me.
It shows the total volumes in typical Column format, however this script attempts to suss out the details of WHERE that volume went (buying or selling), how EFFECTIVE that volume was at moving the price, and finally a COMPARISON of Buy vs. Sell volume MA's showing us the average buying and selling pressure over time, to assist us with determining the timing of a reversal.
The oscillator portion shows us the Volume Columns and the MA's with shadow or offset MA's to detect reversals and crossovers of self, and on the bar/candle chart the bars are colored according to which volume is more dominant at that time.
Alert conditions are available for the following events:
- Buying Crosses over Selling (Bar Color Change)
- Selling Crosses over Buying (Bar Color Change)
- Sell Pressure Cross Up / Down (Single MA Direction Change)
- Buy Pressure Cross Up/ Down (Single MA Direction Change)

Volume Buzz 2.0Volume Buzz/Volume Run Rate as seen on TC2000 and MarketSmith respectively.
Basically, the volume buzz tells you what percentage over average(100 time period moving average) the volume traded was. You can use this indicator to more readily identify above-average trading volume and accumulation days on charts. The percentage will show up in the top left corner, make sure to click the settings button and uncheck the second box(left of plot) in order to get rid of the chart line.
Pictured above, a chart with the volume on the bottom along with the 50-day moving average applied to volume. As you can see in the top left it will tell you the "volume buzz" of that day, telling you what days were on above-average volume and how above-average those days were.

[co.n.g] - Simple CVD over MAThis Single Volume Delta (SVD), respectively Cumulative Volume Delta (CVD) is a really simple script computing the difference of the volume of the actual in comparison the the volume of the "Calculation Bars Threshold", calculated by smoothing through a simple moving average - the "CVD MA Smoothing".
Therefore, if the "Calculation Bars Threshold" and the "CVD MA Smoothing" are set to 1, the script will display the difference of the actual compared to the previous candle;
furthermore, if the "Calculation Bars Threshold" is set to 3 and the "CVD MA Smoothing" is set to 14, then the indicator will display the the summed difference of the past 3 values, smoothed over a period of 14 candles.
This indicator may also be set to a different time frame, allowing multi time frame analysis; f.e. if you're going to set a lower time frame than the actual, the deltas of the lower time frame will be displayed and will be showing the volume trend of the lower time frame; if you're going to set a higher time frame, this is respectively working as described.
To understand volume and price action, it is - imho - especially helpful to display the volume of higher time frames to visualize the "Where the heck am I and what are the big players doing?"
This indicator is coloring the histogram in green as positive, red as negative and gray as indecisive CVD.
Hopefully, this will be helpful in your VSA and your trading decisions.
Cheers,
Constantine
p.s.: I am also working on a far more sophisticated version of SVD/CVD, so stay tuned!

ToTitans : Buy/Sell HHVWhat is it
It is a volume profile indicator base on y axis. It will show you when the buy/sell volume dominate the market
Differentiation
No one has done this before to calculate buy/sell volume indicator in this fashion
This indicator has been used in AJ Jim class for "Type 2" approach
Suitable for
Intra Day Trading (20m-2h)
TFEX:S501!
"PM me to obtain access"

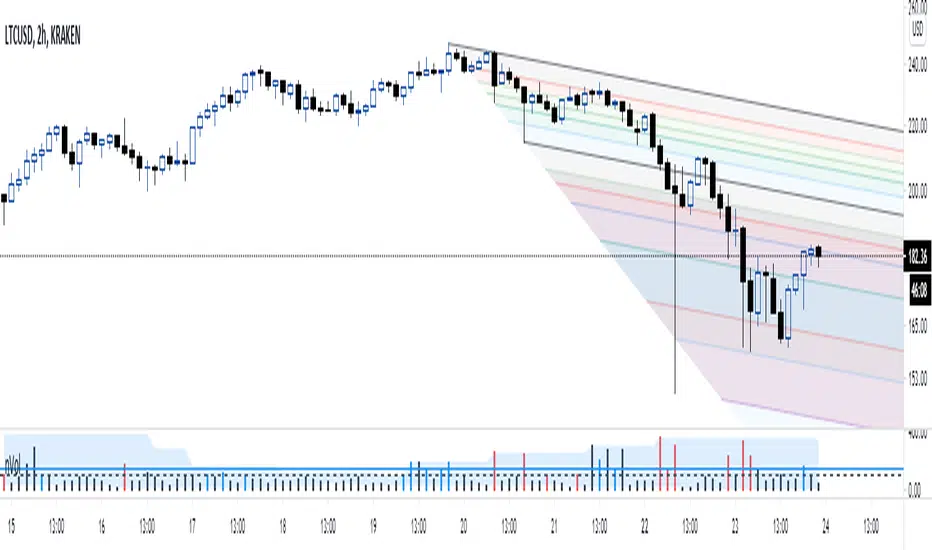
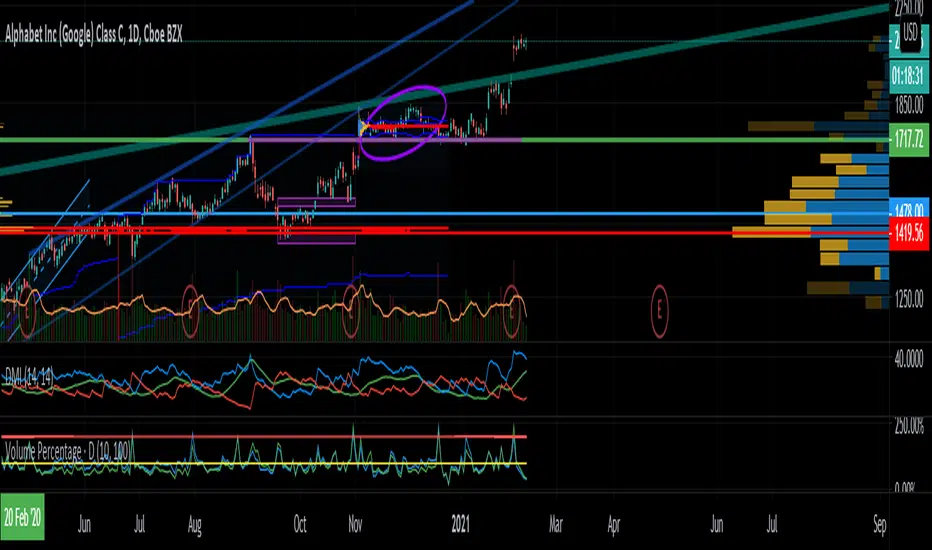
Volume PercentageVolume percentage oscillator that compares the current volume value with the average of each two periods of volume, one fast (10 days) and one slow (100 days).
There are two horizontal lines that are a good visual guide, one in 100% and the other in 200%, which are very useful.
Special thanks to rick_decard.
VFFVFluctuations to Volume desired to change the price.
to identifying which parameter of ask/bid (Technical ) or News (fundamental) parameters are changing the market I think this formula is enough !!!!
thanks for use and share your comments
X Exchange BTC Cash Flow Index (Multi-Exchange)Custom Cash flow Index (Similar to MFI) indicator based on BTC World Volume across all exchanges.
Volume Data based on "BTC WORLD VOLUME" by Phil Ledru
How it works:
Use this indicator like to see momentum changes in Price and Volume across all exchanges for Bitcoin.
When momentum is positive, indicator will turn Blue.
When momentum is slowing down and price is declining, indicator will turn Red.
Like your usual RSI, OB & OS levels are 80 & 20.
What to watch out for:
- Watch out for Bullish and bearish divergences in Volume
- Wedges, Head and shoulders and other formations.
Enjoy!
