Cryptohopper OBVCryptohopper is an automated trading platform where you can automate your strategy based on technical indicators and candlestick patterns. OBV is one the indicators that you can automate with Cryptohopper.
How can you automate it? OBV gives a Buy signal when the OBV value crosses up its moving average (default: EMA) and a Sell signal when it crosses down its moving average.
If you include volume analyses in your trading strategy, automating OBV will give buy signals whenever volume and price are rising altogether.
Start automating your trading in Cryptohopper.com
--CRYPTOHOPPER--
X-volume

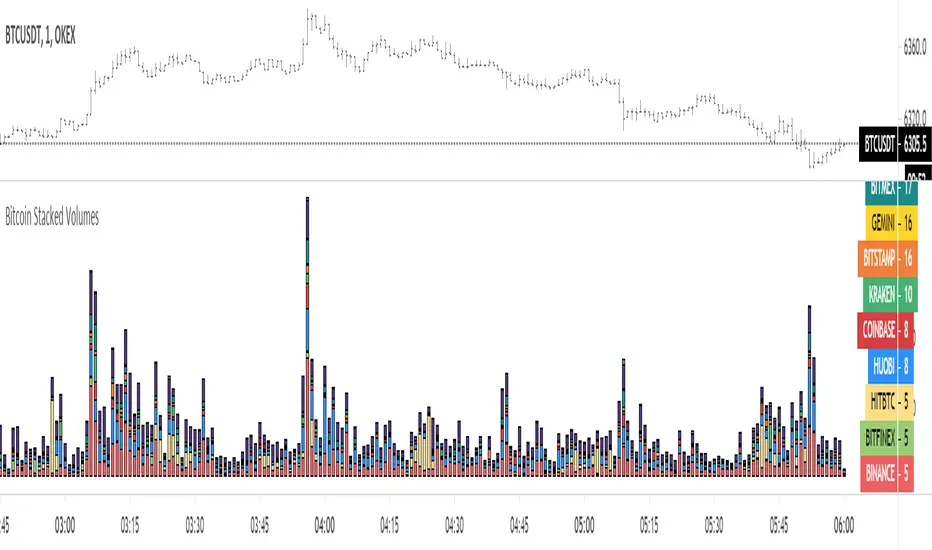
Bitcoin Fat Volume IndicatorBitcoin Fat Volume Indicator
The script displays aggregate sums of Bitcoin dollar and Tether market volumes separately as follows:
USD markets (blue): gemini, coinbase, okcoin, kraken, bitfinex, bitstamp, btce, mtgox
Tether markets (orange): huobi, binance, bittrex, poloniex, hitbtc
The indicator should work on all time frames on any chart so long as volume data exists. Obviously for full history use Bitcoin Liquid Index.
The indicator is slow that's why I'm not including other stable coins or fiat markets at present.
Use settings to turn off Tether or USD bars as desired.

Woodies CCX Vol Weighted + CZ + SW indicatorsVersion of Woodies CCX that takes in account volume (uses Vol Weighted JMA). All credits for the original code go to @4alphabsolute

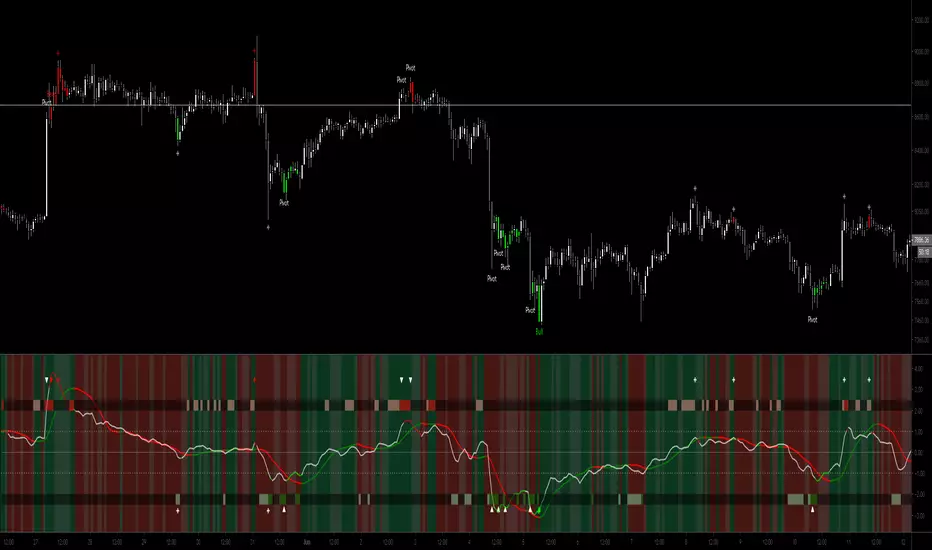
Cuban's VWAP DivergencesAfter using many different divergence scripts, I struggled to find one that didn't indiscriminately signal a constant divergence while the price was trending.
This study attempts to solve this issue, along with filtering out false signals. I have found it to print less signals and to be more accurate.
It also gives you a confluence level between high probability reversals (labels) and lower probability reversals (crosses), and some clever trade logic in the candle colouring -- to signal when to take the trade.
I have added a night mode for aesthetic label colouring and an option to minimise labels all together.
I recommend using this study in conjunction with one of my other scripts; Cuban's LTF Trend Oscillator.
Intraday Cumulative VolumeThis script allows to calculate the cumulative volume during the intraday session. Let's just define the start and the end time of the day you want the cumulated volume to be calculated within and you'll be good to go! You can also define two thresholds (min and max) where to plot it on a different color. For my strategy, I find it very useful for calculating the pre-market volume since I need to see enough (but not too much) interest on a stock for trusting it after the bell rings. I place it in the same panel where I display the actual volume, so that no extra space on my layout needs to be allocated to this one indicator. I hope you'll be finding it useful too!

Multi-TF Avg BBandsMULTI-TF AVERAGE BBANDS - with signals (BETA)
Overall, it shows where the price has support and resistance, when it's breaking through, and when its relatively low/high based on the magic of standard deviation.
created by gamazama. send me a shout if u find this useful, or if you create something cool with it.
%BB: The price's position in the boilinger band is converted to a range from 0-1. The midpoint is at 0.5
Description of parameters
"BB:Window Length" is the standard BB size of 20 candles.
The indicator plots up to 7 different %BB's on different timescales
They are calculated independently of the timescale you are viewing eg 12h, 3d, 30m will be the same output
You can enter 7 timescales, eg. if you want to plot a range of bbands of the 12h up to 3d graphs, enter values between 0.5 and 3 (days) - you can also select 0 to disable and use less timescales, or select hours or minutes
Take note if you eg. double the main multiplier to 40, it is the same as doubling all your timescales
You can turn the transparency of the 7 x %BB's to 100 to hide them, their average is plotted as a thick cyan line
"Variance" is a measure of how much the 7 BB's agree, and changes colour based on the thresholds used for the strategy
---- TO START FROM SCRATCH ----
- set all except one to ZERO (0), set to 0, and everything after to 0.
Turn ON and right click -> move the indicator to a new pane - this will show you the internal workings of the indicator.
Then there is a few standard settings
"Source Smoothing Amount" applies a basic small sma on the price.
It should be turned down when viewing candles with less information, like 1D or more.
Standard BBands use an SMA, there one uses a blend between VWMA or SMA
Volume Weight settings, the same as SMA at 0, and the same as VWMA at 1
BB^2 is a bband drawn around the average %BB. Adjust the to change its window length
The BB^2 changes color when price moves up or down
Now its time to look at the parameters which affect the buy/sell signals
turn on "show signal range" - you see some red lines
buy and sell each have 4 settings
min/max variance will affect the brigtness of the signal range
range adjust will move the range up/down
mix BB^2 blends between a straight line (0) and BB^2's top or bottom (1)
a threshold of "variance" and "h/l points" is available to generate weaker signals.
these thresholds can be increased to show more weak signals
ONCE YOU ARE HAPPY WITH THE SIGNALS being generated, you can turn OFF , and move it back to the price pane
the indicator then draws a bband around the price to maps some info into the chart:
fills a colour between 0.5 & the mid BB^2 and converts relative to the price chart
draws a line in the middle of the midband.
controls how much these lines diverge from the price - adjust it to reduce noise
converts the signal range (red lines) to be relative to the price chart
if you like, you can adjust the sell & buy signals in the tab from and to and to match the picture. It messes with auto-scaling when moving back to though
enjoy, I hope that is easy enough to understand, still trying to make this more user-friendly.
If you want to send me some token of appreciation - btc: 33c2oiCW8Fnsy41Y8z2jAPzY8trnqr5cFu
I promise it will put a fat smile on my face


Chaikin Money Flow Filtered [aamonkey]What I don't like about the CMF indicator is that it can be very choppy.
That's why I created the Filtered Chaikin Money Flow.
I don't know if someone else already had the same idea but I think it improves the indicator.

BTC SKVPrivate indicator,
I don't sell/rent indicators, i do it for myself and to share with the people I work with.
This indicator is a clone of @everget so i can't make it open source.
If you would like to get it, you can buy it =>
Trust me it can take many hours/days to make a indicator, this one in particulary will need some update in the futur, paid indicators with support can save you time & money.
Thanks to @everget for his idea, and aslo for all the free code that he share.

HawkEye Volume [aamonkey]This is an extended version of the HawkEye indicator by LazyBear.
I just added a sma to use as a filter.

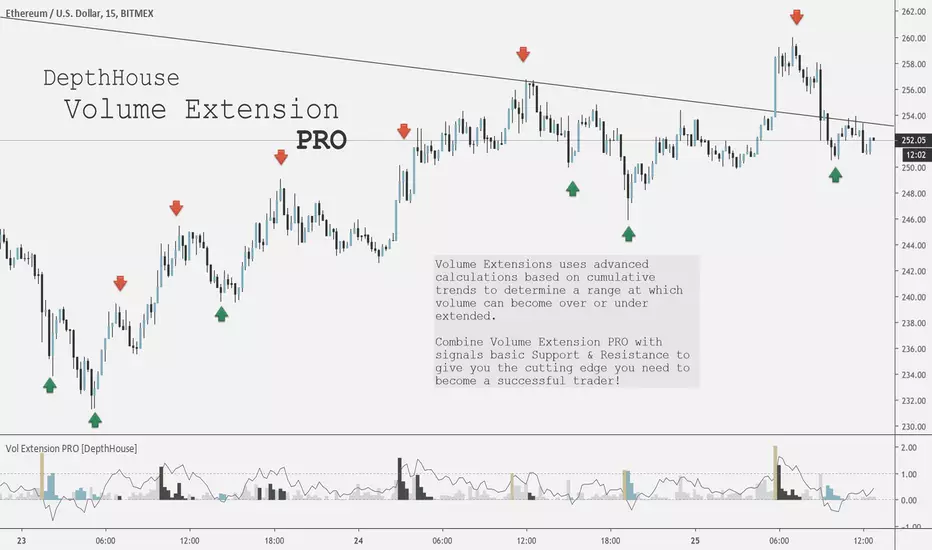
Volume Extension PRO [DepthHouse]Would you like to have an edge over other traders? By being ahead of the competition you can take faster and better decisions. We can provide you with indicators that give you full overview over the most important values that affect the movements of your assets. Get a subscription today! It's never too late to become a pro trader!
Volume Extensions PRO uses advanced calculations based on cumulative trends to determine a range at which volume can become over or under extended.
Thus signalling potential points of support or resistance.
Combine Volume Extension PRO with signals basic Support & Resistance to give you the cutting edge you need to become a successful trader!
TUTORIAL
Volume Extension:
The volume bars represent the current candle volume extension based on historical data. The higher the extension, the more volume present compared to the user set lookback period.
Volume bars that extend past 1 represent a massive surge in volume.
Extension Oscillator:
The extension oscillator is the most advance feature with this indicator. It uses cumulative volume averages to create a range in which volume travels in. The extension oscillator reads very similar to an RSI.
Over 1 = overbought / over extended volume
Under 0 = oversold / under extended volume
The extension oscillator may also be used a tool to pin point levels of volume divergence
Signal Colors:
The colored bars represent either a surge in volume (gold), or over or under extension.
These colored bars may be used to pinpoint key volume levels to help determine short or long term trend reversal points.
Combine these signals with basic support and resistance to give you professional edge!
The chart above has manual placed arrows to represent when and where the Volume Extension PRO indicator gave these signals.
Settings:
Length: Lookback period of the oscillator
Weight: Adds additional weight to the cumulative volume averages for lower volume exchanges.
Warning : This is a based volume indicator. Therefore its results are entire based on the the volume of that exchange! Some exchanges or currency pairs may not provide enough volume to give accurate results. Do not solely rely on this indicator to make your trades. Please use responsibly.
Request a FREE Trail via my website!
RVOL - R4RocketRelative volume or RVOL for short is an indicator that is used to measure how 'In Play' the stock is. Simply put, it helps to quantify how interested everybody is in the given stock - higher the value, higher the interest and hence higher is the probability for movement in the stock.
I have tried to create RVOL (Relative Volume ) Indicator as per the description that I read on SMB Capital blog. The blog is a great resource.
...................................................................................................................................................................................
How to use the indicator - The indicator is meant for INTRADAY ONLY.
The indicator has following inputs -
1. RVOL Period - Value from 3 to 14 (Default Value = 4)
This is used to calculate the average volume over the given period of days. e.g. average volume for the last 5 days, last 3 days, last 10 days etc. NOTE - If you use higher RVOL Period on smaller timeframes, the code will give an error. So I recommend using 4 or lower for 5 min timeframe. (Nothing will work on 1 min chart and you can experiment for other timeframes.)
2. RVOL Sectional - True / False (Default Value = False)
If you check this box then you will be able to calculate the RVOL for a particular session (or between particular sessions) in that trading day.
What do I mean by session?
Well I have divided the trading day into 6 (almost) equally spaced sessions in time, i.e. 6 hours and 15 mins (for NSE - India) of trading day is divided into 1 hr - 1st session, 1 hr - 2nd session, 1 hr - 3rd session, 1 hr - 4th session, 1 hr - 5th session, 1 hr and 15 min - 6th session.
Before using 3rd and 4th inputs of indicator, RVOL Sectional box MUST BE CHECKED FIRST.
3. RVOL From Session - 1 to 6 (Default Value = 1)
4. RVOL To Session - 1 to 6 (Default Value = 2)
Now if you select 2 in "RVOL From Session" input and 3 in "RVOL To Session" input, the indicator will calculate RVOL for the 2nd and 3rd hour of the trading day. If you select 3 in both the inputs, then the indicator will give RVOL for the 3rd hour of the trading day.
5. RVOL Trigger - 0.2 to 10 (Default Value = 2)
Filter to find days having RVOL above that value. The indicator turns green (or colour of your choice) when RVOL is more than "RVOL Trigger".
...................................................................................................................................................................................
Hope this indicator will add some value in your trading endeavor.
“Only The Game, Can Teach You The Game” – Jesse Livermore
Yours sincerely,
R4Rocket
**If you have some awesome idea for improvement of the indicator - request you to update the code and share the same.

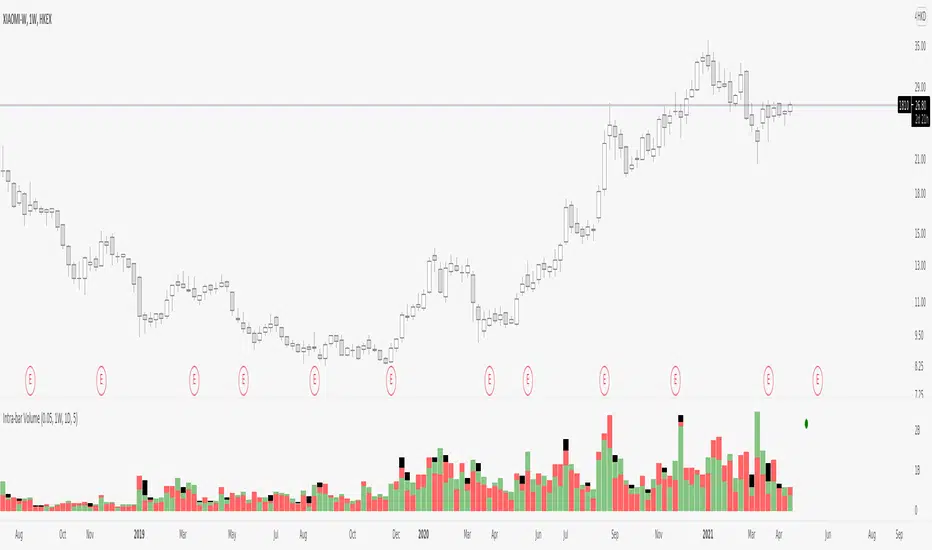
Intra-bar VolumeDisclamer : READ THIS BEFORE USING IT !!!
I have take and try to improuve the source code of indicator "intra-bar volume" by backtest-rookies.com
This indicator categorized the volume in lower timeframe, if the candle close up it's a buying volume, if it close down...
Beware that is not easy to work with different TF on tradingview so you have some limitation on the TF with this indicator. Also in TV we can't have a mutable variable in a security fonction.. so my approche is not clean but it works, if someone find better way, please comment or contact me :)
So by default the indicator can work on the following TF : 5m 15m 30m 60m 120m 240m 480m 720m 1D 1W 12M.
But ... this indicator need a lower timeframe and the number of bar to work correctly, in my code i suppose that the market run 24/7, so you need to adapte it or use intraday TF for other market.
To make sure that the indicator work correctly i have juste add circle, if it's green the buying+selling+balance volume is equal to the volume on the last close candle. If it's red theire is a problem.
I hope you enjoy it, feel free to modify the code and comment if you have any sugestion, i have just make it so maybe i will ajust some part of the code.
Volume Profile Free MAX SLI (50 Levels Value Area VWAP) by RRBVolume Profile Free MAX SLI by RagingRocketBull 2019
Version 1.0
All available Volume Profile Free MAX SLI versions are listed below (They are very similar and I don't want to publish them as separate indicators):
ver 1.0: style columns implementation
ver 2.0: style histogram implementation
ver 3.0: style line implementation
This indicator calculates Volume Profile for a given range and shows it as a histogram consisting of 50 horizontal bars.
It can also show Point of Control (POC), Developing POC, Value Area/VWAP StdDev High/Low as dynamically moving levels.
Free accounts can't access Standard TradingView Volume Profile, hence this indicator.
There are several versions: Free Pro, Free MAX SLI, Free History. This is the Free MAX SLI version. The Differences are listed below:
- Free Pro: 25 levels, +Developing POC, Value Area/VWAP High/Low Levels, Above/Below Area Dimming
- Free MAX SLI: 50 levels, packed to the limit, 2x SLI modes for Buy/Sell or even higher res 150 levels
- Free History: auto highest/lowest, historic poc/va levels for each session
Features:
- High-Res Volume Profile with up to 50 levels (3 implementations)
- 20-30x faster than the old Pro versions especially on lower tfs with long history
- 2x SLI modes for even higher res: 150 levels with 3x vertical SLI, 50 buy/sell levels with 2x horiz SLI
- Calculate Volume Profile on full history
- POC, Developing POC Levels
- Buy/Sell/Total volume modes
- Side Cover
- Value Area, VAH/VAL dynamic levels
- VWAP High/Low dynamic levels with Source, Length, StdDev as params
- Show/Hide all levels
- Dim Non Value Area Zones
- Custom Range with Highlighting
- 3 Anchor points for Volume Profile
- Flip Levels Horizontally
- Adjustable width, offset and spacing of levels
- Custom Color for POC/VA/VWAP levels and Transparency for buy/sell levels
Usage:
- specify max_level/min_level/spacing (required)
- select range (start_bar, range length), confirm with range highlighting
- select volume type: Buy/Sell/Total
- select mode Value Area/VWAP to show corresponding levels
- flip/select anchor point to position the buy/sell levels
- use Horiz SLI mode for 50 Buy/Sell or Vertical SLI for 150 levels if needed
- use POC/Developing POC/VA/VWAP High/Low as S/R levels. Usually daily values from 1-3 days back are used as levels for the current day.
SLI:
- use SLI modes to extend the functionality of the indicator:
- Horiz Buy/Sell 2x SLI lets you view 50 Buy/Sell Levels at the same time
- Vertical Max_Vol 3x SLI lets you increase the resolution to 150 levels
- you need at least 2 instances of the indicator attached to the same chart for SLI to work
1) Enable Horiz SLI:
- attach 2 indicator instances to the chart
- make sure all instances have the same min_level/max_level/range/spacing settings
- select volume type for each instance: you can have a buy/sell or buy/total or sell/total SLI. Make sure your buy volume instance is the last attached to be displayed on top of sell/total instances without overlapping.
- set buy_sell_sli_mode to true for indicator instances with volume_type = buy/sell, for type total this is optional.
- this basically tells the script to calculate % lengths based on total volume instead of individual buy/sell volumes and use ext offset for sell levels
- Sell Offset is calculated relative to Buy Offset to stack/extend sell after buy. Buy Offset = Zero - Buy Length. Sell Offset = Buy Offset - Sell Length = Zero - Buy Length - Sell Length
- there are no master/slave instances in this mode, all indicators are equal, poc/va levels are not affected and can work independently, i.e. one instance can show va levels, another - vwap.
2) Enable Vertical SLI:
- attach the first instance and evaluate the full range to roughly determine where is the highest max_vol/poc level i.e. 0..20000, poc is in the bottom half (third, middle etc) or
- add more instances and split the full vertical range between them, i.e. set min_level/max_level of each corresponding instance to 0..10000, 10000..20000 etc
- make sure all instances have the same range/spacing settings
- an instance with a subrange containing the poc level of the full range is now your master instance (bottom half). All other instances are slaves, their levels will be calculated based on the max_vol/poc of the master instance instead of local values
- set show_max_vol_sli to true for the master instance. for slave instances this is optional and can be used to check if master/slave max_vol values match and slave can read the master's value. This simply plots the max_vol value
- you can also attach all instances and set show_max_vol_sli to true in all of them - the instance with the largest max_vol should become the master
Auto/Manual Ext Max_Vol Modes:
- for auto vertical max_vol SLI mode set max_vol_sli_src in all slave instances to the max_vol of the master indicator: "VolumeProfileFree_MAX_RRB: Max Volume for Vertical SLI Mode". It can be tricky with 2+ instances
- in case auto SLI mode doesn't work - assign max_vol_sli_ext in all slave instances the max_vol value of the master indicator manually and repeat on each change
- manual override max_vol_sli_ext has higher priority than auto max_vol_sli_src when both values are assigned, when they are 0 and close respectively - SLI is disabled
- master/slave max_vol values must match on each bar at all times to maintain proper level scale, otherwise slave's levels will look larger than they should relative to the master's levels.
- Max_vol (red) is the last param in the long list of indicator outputs
- the only true max_vol/poc in this SLI mode is the master's max_vol/poc. All poc/va levels in slaves will be irrelevant and are disabled automatically. Slaves can only show VWAP levels.
- VA Levels of the master instance in this SLI mode are calculated based on the subrange, not the whole range. Cross check with the full range.
WARNING!
- auto mode max_vol_sli_src is experimental and may not work as expected
- you can only assign auto mode max_vol_sli_src = max_vol once due to some bug with unhandled exception/buffer overflow in Tradingview. Seems that you can clear the value only by removing the indicator instance
- sometimes you may see a "study in error state" error when attempting to set it back to close. Remove indicator/Reload chart and start from scratch
- volume profile may not finish to redraw and freeze in an ugly shape after an UI parameter change when max_vol_sli_src is assigned a max_vol value. Assign it to close - VP should redraw properly, but it may not clear the assigned max_vol value
- you can't seem to be able to assign a proper auto max_vol value to the 3rd slave instance
- 2x Vertical SLI works and tested in both auto/manual, 3x SLI - only manual seems to work
Notes:
- This code is 20x-30x faster (main for cycle is removed) especially on lower tfs with long history - only 2-3 sec load/redraw time vs 30-60 sec of the old Pro versions
- Instead of repeatedly calculating the total sum of volumes for the whole range on each bar, vol sums are now increased on each bar and passed to the next in the range making it a per range vs per bar calculation that reduces time dramatically
- hist_base for levels still results is ugly redraw
- if you don't see a volume profile check range settings: min_level/max_level and spacing, set spacing to 0 (or adjust accordingly based on the symbol's precision, i.e. 0.00001)
- you can view either of Buy/Sell/Total volumes, but you can't display Buy/Sell levels at the same time using a single instance (this would 2x reduce the number of levels). Use 2 indicator instances in horiz buy/sell sli mode for that.
- Volume Profile/Value Area are calculated for a given range and updated on each bar. Each level has a fixed length. Offsets control visible level parts. Side Cover hides the invisible parts.
- Custom Color for POC/VA/VWAP levels - UI Style color/transparency can only change shape's color and doesn't affect textcolor, hence this additional option
- Custom Width - UI Style supports only width <= 4, hence this additional option
- POC is visible in both modes. In VWAP mode Developing POC becomes VWAP, VA High and Low => VWAP High and Low correspondingly to minimize the number of plot outputs
- You can't change buy/sell level colors from input (only plot transparency) - this requires 2x plot outputs => 2x reduces the number of levels to fit the max 64 limit. That's why 2 additional plots are used to dim the non Value Area zones
- All buy/sell volume lengths are calculated as % of a fixed base width = 100 bars (100%). You can't set show_last from input to change it
- There's no such thing as buy/sell volume, there's just volume, but for the purposes of the Volume Profile method, assume: bull candle = buy volume, bear candle = sell volume
P.S. Gravitonium Levels Are Increasing. Unobtainium is nowhere to be found!
Links on Volume Profile and Value Area calculation and usage:
www.tradingview.com
stockcharts.com
onlinelibrary.wiley.com

Trade Context Relative Volume With BarsThis indicator will show you the relative volume today vs. the last X number of days.
This way, you don't have to wait until the end of the day to see how the volume compares to previous days.
Volume=Volatility so this helps give us a gauge for projections for the day.
This will only work with minute bars.
Enjoy
