ATR ZLEMA [QuantAlgo]🟢 Overview
The ATR ZLEMA indicator identifies trend direction and reversal points using a Zero Lag Exponential Moving Average (ZLEMA) combined with volatility-adjusted dynamic trailing stops. It eliminates the inherent lag of traditional moving averages while incorporating Average True Range (ATR) volatility measurement to create adaptive support and resistance levels that automatically adjust to market conditions, with optional noise filtering to reduce whipsaws in choppy markets, helping traders and investors identify trend changes, maintain positions during trending markets, and exit when momentum shifts across multiple timeframes and asset classes.
🟢 How It Works
The indicator's core methodology lies in its zero-lag trend detection system combined with volatility-adaptive trailing stops, where the ZLEMA eliminates moving average lag while ATR-based bands provide dynamic support and resistance levels:
lag = math.floor((zlemaLength - 1) / 2)
rawZlema = ta.ema(source + (source - source ), zlemaLength)
The Zero Lag EMA calculation uses lag reduction through data compensation, adding the difference between current price and lagged price to eliminate the delay inherent in traditional exponential moving averages, providing faster response to trend changes while maintaining smoothness.
The script incorporates an optional ATR-based noise filter that prevents the ZLEMA from updating during insignificant price movements, helping to reduce false signals in choppy, range-bound markets:
if enableNoiseFilter
noiseThreshold = atr * noiseFilter
priceChange = math.abs(rawZlema - zlema)
if priceChange > noiseThreshold
zlema := rawZlema
First, the indicator calculates the Average True Range to measure current market volatility, then applies a user-defined multiplier to determine the distance of the trailing stop from the ZLEMA:
atr = ta.rma(ta.tr(true), atrLength)
atrBand = atr * atrMultiplier
Next, dynamic trend detection occurs through a state-based system where the indicator tracks whether the ZLEMA is above or below the ATR trailing line, automatically adjusting the trailing stop position:
if trend == 1
if zlema < zlemaATR
trend := -1
zlemaATR := zlema + atrBand
else
zlemaATR := math.max(zlemaATR, zlema - atrBand)
The ATR trailing line acts as a volatility-adjusted stop that follows the ZLEMA during trends but never moves against the trend direction. It ratchets upward with the ZLEMA in uptrends and ratchets downward in downtrends, creating a protective barrier that adapts to market volatility.
Finally, trend reversal signals are generated when the ZLEMA crosses the ATR trailing line, indicating a shift in market momentum:
bullSignal = trend == 1 and trend == -1
bearSignal = trend == -1 and trend == 1
This creates a volatility-adaptive trend-following system that combines ZLEMA with dynamic support/resistance levels and optional noise filtering, providing traders with responsive directional signals and automatic stop-loss levels that adjust to both price momentum and market volatility conditions.
🟢 Signal Interpretation
▶ Bullish Trend (Green): ZLEMA trading above ATR trailing line with indicator showing bullish color, indicating established upward momentum with zero-lag confirmation = Long/Buy opportunities
▶ Bearish Trend (Red): ZLEMA trading below ATR trailing line with indicator showing bearish color, indicating established downward momentum with zero-lag confirmation = Short/Sell opportunities
▶ ATR Trailing Line as Dynamic Support: In uptrends, the trailing line acts as volatility-adjusted support level that rises with ZLEMA, never declining = Use as potential stop-loss reference for long positions = ZLEMA holding above indicates trend strength and momentum continuation
▶ ATR Trailing Line as Dynamic Resistance: In downtrends, the trailing line acts as volatility-adjusted resistance level that falls with ZLEMA, never rising = Use as potential stop-loss reference for short positions = ZLEMA holding below indicates trend weakness and momentum continuation
🟢 Features
▶ Preconfigured Presets: Three optimized parameter sets for different trading styles and market conditions. "Default" provides balanced configuration suitable for swing trading on daily and 4-hour charts with standard ZLEMA and ATR periods, moderate multiplier, and moderate noise filtering that works across most market conditions. "Fast Response" delivers aggressive configuration designed for intraday trading and scalping on 5-minute to 1-hour charts with shorter ZLEMA period for quick trend detection, reduced ATR period for rapid volatility adaptation, tighter multiplier for early entries/exits, and minimal noise filtering for maximum responsiveness. This is ideal for active traders monitoring positions closely but expect more frequent signals and potential whipsaws in choppy conditions. "Smooth Trend" focuses on conservative configuration for position trading and long-term trend following on daily to weekly charts with extended ZLEMA period for smoother trend identification, longer ATR period for stable volatility measurement, wide multiplier to filter minor corrections, and aggressive noise filtering to ensure only strong sustained trends trigger signals. This is best for patient traders focused on major trend moves with fewer reversals.
▶ Built-in Alerts: Three alert conditions enable comprehensive automated monitoring of trend changes and zero-lag momentum shifts. "Bullish Trend" triggers when the ZLEMA crosses above the ATR trailing line and trend state changes from bearish to bullish, signaling potential long entry opportunities with lag-eliminated confirmation. "Bearish Trend" activates when the ZLEMA crosses below the ATR trailing line and trend state changes from bullish to bearish, signaling potential short entry or long exit points with immediate momentum detection. "Any Trend Change" provides a combined alert for any trend reversal regardless of direction, allowing traders to be notified of all zero-lag momentum shifts without setting up separate alerts. These notifications enable traders to capitalize on trend changes and protect positions without continuous chart monitoring, leveraging the indicator's zero-lag technology for faster trend change alerts.
▶ Color Customization: Six visual themes (Classic, Aqua, Cosmic, Ember, Neon, plus Custom) accommodate different chart backgrounds and visual preferences, ensuring optimal contrast for identifying bullish versus bearish trends across various trading environments. The adjustable cloud fill transparency control (0-100%) allows fine-tuning of the gradient area prominence between the ATR trailing line and ZLEMA, with higher transparency values (70-95) creating subtle background context without overwhelming the chart while lower values (20-40) produce bold, prominent trend zone emphasis for instant recognition. Optional bar coloring with adjustable transparency (0-100%) extends the trend color directly to the price bars themselves based on ZLEMA trend state, providing immediate visual reinforcement of current trend direction without requiring reference to the indicator lines.
Zerolagema

MovingAveragesLibraryLibrary "MovingAveragesLibrary"
This is a library allowing one to select between many different Moving Average formulas to smooth out any float variable.
You can use this library to apply a Moving Average function to any series of data as long as your source is a float.
The default application would be for applying Moving Averages onto your chart. However, the scope of this library is beyond that. Any indicator or strategy you are building can benefit from this library.
You can apply different types of smoothing and moving average functions to your indicators, momentum oscillators, average true range calculations, support and resistance zones, envelope bands, channels, and anything you can think of to attempt to smooth out noise while finding a delicate balance against lag.
If you are developing an indicator, you can use the 'ave_func' to allow your users to select any Moving Average for any function or variable by creating an input string with the following structure:
var_name = input.string(, , )
Where the types of Moving Average you would like to be provided would be included in options.
Example:
i_ma_type = input.string(title = "Moving Average Type", defval = "Hull Moving Average", options = )
Where you would add after options the strings I have included for you at the top of the PineScript for your convenience.
Then for the output you desire, simply call 'ave_func' like so:
ma = ave_func(source, length, i_ma_type)
Now the plotted Moving Average will be the same as what you or your users select from the Input.
ema(src, len) Exponential Moving Average.
Parameters:
src : Series to use ('close' is used if no argument is supplied).
len : Lookback length to use.
Returns: Float value.
sma(src, len) Simple Moving Average.
Parameters:
src : Series to use ('close' is used if no argument is supplied).
len : Lookback length to use.
Returns: Float value.
rma(src, len) Relative Moving Average.
Parameters:
src : Series to use ('close' is used if no argument is supplied).
len : Lookback length to use.
Returns: Float value.
wma(src, len) Weighted Moving Average.
Parameters:
src : Series to use ('close' is used if no argument is supplied).
len : Lookback length to use.
Returns: Float value.
dv2(len) Donchian V2 function.
Parameters:
len : Lookback length to use.
Returns: Open + Close / 2 for the selected length.
ModFilt(src, len) Modular Filter smoothing function.
Parameters:
src : Series to use ('close' is used if no argument is supplied).
len : Lookback length to use.
Returns: Float value.
EDSMA(src, len) Ehlers Dynamic Smoothed Moving Average.
Parameters:
src : Series to use ('close' is used if no argument is supplied).
len : Lookback length to use.
Returns: EDSMA smoothing.
dema(x, t) Double Exponential Moving Average.
Parameters:
x : Series to use ('close' is used if no argument is supplied).
t : Lookback length to use.
Returns: DEMA smoothing.
tema(src, len) Triple Exponential Moving Average.
Parameters:
src : Series to use ('close' is used if no argument is supplied).
len : Lookback length to use.
Returns: TEMA smoothing.
smma(x, t) Smoothed Moving Average.
Parameters:
x : Series to use ('close' is used if no argument is supplied).
t : Lookback length to use.
Returns: SMMA smoothing.
vwma(x, t) Volume Weighted Moving Average.
Parameters:
x : Series to use ('close' is used if no argument is supplied).
t : Lookback length to use.
Returns: VWMA smoothing.
hullma(x, t) Hull Moving Average.
Parameters:
x : Series to use ('close' is used if no argument is supplied).
t : Lookback length to use.
Returns: Hull smoothing.
covwma(x, t) Coefficient of Variation Weighted Moving Average.
Parameters:
x : Series to use ('close' is used if no argument is supplied).
t : Lookback length to use.
Returns: COVWMA smoothing.
frama(x, t) Fractal Reactive Moving Average.
Parameters:
x : Series to use ('close' is used if no argument is supplied).
t : Lookback length to use.
Returns: FRAMA smoothing.
kama(x, t) Kaufman's Adaptive Moving Average.
Parameters:
x : Series to use ('close' is used if no argument is supplied).
t : Lookback length to use.
Returns: KAMA smoothing.
donchian(len) Donchian Calculation.
Parameters:
len : Lookback length to use.
Returns: Average of the highest price and the lowest price for the specified look-back period.
tma(src, len) Triangular Moving Average.
Parameters:
src : Series to use ('close' is used if no argument is supplied).
len : Lookback length to use.
Returns: TMA smoothing.
VAMA(src, len) Volatility Adjusted Moving Average.
Parameters:
src : Series to use ('close' is used if no argument is supplied).
len : Lookback length to use.
Returns: VAMA smoothing.
Jurik(src, len) Jurik Moving Average.
Parameters:
src : Series to use ('close' is used if no argument is supplied).
len : Lookback length to use.
Returns: JMA smoothing.
MCG(src, len) McGinley smoothing.
Parameters:
src : Series to use ('close' is used if no argument is supplied).
len : Lookback length to use.
Returns: McGinley smoothing.
zlema(series, length) Zero Lag Exponential Moving Average.
Parameters:
series : Series to use ('close' is used if no argument is supplied).
length : Lookback length to use.
Returns: ZLEMA smoothing.
xema(src, len) Optimized Exponential Moving Average.
Parameters:
src : Series to use ('close' is used if no argument is supplied).
len : Lookback length to use.
Returns: XEMA smoothing.
EhlersSuperSmoother(src, lower) Ehlers Super Smoother.
Parameters:
src : Series to use ('close' is used if no argument is supplied).
lower : Smoothing value to use.
Returns: Ehlers Super smoothing.
EhlersEmaSmoother(sig, smoothK, smoothP) Ehlers EMA Smoother.
Parameters:
sig : Series to use ('close' is used if no argument is supplied).
smoothK : Lookback length to use.
smoothP : Smothing value to use.
Returns: Ehlers EMA smoothing.
ave_func(in_src, in_len, in_type) Returns the source after running it through a Moving Average function.
Parameters:
in_src : Series to use ('close' is used if no argument is supplied).
in_len : Lookback period to be used for the Moving Average function.
in_type : Type of Moving Average function to use. Must have a string input to select the options from that MUST match the type-casing in the function below.
Returns: The source as a float after running it through the Moving Average function.

[blackcat] L2 Zero-lag EMA Swing TradeLevel: 2
Background
This script is a comprehensive work of mine, incorporating Ehlers zero-lag EMA and my first script published: MA fingerprint for long entries.
Function
Ehlers zero-lag EMA algorithm in this scripts is mainly used for short signal production, while my MA fingerprint algorithm is used for long entries.
Key Signal
a ---> Ehlers Zero-lag EMA fast line for subjective long jugement
b ---> Ehlers Zero-lag EMA slow line for subjective short jugement
long --> Swing long entry with partial postion
short --> Swing short entry with partial postion
Remarks
Feedbacks are appreciated. This script is optimized for 1D time frame.
Readme
In real life, I am a prolific inventor. I have successfully applied for more than 60 international and regional patents in the past 12 years. But in the past two years or so, I have tried to transfer my creativity to the development of trading strategies. Tradingview is the ideal platform for me. I am selecting and contributing some of the hundreds of scripts to publish in Tradingview community. Welcome everyone to interact with me to discuss these interesting pine scripts.
The scripts posted are categorized into 5 levels according to my efforts or manhours put into these works.
Level 1 : interesting script snippets or distinctive improvement from classic indicators or strategy. Level 1 scripts can usually appear in more complex indicators as a function module or element.
Level 2 : composite indicator/strategy. By selecting or combining several independent or dependent functions or sub indicators in proper way, the composite script exhibits a resonance phenomenon which can filter out noise or fake trading signal to enhance trading confidence level.
Level 3 : comprehensive indicator/strategy. They are simple trading systems based on my strategies. They are commonly containing several or all of entry signal, close signal, stop loss, take profit, re-entry, risk management, and position sizing techniques. Even some interesting fundamental and mass psychological aspects are incorporated.
Level 4 : script snippets or functions that do not disclose source code. Interesting element that can reveal market laws and work as raw material for indicators and strategies. If you find Level 1~2 scripts are helpful, Level 4 is a private version that took me far more efforts to develop.
Level 5 : indicator/strategy that do not disclose source code. private version of Level 3 script with my accumulated script processing skills or a large number of custom functions. I had a private function library built in past two years. Level 5 scripts use many of them to achieve private trading strategy.
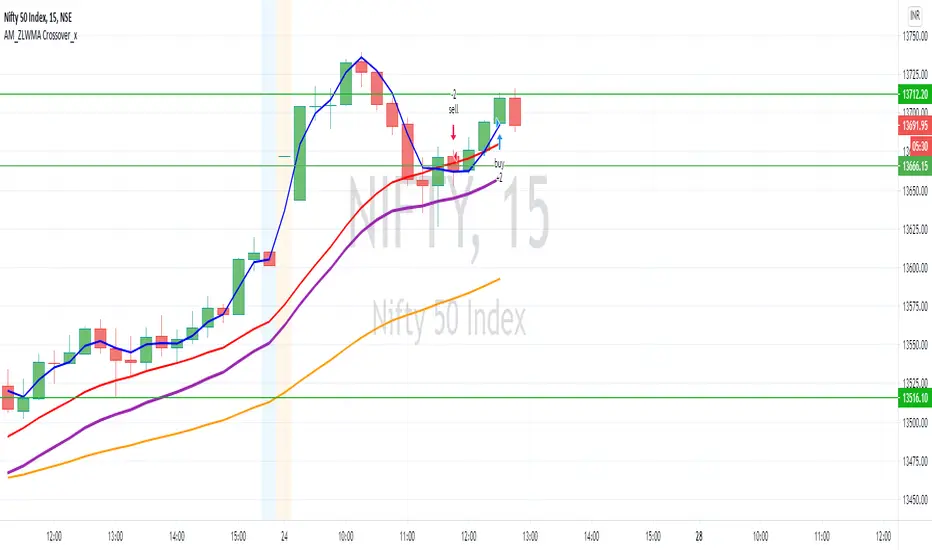
AM_ZLWMA Crossover_xDear All,
Please find updated version of Zero lag WMA crossover. In addition to this added 20/50 EMA to get better results.
Settings:
ZLWMA = 8 identified by Blue line
Fast WMA = 21 identified by Red line
EMA Period 20/50
How to Trade:
Buy: Wait for positive crossover (Blue cross above Red) to happen trade can be taken there but to get better results post crossover once price move above EMA 20 then buy can be initiated.
Sell: Wait for negative crossover (Blue cross below Red) to happen trade can be taken there but to get better results post crossover once price move below EMA 20 then sell can be initiated.
Reason to wait for confirmation of price action above / Below moving average is most of the time it happens that even after crossover happens sometimes it was just a pull back and from there it could be a possibility for reversal. Once price action confirms moving above / below EMA20 then trade will be initiated.
Please comment and ask for any doubt
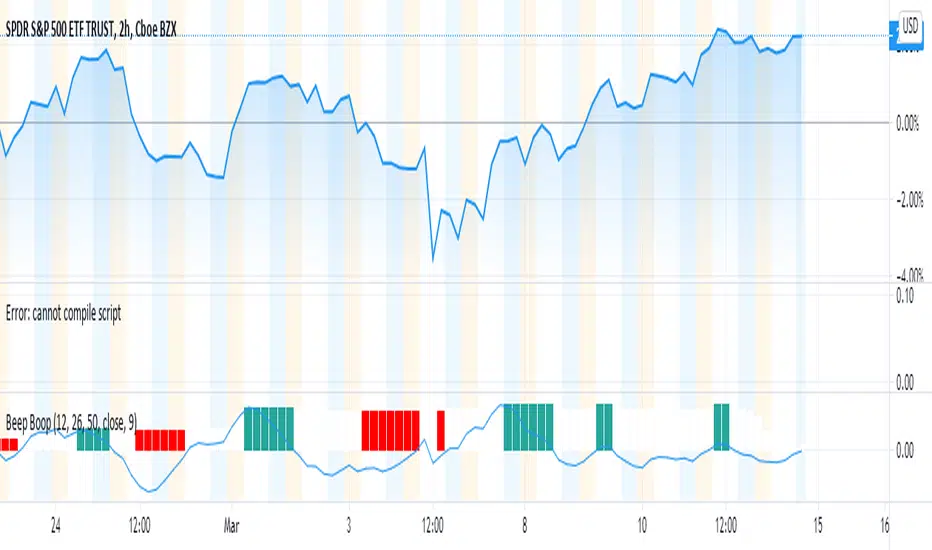
Beep Boop(Improved) Beep Boop Indicator for Trending Markets originally written by Trading Rush.
It is originally based on the MACD 12-26 and the 50 bar EMA.
The macd hist is color coded with green as buy and sell as red.
I added an option to use a couple of lower lag ema's (See line 13 - ema_signal).
TA Basics: Creating a Zero Lag Moving Average using "Mirroring"we all know how moving averages suffer from lag - they have a delayed response to change in the underlying values - regardless if the underlying values are price movement or some kind of indicator formula that we are trying to smooth using a moving average.
here's a simple technique that can help minimize the lag built into the moving average - you can use this technique while building your own indicator (say modifying RSI) or simply apply it to a price chart to generate some sort of signal.
the concept here is simple and it actually depends on the fact that there's lag in moving averages - however, it was also observed that this lag is less when we use a weighted moving average (WMA) vs a simple moving average (SMA). (for a quick intro / refresher on Moving Averages, there's an awesome write-up here on TradingView that you can easily find with a quick search)
so the idea is to take the delta between these 2 lines (which is mathematically equal to SMA - WMA) , and "mirror it" on the other side of the WMA to produce the new Zero-lag line (let's call it ZLMA. sounds easy, right?
now, expanding on this concept just one step further, while we're at it, why don't we take, say, 1.5 times that delta, or 2 times and mirror it - wouldn't that produce an even less lagging line that moves in lockstep with the price (or whatever data series)? -- yes it would, we added that in the sample code here, but be careful with that, if you increase that factor too much, the ZLMA starts behaving "wildly" and loses relevance to the underlying data. so keep it from 1 to 2.5 -- an ideal value would be around the 1.5 (and of course, for the mathematically gifted, as you expect, you make that factor -1.0, and you end up with a ZLMA that is exactly same as the SMA :) ..
if you don't use a ZLMA factor "f" -- then the simple equation is ZLMA = 2W - S, which you can simply add to any indicator to smoother it without introducing a lot of lag -- however, i still suggest you keep that smoothing to a small value between 3 and 6 -- to stay relevant to underlying data
hope you like this and find it useful. let me know -- i'd like to know if there's interest in these types of concepts and there's more to come.
pls stay safe,

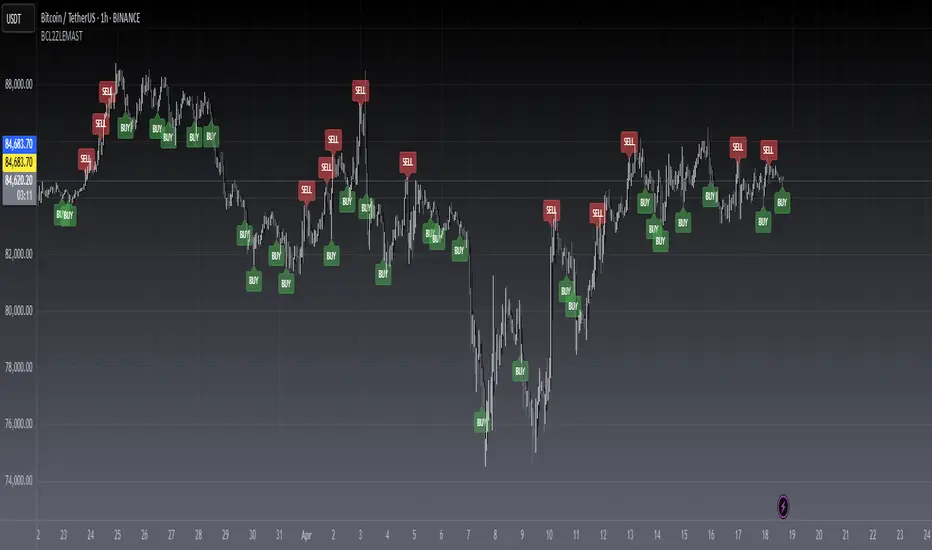
ZeroLag MAsZeroLag MAs using DEMA and TEMA inside it.
Added Bollinger Bands to spot bottom and top easier too.

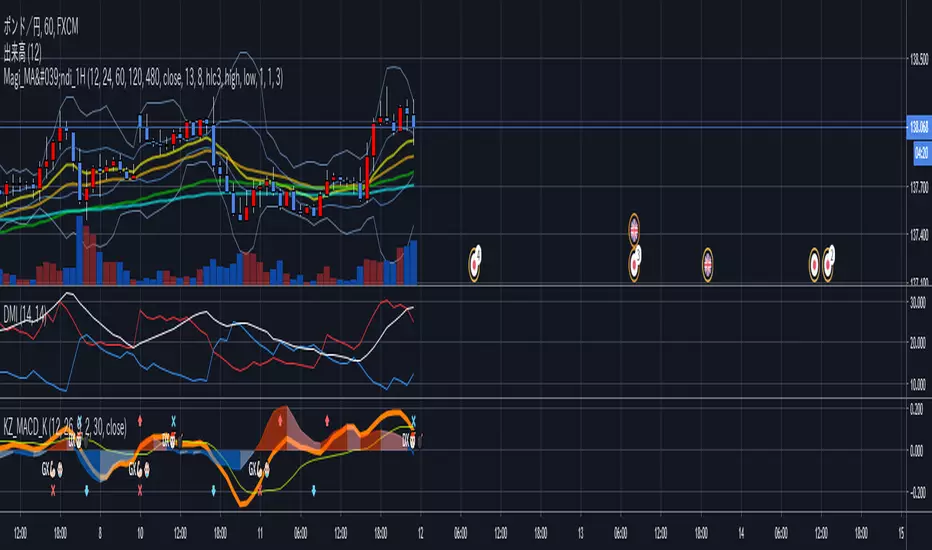
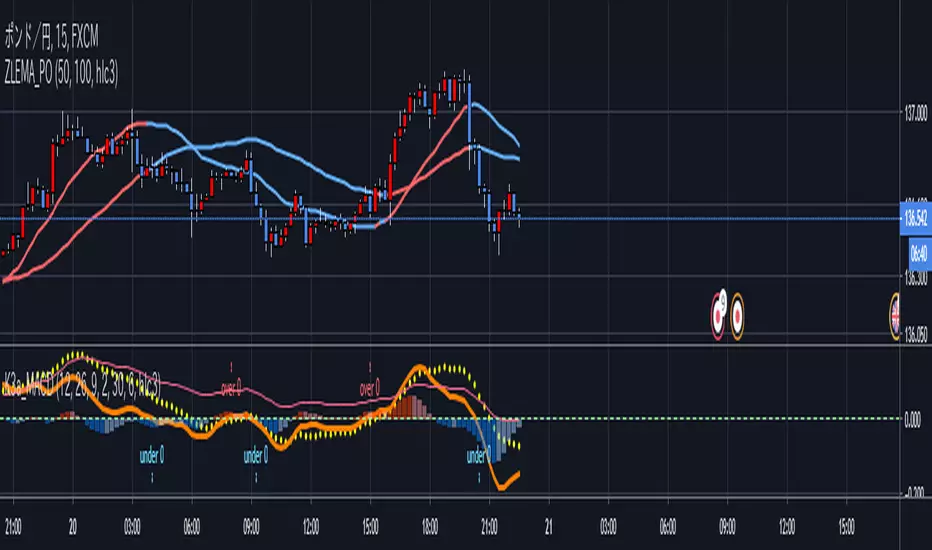
Koby's 3 average MACD indicatorThis MACD is averaging 3 different MACD; KAMA MACD, ZLEMA MACD, and normal MACD.
Can find easier MACD's divergence and convergence than normal MACD.
And more smoothly drawing than ZLEMA MACD (KZ_MACD) which is I've made before.
Koby's ZLEMA MACD and KAMA signalUsing zero lag ema for MACD line, and using KAMA for MACD's signal line.
Test version.
This has MACD and signal cross alert, and 0 line alert.