Carta volume footprint: panduan penuh
Volume footprint adalah alat berkuasa Carta Super yang memvisualkan pengagihan volum dagangan sepanjang berbilang tingkatan harga untuk setiap lilin pada rangka masa tertentu, memberikan pedagang maklumat tambahan untuk membantu mengenalpasti kawasan kecairan tinggi atau aktiviti dagangan ketara.
KANDUNGAN:
Apakah carta volume footprint
Secara lalai, jenis carta ini memaparkan pengagihan volum penjual kepada kiri setiap lilin dan volum pembeli di bahagian kanan, dengan warna kecerunan pilihan yang menunjukkan keamatan relatif volum pada setiap tingkatan. Ia meletakkan garis menegak di sebelah pengagihan untuk menyerlahkan kawasan ketidakseimbangan ketara.
Selain daripada itu, ia menunjukkan Value Area (VA) dan Point of Control (POC) setiap bar dan memaparkan delta volum dan maklumat jumlah volum di bawah setiap lilin.

Pengiraan
Sumber data volum
Jenis carta ini mendapatkan semula data volum simbol dari berbilang selang masa intrabar (selang masa lebih rendah dari carta) untuk pengiraan sejarahnya. Selang masa ini menaik secara berterusan kerana data sejarah yang ada semakin berkurangan, bermula dengan selang masa tersedia paling rendah. Dalam kata lain, semakin dalam anda pergi ke sejarah carta, semakin tinggi selang masa intrabar untuk data volum. Footprint untuk lilin terkini carta adalah paling tepat kerana mereka menggunakan maklumat paling jelas dalam pengiraan mereka.
Carta memohon data intrabar berdasarkan rangka masa utamanya:
- Rangka masa intrahari: 1 tick (untuk pelan profesional) → 1 saat → 1 minit → 60 minit.
- Carta harian: 1 minit → 60 minit.
- Carta Mingguan dan Bulanan: 60 minit.
Selang masa intrabar tertinggi diminta untuk pengiraan footprint sejarah bergantung kepada rangka masa carta dipilih.
Pengelasan volum
Carta volume footprint mengkategorikan volum sebagai "beli" atau "jual" berdasarkan kepada arah pergerakan harga intrabar.
Ia menggunakan algorithma berikut untuk menentukan kategori untuk setiap nilai volum:
- Jika harga tutup intrabar melebihi harga bukanya, ia memperuntukkan volum kepada kategori "beli"
- Jika harga tutup intrabar di bawah harga bukanya, ia memperuntukkan volum kepada kategori "jual"
- Jika harga tutup bersamaan dengan harga buka:
- Volum akan tergolong dalam kategori "beli" jika intrabar semasa tutup melebihi harga tutup intrabar sebelumnya
- Volum akan tergolong dalam kategori "jual" jika intrabar semasa tutup di bawah harga tutup intrabar sebelumnya
- Volum akan tergolong dalam kategori yang sama dengan intrabar sebelum jika harga tutup mereka adalah sama
Carta mengumpul volum dikategorikan merentasi selang masa lebih rendah pada tingkatan harga berbeza untuk membina perwakilan footprint.
Pengesanan ketidakimbangan
Satu pasaran yang seimbang terjadi apabila ada keseimbangan antara bekalan dan permintaan, yang selalunya menyebabkan harga stabil secara relatif. Sebaliknya, pasaran tidak seimbang terjadi apabila ada perbezaan ketara antara bekalan dan permintaan, yang selalunya menyebabkan pergerakan harga yang lebih ketara.
Carta volume footprint mengesan ketidakseimbangan belian apabila volum "beli" pada tingkatan harga melebihi volum "jual" pada tingkatan di bawah peratusan ditentukan. Sama juga, ia mengesan ketidakseimbangan jualan apabila volum "jual" pada tingkatan melebihi volum "beli" pada tingkatan di atas peratusan tersebut.
Pengguna boleh mengawal peratusan yang mana volum "beli" hendaklah melebihi volum "jual" atau sebaliknya, untuk mengesan ketidakseimbangan menerusi input "Ketidakseimbangan" dalam tetapan carta. Secara lalai, nilai ini adalah 300% (iaitu volum pada satu bahagian hendaklah tiga kali lebih besar dari bahagian yang lain).
Apabila ia mengesan ketidakseimbangan "beli", carta akan memaparkan garis menegak ke kanan tingkatan harga yang sepadan. Apabila ketidakseimbangan "jual" terjadi, satu garis menegak akan muncul di bahagian kiri tingkatan.

Dalam contoh diberikan, perbandingan berurutan untuk volum pada tingkatan berlainan telah dilaksanakan. Untuk setiap perbandingan, penilaian menentukan sama ada volum pasangan lebih besar melebihi nilai ambang ketidakseimbangan ditentukan, menurut formula: maksimum(beli, jual) ≥ (peratusan ketidakseimbangan / 100) * minimum(beli, jual).
Pengiraan awal adalah seperti berikut: 506.37 ("beli") ≥ (300 / 100) * 166.433 ("jual"). Pernyataan ini adalah benar, menunjukkan ketidakseimbangan belian. Perbandingan seterusnya mengikut logik yang sama: "beli" tingkatan 3 adalah dibandingkan dengan "jual" tingkatan 2, dan "beli" tingkatan 4 dengan "jual" tingkatan 3.
Pedagang selalunya menganalisa volume footprints untuk mengenal pasti keseimbangan dan ketidakseimbangan dalam pasaran.
Apabila pasaran adalah seimbang, volume footprint mungkin menunjukkan volum dagangan diagihkan secara seimbang merentasi pelbagai tingkatan harga, mencadangkan kestabilan dan keseimbangan. Sebaliknya, apabila dalam keadaan ketidakseimbangan, volume footprint mungkin menunjukkan kluster aktiviti dagangan menaik pada tingkatan tertentu, menunjukkan perbezaan kawasan bekalan atau permintaan dan potensi trend harga.
Terjemahan
Aliran pesanan
Semasa proses pelaksanaan pesanan, peserta pasaran terbabit dalam mencari keseimbangan harga yang akan memenuhi kedua-dua pembeli dan penjual, yang akan memacu transaksi. Volum diarahkan untuk setiap transaksi menentukan sumbangannya kepada tekanan belian dan jualan pasaran.
Apabila bekalan melebih permintaan, pergerakan harga ke bawah mungkin terjadi kerana pasaran bergerak ke arah harga yang lebih menguntungkan untuk pembeli. Sebaliknya, apabila permintaan untuk aset melebihi bekalannya, harga mungkin akan naik sehingga cukup peserta yang mahu menjualnya.
Menganalisa kepekatan aktiviti belian dan jualan merentasi tingkatan harga dengan carta volume footprint boleh memberikan cerapan lebih mendalam kepada dominasi penjual dan pembeli, keseimbangan dan ketidakseimbangan antara bekalan dan permintaan, dan kawasan kecairan dinaikkan (cth., kawasan dengan aktivit dagangan yang tinggi). Pedagang boleh menggunakan cerapan sebegitu untuk mengukur sentimen pasaran dan mengenal pasti peluang dagangan.
Lelongan Gagal (Failed Auction)
Dalam Auction Market Theory, satu lelongan gagal adalah corak yang mana pasaran gagal meletakkan satu harga untuk instrumen, menjadikannya kembali kepada harga sebelum. Pedagang selalunya menganalisa lelongan gagal dengan alatan seperti "Profil Pasaran," tetapi mereka juga boleh mengenal pasti kejadian corak tersebut menggunakan footprints.
Lelongan gagal selalunya terjadi apabila satu bahagian pasaran, sama ada penjual atau pembeli, gagal menarik cukup penyertaan untuk mengekalkan aktiviti dagangan pada tingkatan harga, yang berpotensi menyebabkan balikan harga pantas kerana peserta pasaran menilai semula dan melaraskan posisi mereka. Lelongan gagal selalunya datang bersama-sama kenaikan ketidakstabilan, dan ia boleh menunjukkan titik potensi akan berlakunya perubahan penting dalam pasaran.
Pedagang dan penganalisa selalunya memerhatikan dengan rapat kepada lelongan gagal kerana ia boleh memberikan cerapan bernilai kepada dinamik pasaran dan peluang dagangan. Mengenal pasti keadaan lelongan gagal boleh membantu pedagang mengenal pasti tingkatan sokongan dan rintangan dan menganggarkan corak balikan yang berpotensi.
Contoh di bawah menunjukkan kes di mana harga bergerak berturut-turut lebih tinggi dengan setiap bar manakala volum penjual mula menurun. Pada bar keempat dalam imej, ketidakseimbangan antara penjual dan pembeli mencapai satu titik di mana penjual tidak boleh menolak harga lebih tinggi, dan harga akan membalik ke bawah.
Anda boleh menterjemahkan kawasan ketidakseimbangan ini sebagai tingkatan rintangan yang berpotensi. Jika harga memecah menerusi tingkatan ini di masa hadapan, ia mungkin mencadangkan trend yang sedang berkembang.

Perbezaan Delta (Delta Divergence)
Perbezaan delta dalam volume footprints merujuk kepada percanggahan dalam pergerakan harga dan delta volum.
Perbezaan delta positif terjadi apabila harga bergerak ke bawah berturut-turut manakala delta volum menaik, dengan kemungkinan ia bertukar menjadi positif. Sebaliknya, delta negatif terjadi apabila harga naik berturut-turut manakala delta volum jatuh atau menjadi negatif. Corak perbezaan ini selalunya mencadangkan bahawa, walaupun dengan tindakan harga semasa, asas tekanan belian atau jualan berkurang, memberikan isyarat adanya kemungkinan terjadi pelemahan atau balikan kepada trend semasa.
Contoh di bawah menunjukkan empat bar yang jatuh, dua yang mempunyai delta positif. Dalam kata lain, bar-bar ini mempamerkan perbezaan delta positif.

Pedagang selalunya menganalisa perbezaan delta dalam carta footprint untuk membantu mereka menganggarkan adanya potensi balikan atau perubahan dalam arah pasaran. Akan tetapi, adalah penting untuk mengambil kira faktor-faktor lain dan menggunakan alatan tambahan untuk membantu mengesahkan perbezaan dan melakukan keputusan dagangan termaklum.
Lebihan dagangan pada tingkatan harga ekstrem
Dalam Auction Market Theory, harga pasaran naik sehinggalah permintaan tamat dan jatuh sehinggalah bekalan tiada. Pergerakan menyeluruh ini mewakili satu lelongan lengkap. Pada carta footprint, keadaan ini kelihatan seperti sifar atau pembelian minimum pada tingkatan harga rendah atau jualan minimum pada tingkatan harga tinggi.
Dalam beberapa kes, satu keadaan dirujuk sebagai lelongan tidak lengkap mungkin akan muncul, di mana perbezaan antara volum beli dan jual pada tingkatan tinggi atau rendah berbeza hanya sedikit relatif kepada perbezaan pada tingkatan sebelumnya. Keadaaan sebegini mungkin menunjukkan bahawa eksplorasi harga adalah tidak lengkap, dan mungkin masih ada peserta pasaran yang berminat di atas tinggi semasa atau di bawah rendah semasa. Secara asasnya, corak ini mungkin menunjukkan bahawa harga pasaran akan bergerak dalam arahnya melebihi julat semasa sehinggalah lelongan selesai.

Pemberitahuan
Anda sekarang boleh mencipta pemberitahuan pada carta Volume Footprint — membenarkan anda mendapat notifikasi apabila aliran pesanan penting terjadi terus pada carta footprint anda.
Syarat pemberitahuan berikut adalah tersedia pada masa ini:
- Ketidakseimbangan beli adalah ditindan — tercetus apabila ketidakseimbangan berbilang belian berturutan muncul pada tingkatan harga berturutan.Mesej pemberitahuan lalai: “Satu ketidakseimbangan belian telah ditindan merentasi berbilang tingkatan!”
- Ketidakseimbangan belian baharu —tercetus apabila satu ketidakseimbangan beli tunggal dikesan pada mana-mana tingkatan harga.Mesej pemberitahuan lalai: “Satu ketidakseimbangan belian ditemui.”
- Ketidakseimbangan jualan baharu — tercetus apabila satu ketidakseimbangan jualan tunggal dikesan.Mesej pemberitahuan lalai: “Satu ketidakseimbangan jualan ditemui.”
- Ketidakseimbangan jual adalah ditindan — tercetus apabila ketidakseimbangan berbilang jualan berturutan muncul pada tingkatan harga berturutan.Mesej pemberitahuan lalai: “Satu ketidakseimbangan jualan telah ditindan merentasi berbilang tingkatan!”
Tambahan kepada pemberitahuan berdasarkan ketidakseimbangan, anda juga boleh menetapkan pemberitahuan pada Delta Volum, Jumlah Volum Beli dan Jumlah Volum Jual.
Syarat-syarat ini menyokong julat penuh operator pemberitahuan, termasuk:
Operator perbandingan:
- Merentasi, Rentas Ke Atas, Rentas Ke Bawah
- Lebih Besar Daripada, Kurang Daripada
Operator berasaskan saluran:
- Memasuki Saluran, Keluar Dari Saluran
- Di Dalam Saluran, Di Luar Saluran
Operator berasaskan pergerakan:
- Bergerak Ke Atas, Bergerak Ke BawahBergerak Ke Atas %, Bergerak Ke Bawah %

Kefungsian ini diintegrasikan sepenuhnya kepada infrastruktur pemberitahuan yang ada, membenarkan penggunaan semua ciri-ciri berkaitan.
Fleksibiliti ini membenarkan anda menjejak bukan sahaja formasi ketidakseimbangan, tetapi juga perubahan penting dalam jumlah aliran pesanan — sebagai contoh, apabila delta merentasi di atas sifar, atau apabila volum beli melebihi nilai ambang yang memberikan isyarat pengumpulan agresif.
Pemberitahuan ini membantu pedagang menjejak ketidakseimbangan bekalan dan permintaan yang semakin berkembang dalam masa nyata.Dengan menggabungkan pemberitahuan ketidakseimbangan dan pemvisualan footprint, anda boleh menemukan dengan pantasi detik di mana pembeli atau penjual agresif mula mendominasikan pasaran — selalunya memberikan isyarat perubahan berpotensi dalam arah pasaran atau ketidakstabilan yang akan datang.
Nota penting untuk terjemahan
Apabila menterjemahkan keputusan pemberitahuan untuk Volume Footprints, sentiasa ingat bahawa kajian ini adalah teknik pelukisan semula (repainting).Dalam masa nyata, carta mungkin menggunakan satu sumber data intrabar (cth., 1T) untuk pengiraan, manakala bar yang sama mungkin akan dikira semula kemudiannya menggunakan selang masa kurang granular (cth., 1S) sebaik sahaja data sejarah menjadi tersedia.Ini bermaksud bahawa penampilan ketidakseimbangan — dan disebabkan itu pemberitahuan tercetus — boleh berbeza sedikit antara pelaksanaan masa nyata dan semakan sejarah.
Selain daripada itu, apabila menggunakan Saiz baris = ATR, carta secara automatik memperoleh bilangan Tick setiap baris dari nilai ATR semasa.Untuk perbandingan konsisten antara isyarat pemberitahuan dan visual carta, adalah disyorkan untuk menetapkan secara manual Tick setiap baris kepada nilai yang sama dan mengkonfigurasikan pemberitahuan dengan msaiz baris manual apabila boleh.
Untuk lebih maklumat mengenai gelagat pelukisan semula dan bagaimana ia boleh mempengaruhi pengiraan skrip, lihat artikel mengenai Pelukisan semula
Tetapan
Pilihan penyesuaian untuk carta volume footprint adalah tersedia dari tetapan carta, yang anda boleh akses dari butang gear dalam bar alat di atas carta.
Lilin

Tetapan dalam bahagian "Lilin" adalah sama dengan yang untuk carta candlestick biasa. Dari bahagian ini, anda boleh mengkonfigurasikan paparan candlestick.
Volume footprint

Saiz baris
Mengawal bagaimana carta menentukan saiz setiap baris footprint (tingkatan). Ada dua cara untuk dipilih iaitu:
- Pilihan "Automatik" menjelaskan bahawa carta akan mengira saiz secara automatik berdasarkan kepada nilai Average True Range (ATR) yang dinormalkan terkini. Ia menggunakan formula: 0.2 * NormalizedATR / Tick Minimum. Carta mengira semula saiz apabila memilih jenis carta "Volume footprint" atau menukar simbol atau rangka masa. Apabila menggunakan pilihan ini, input di bawah menjelaskan panjang untuk pengiraan ATR
- Pilihan "Manual" menjelaskan bahawa carta akan menggunakan bilangan tick yang dijelaskan dalam input "Tick setiap baris" di bawah
Panjang ATR
Menentukan panjang dilancarkan untuk Average True Range digunakan untuk mengira bilangan tick untuk setiap baris footprint apabila input "Saiz baris" menggunakan pilihan "Automatik".
Tick setiap Baris
Menentukan bilangan tick untuk setiap baris footprint apabila input "Saiz baris" menggunakan pilihan "Manual".
Paparan
Menentukan jenis paparan carta. Dalam mod Kelompok, semua sel mempunyai lebar yang sama. Dalam mod Profil, lebar setiap sel adalah berkadar terus dengan volum dagangan pada tingkatan itu, menawarkan perwakilan lebih jelas dan dinamik.
Jenis
Menentukan mod paparan footprint pada carta. Ada empat pilihan tersedia:
- Pilihan "Beli dan Jual" (lalai) memaparkan volum penjual sepanjang tingkatan ke bahagian kiri setiap lilin dan volum pembeli di sebelah kanan
- Pilihan "Delta" akan memaparkan satu lajur ke sebelah kanan setiap bar yang menunjukkan delta volum (cth., perbezaan antara volum pembeli dan penjual) untuk setiap tingkatan
- Pilihan The "Total" akan memaparkan satu lajur ke sebelah kanan setiap bar yang menunjukkan jumlah volum pada setiap tingkatan harga
- Pilihan "Tangga" akan diserlahkan dengan warna volum tertinggi pada setiap tingkatan harga
Gunakan kecerunan kepada latar belakang
Jika diaktifkan, warna latar belakang untuk setiap tingkatan footprint akan berbeza berdasarkan kepada volumnya berbanding volum tingkatan lain. Carta menggunakan algoritma berikut untuk mengira warna kecerunan:
- Tentukan volum maksimum dan minimum
- Kira julat volum, iaitu perbezaan antara nilai volum maksimum dan minimum
- Tolak volum minimum dari volum tingkatan semasa
- Kira nisbah nilai diperolehi dalam langkah 3 kepada julat volum diperolehi dalam langkah 2
- Gunakan nisbah dari langkah 4 untuk memilih warna dari pilihan ini:
- Pilih warna pertama jika nisbah adalah kurang daripada 0.25
- Pilih warna kedua jika nisbah adalah lebih besar atau sama dengan 0.25 dan kurang daripada 0.5
- Pilih warna ketiga jika nisbah adalah lebih besar atau sama dengan 0.5 dan kurang daripada 0.75
- Pilih warna keempat jika nisbah adalah lebih besar atau sama dengan 0.75
- Ulangi langkah 3 ke 5 untuk setiap tingkatan harga
Apabila jenis footprint adalah "Beli dan jual" atau "Delta," carta mengira kecerunan untuk bahagian beli dan jual secara berasingan.
Latar belakang
Input-input ini menjelaskan warna latar belakang yang digunakan oleh tingkatan footprint. Pengguna boleh memilih warna berasingan untuk bahagian beli dan jual apabila jenis footprint adalah "Beli dan jual" atau "Delta" .
Jika pilihan "Laksanakan kecerunan kepada latar belakang" diaktifkan, kecerunan empat warna akan tersedia untuk setiap pilihan warna. Carta akan memilih warna untuk setiap tingkatan menggunakan algoritma yang dijelaskan dalam bahagian sebelum ini.
Kawasan nilai
Mengaktifkan garis Kawasan Nilai (VA) dan menjelaskan peratusan VA. Garis Kawasan Nilai Tinggi (VAH) akan muncul di atas semua tingkatan yang dimasukkan dalam Kawasan Nilai dan garis Kawasan Nilai Rendah (VAL) akan muncul di bawah semua tingkatan dalam Kawasan Nilai. Algoritma Kawasan Nilai carta volume footprint adalah sama dengan algoritma yang digunakan oleh penunjuk Profil Volum kami.
Label
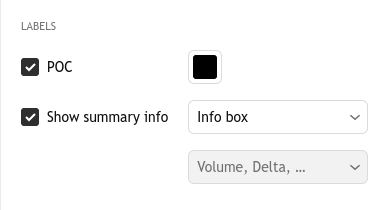
POC
Menentukan sama ada carta akan memaparkan setiap Titik Kawalan - Point of Control (POC) footprint.
Tunjuk maklumat ringkasan
Menentukan sama ada setiap Footprint memaparkan maklumat terperinci.Ada dua mod tersedia:
- Kotak Maklumat (lalai) — Memaparkan kotak maklumat kompak di bawah setiap Footprint, menunjukkan jumlah volum, jumlah volum beli dan jual dan keseluruhan delta volum.
- Jadual — Apabila dipilih, ia mencipta panel tambahan di bawah carta Footprint.Panel ini memberikan data dilanjutkan untuk setiap pengiraan Footprint.Gunakan menu lungsur turun untuk memilih parameter yang hendak dipaparkan:
- Volum — Jumlah volum didagangkan untuk bar.
- Perubahan volum, % — Peratusan perubahan dalam volum berbanding dengan bar sebelum.
- Volum beli — Jumlah volum untuk semua dagangan beli dalam bar.
- Volum beli , % — Peratusan volum beli relatif kepada jumlah volum bar.
- Volum jual — Jumlah volum untuk semua dagangan jual dalam bar.
- Volum jual, % — Peratusan volum jual relatif kepada jumlah volum bar.
- Delta — Perbezaan antara volum beli dan jual untuk bar.
- Delta, % — Delta dijelaskan sebagai peratusan jumlah volum (Delta / Volum × 100).
- Delta minimum — Nilai delta minimum direkodkan dalam bar.
- Delta maksimum — Nilai delta maksimum direkodkan dalam bar.
- Sesi CVD — Delta volum kumulatif, dikira dan disetkan semula sekali sehari (ditetapkan tempoh 1H).
- POC — Titik kawalan Footprint.
- Julat HL — Julat harga bar, dikira sebagai Tinggi – Rendah.
- Open interest tinggi — hanya untuk niaga hadapan — Nilai open interest tertinggi dalam bar (tersedia untuk niaga hadapan sahaja).
- Open interest rendah — hanya untuk niaga hadapan — Nilai open interest terendah dalam bar (tersedia untuk niaga hadapan sahaja).
- Volum — Jumlah volum didagangkan untuk bar.

Ketidakseimbangan

Menentukan peratusan di mana volum pembeli mestilah mengatasi volum penjual atau sebaliknya, untuk mengesan ketidakseimbangan. Lihat bahagian "Ketidakseimbangan dikesan" di atas untuk mengetahui bagaimana carta volume footprint mengesan ketidakseimbangan.
Serlahan
Menentukan sama ada carta akan menyerlahkan tingkatan harga tidak seimbang dan menentukan warna. Apabila penyerlahan ketidakseimbangan diaktifkan, carta meletakkan garis menegak berwarna ke bahagian tingkatan yang tidak seimbang dengan ketara. Carta memaparkan penanda ketidakseimbangan beli di sebelah kanan tingkatan dan penanda ketidakseimbangan jual di sebelah kiri.
Tingkatan ditindan
Mengawal sama ada untuk memaparkan ketidakseimbangan ditindan dan bilangan tingkatan berturutan yang diperlukan dengan ketidakseimbangan pada bahagian yang sama untuk mengesan ketidakseimbangan ditindan. Apabila diaktifkan, carta menunjukkan ketidakseimbangan ditindan sehinggalah harga seterusnya bersilang dengan tingkatan.
Kesimpulan volume footprint
Carta volume footprint adalah sebuah alat dagangan berkuasa yang memaparkan agihan volum beli dan jual pada setiap tingkatan harga dalam lilin individu pada carta anda. Tidak seperti carta tradisional yang hanya menunjukkan pergerakan harga, volume footprint menunjukkan pertempuran dalaman antara pembeli dan penjual dengan mengkategorikan volum berdasarkan sama ada harga bergerak ke atas atau ke bawah semasa rangka masa lebih kecil. Carta memaparkan volum penjual pada bahagian kiri setiap lilin dan volum penjual pada bahagian kanan, dengan warna kecerunan dan garis menegak menyerlahkan kawasan ketidakseimbangan ketara di mana satu bahagian mendominasikan dengan kuat bahagian yang lain.
Analisis volum terperinci ini membantu pedagang mengenal pasti dinamik pasaran utama seperti lelongan gagal, perbezaan delta dan kawasan kecairan tinggi yang tidak ditunjukkan oleh carta tradisional. Dengan memeriksa kawasan kebanyakan aktiviti dagangan terjadi (Titik Kawalan) dan mengesan ketidakseimbangan antara bekalan dan permintaan, pedagang boleh memahami sentimen pasaran dengan lebih baik, menemui tingkatan sokongan dan rintangan berpotensi, dan menganggarkan balikan atau penerusan harga. Carta footprint secara asasnya menukar data volum kepada peta perjalanan gelagat pasaran, menjadikannya mudah untuk mencari masa masuk dan keluar berdasarkan kepada aktiviti dagangan sebenar dan bukannya dari pergerakan harga sahaja.
Juga baca: