Prestasi
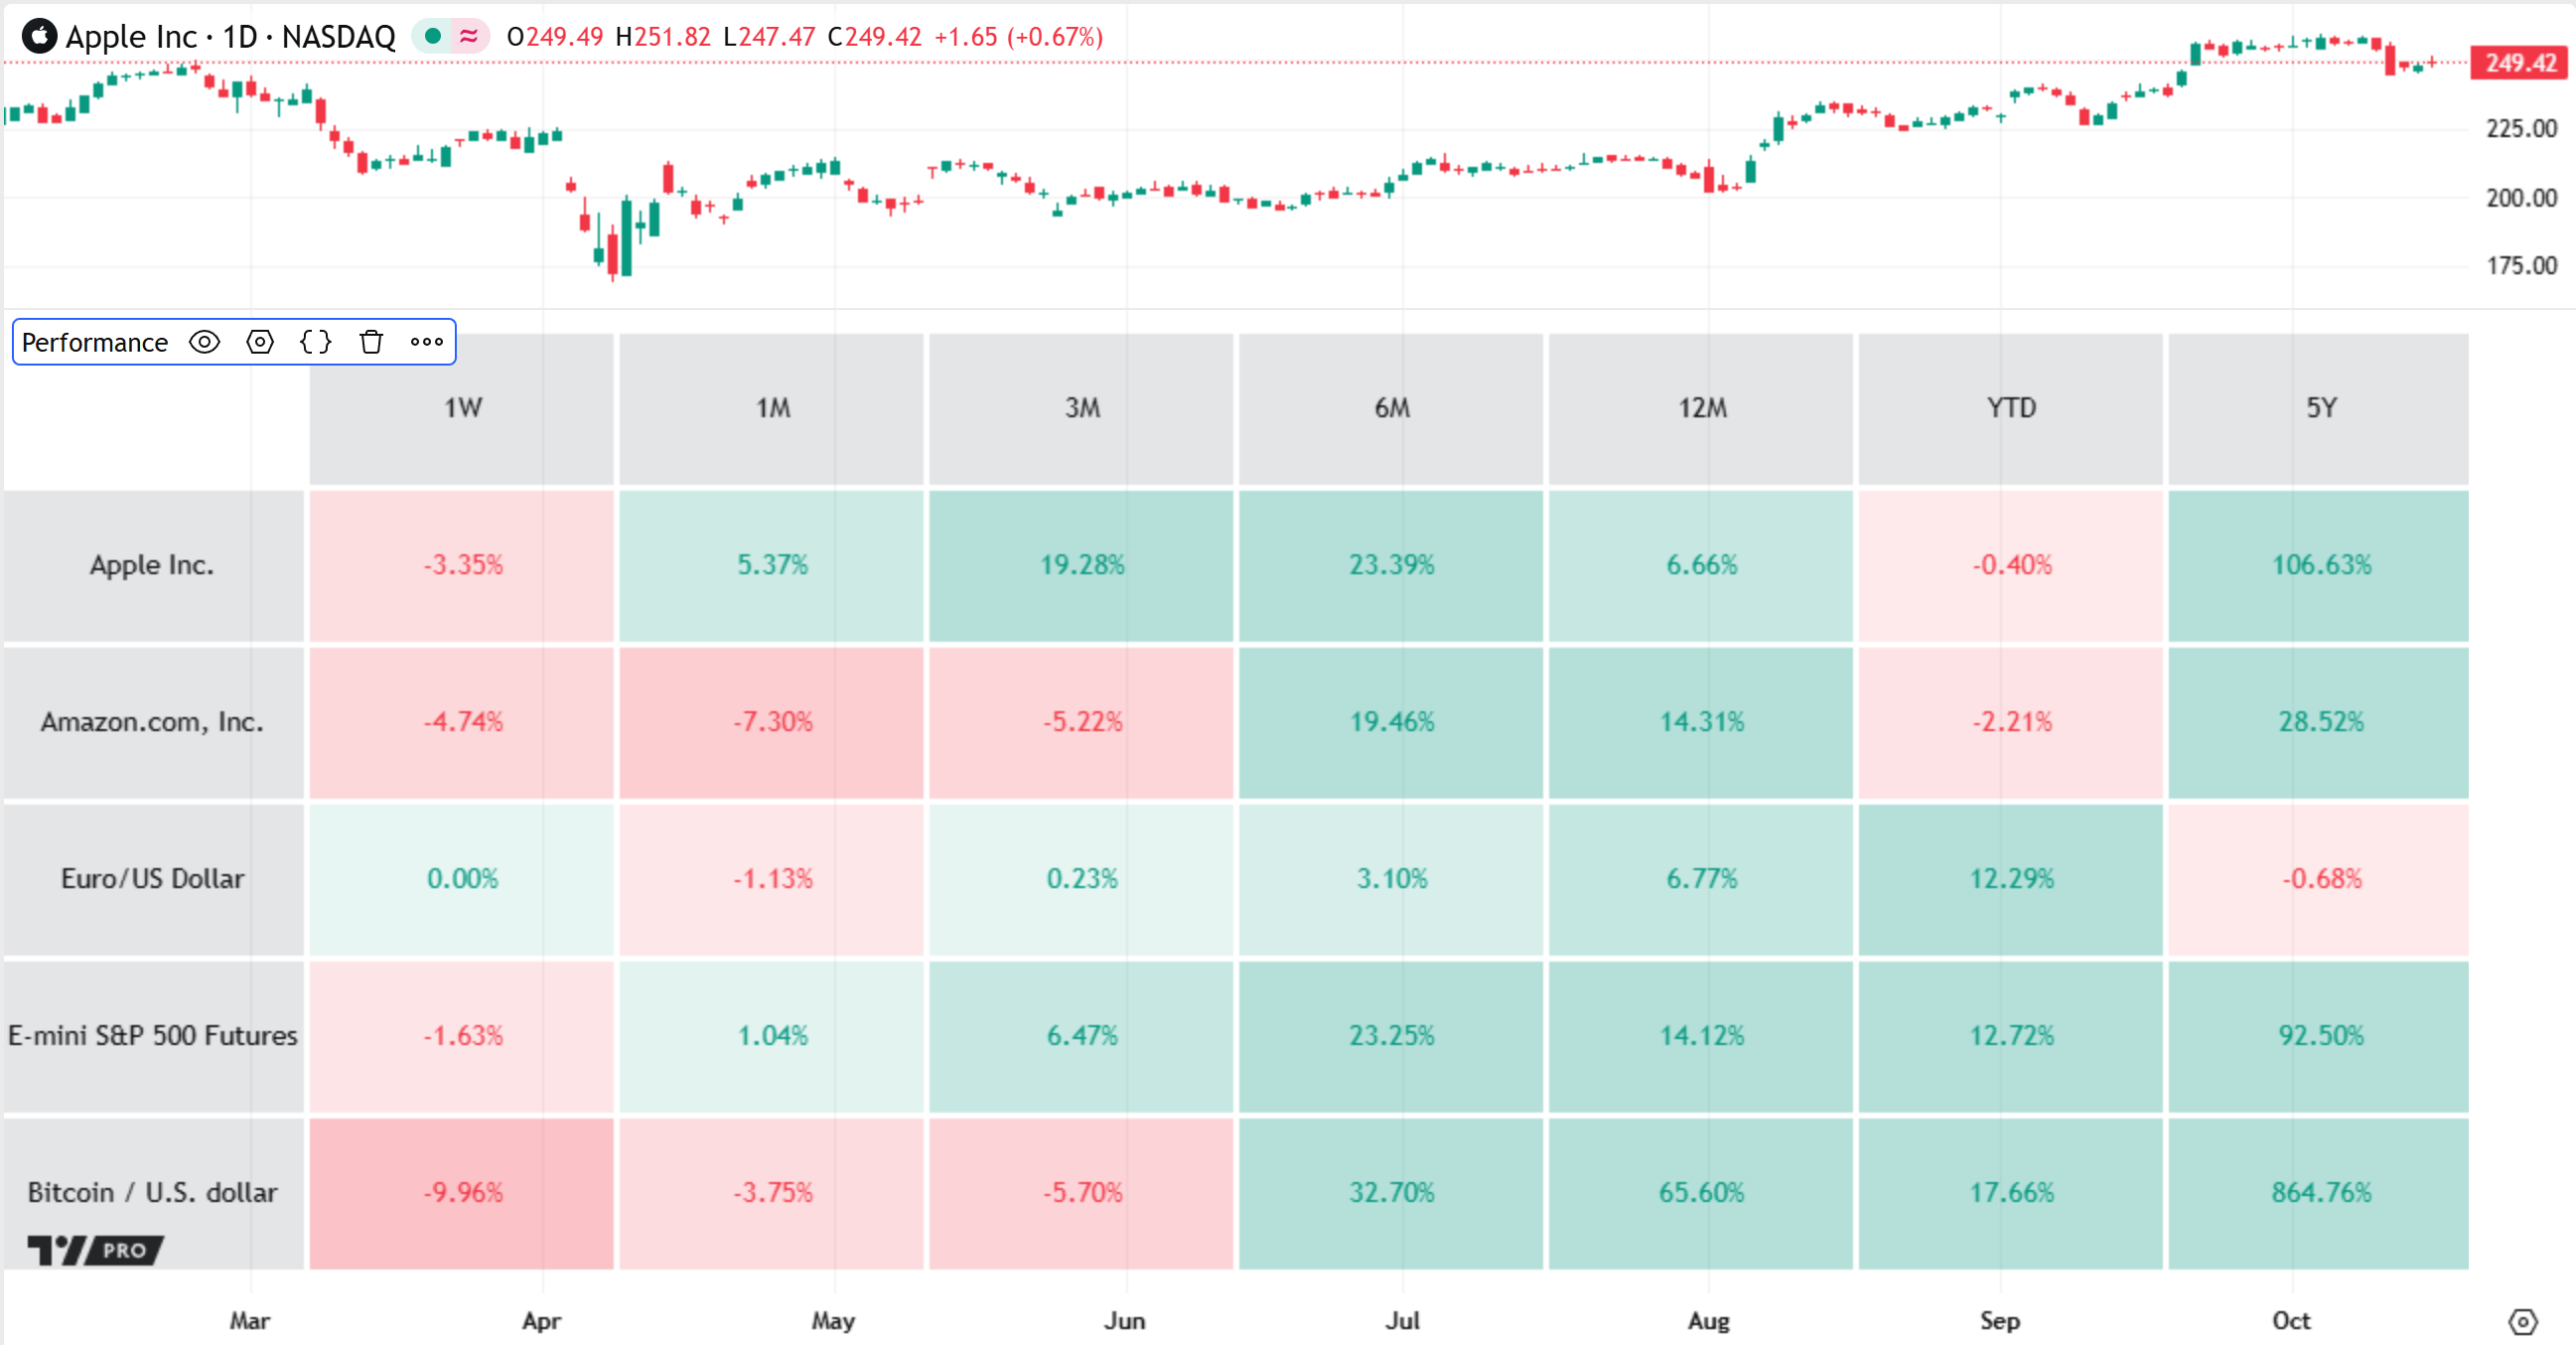
Penunjuk Prestasi memaparkan perubahan peratusan terkini dalam harga untuk satu atau lebih simbol, sepanjang satu tempoh masa dipilih, dalam jadual menggunakan gaya peta suhu. Penunjuk mempunyai input teks di mana anda boleh memberikan senarai diasingkan koma untuk mensesuaikan simbol dan rangka masa di mana ia akan memaparkan data prestasi.
Pengiraan
Penunjuk memohon harga tutup harian untuk setiap simbol dari senarai simbol ditentukan pengguna, dan mengira perubahan peratusan dalam harga-harga tersebut (nilai prestasi) merentasi setiap tempoh masa dijelaskan dalam senarai rangka masa. Setiap baris dalam jadual adalah sepadan dengan satu simbol, dan setiap lajur adalah sepadan kepada satu rangka masa. Sel pada persimpangan baris dan lajur menunjukkan jumlah relatif yang mana harga simbol tertentu dinaikkan atau diturunkan sepanjang satu daripada tempoh masa.
Untuk setiap rangka masa dan simbol disenaraikan, penunjuk menentukan masa sauh (anchor time) untuk pengiraan prestasi berdasarkan kepada masa buka untuk bar harian terkini simbol. Pengiraan masa sauh adalah bergantung kepada jenis rangka masa:
- Untuk rangka masa berdasarkan hari atau minggu, penunjuk menolak bilangan tertentu dari tempoh masa 24 jam atau 7 hari dari masa buka bar harian semasa. Sebagai contoh, jika bar semasa simbol membuka pada 10 Okt, 2025, masa sauh utnuk rangka masa "1M" adalah pada 3 Okt, 2025.
- Untuk rangka masa berdasarkan bulan atau tahun, penunjuk menolak bilangan bulan atau tahun tetapi memilih hari dan masa yang sama, melaraskan tarikh akhir sebagai kemestian. Sebagai contoh, untuk bar harian yang membuka pada 10 Okt, 2025, masa sauh "6B" adalah pada 10 Apr, 2025, dan masa sauh "2T" adalah pada 10 Okt, 2023.
- Untuk "year to date" ("YTD"), masa sauh adalah tengah malam pada hari pertama tahun bukaan bar harian semasa. Sebagai contoh, masa sauh YTD untuk apa-apa bar yang membuka pada tahun 2025 adalah pada tengah malam 1 Jan, 2025.
Selepas menentukan masa sauh simbol untuk satu daripada rangka masa yang ditentukan, penunjuk menggunakan masa itu untuk mencari bar sauh untuk peratusan perubahan simbol. Bar sauh adalah bar harian yang membuka pada masa dikira, jika ada satu wujud untuk simbol tersebut, atau bar tersedia terkini yang membuka sebelum masa berkenaan.
Untuk setiap kombinasi simbol-rangka masa, penunjuk mengira nilai prestasi mengguna formula berikut:
100 * (CurrentValue - PastValue) / PastValueDi mana CurrentValue adalah harga terkini simbol dan PastValue adalah harga penutup untuk bar sauh.
Sebagai contoh, jika harga terkini simbol adalah 215.00 dan harga tutup bar sauh "1B" adalah 193.00, nilai prestasi yang terhasil adalah 100 * (215 - 193) / 193 = 11.40%. Nilai ini menunjukkan bahawa harga simbol telah menaik sebanyak lebih daripada sebelas peratus merentasi tempoh masa satu bulan terkini.
! Petua: Untuk melihat tarikh prestasi bar sauh nilai, gerakkan kursor ke atas sel dalam jadual untuk mengeluarkan panduan alat. Panduan alat menunjukkan tarikh dalam format "hh BB tttt".Input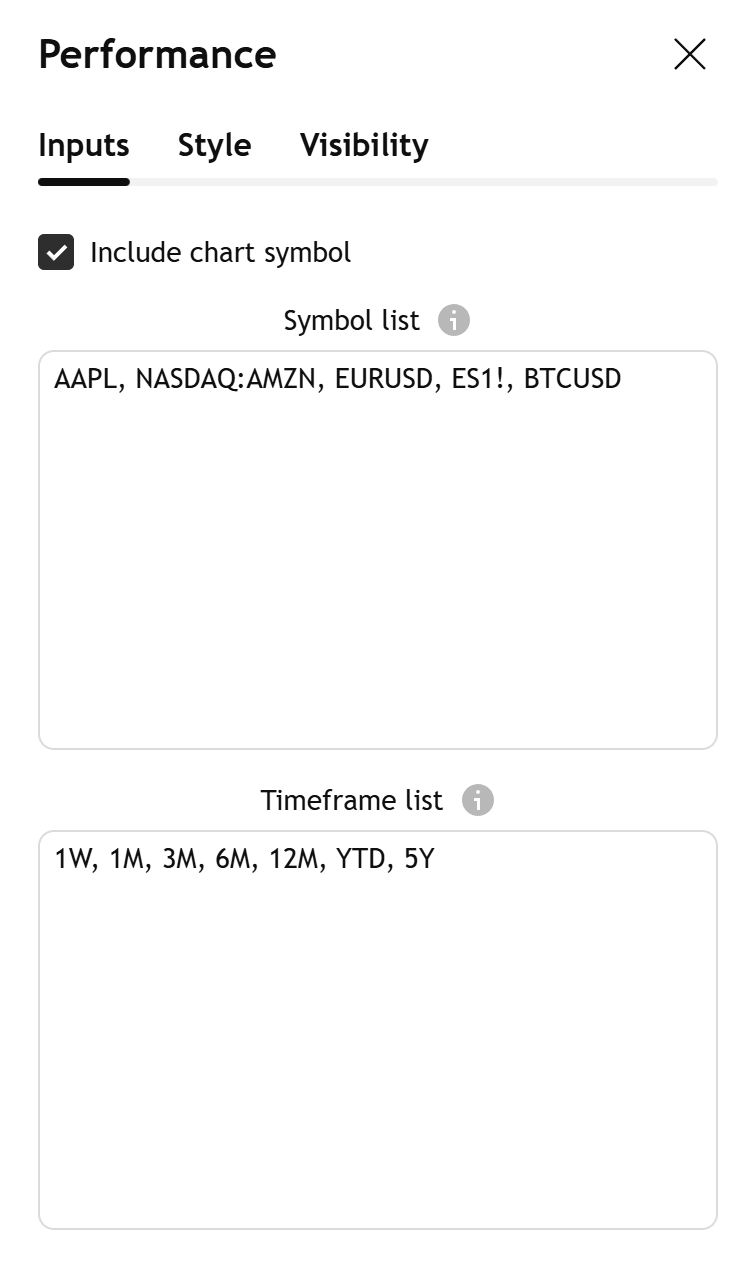
Masukkan simbol carta
Apabila diaktifkan, penunjuk menambahkan baris jadual secara automatik untuk simbol carta semasa jika simbol masih tidak dimasukkan dalam senarai simbol.
Senarai simbol
Satu senarai simbol atau ID ticker, diasingkan dengan koma, bersama selang pilihan. Setiap item boleh menentukan awalan bursa (cth. "NASDAQ:AAPL") atau hanya nama simbol ("AAPL"). Jika satu simbol disenaraikan tidak mengandungi awalan bursa, penunjuk memilih secara automatik bursa paling popular untuk simbol ini.
Senarai rangka masa
Satu senarai rangka masa, diasingkan dengan koma, bersama selang pilihan, yang menjelaskan tempoh di mana penunjuk mengira nilai prestasi untuk setiap simbol.
Setiap rangka masa disenaraikan hendaklah menggunakan satu daripada unit berikut:
- "H" untuk hari
- "M" untuk minggu
- "B" untuk bulan
- "T" untuk tahun
- "YTD" untuk tahun semasa
Semua rangka masa kecuali untuk "YTD" boleh mengandungi awalan pekali (multiplier prefix) untuk menjelaskan bilangan hari, minggu, bulan atau tahun dalam tempoh prestasi. Sebagai contoh, "3H" mewakili tempoh tiga hari dan "5T" mewakili lima tahun.

Warna positif
Warna asas untuk sel jadual yang mengandungi nilai-nilai prestasi positif.
Warna negatif
Warna asas untuk sel jadual yang mengandungi nilai-nilai prestasi negatif.
Potongan keamatan warna - Color intensity cutoff (%)
Sel jadual dengan nilai mutlak pada atau di atas had ini akan mempunyai keamatan tertinggi (kelegapan) dalam paparan peta suhu. Sebagai contoh, satu nilai potongan 10% bermaksud warna menjadi lebih legap apabila nilai berkaitan menghampiri 10%, tetapi semua nilai di atas 10% akan berkongsi kelegapan yang sama.
Posisi jadual
Tetapan ini menentukan posisi menegak dan mendatar untuk jadual peta suhu relatif kepada panelnya. Secara lalai, posisi adalah ditetapkan kepada "tengah", di mana posisi jadual adalah pada pertengahan panelnya. Gunakan input pertama untuk menggerakkan jadual ke kiri atau kanan, dan gunakan yang kedua untuk menggerakkannya ke atas atau ke bawah.
Lebar jadual (%)
Lebar jadual, dijelaskan sebagai peratusan lebar panel penunjuk. Lalai adalah 100, yang bermaksud bahawa jadual adalah sama lebar seperti panel. Jika nilai adalah 0, lebar akan dilaraskan secara automatik untuk memenuhi kandungan jadual. Ambil maklum bahawa jika senarai rangka masa mengandungi bilangan rangka masa yang besar, lebar jadual mungkin akan melebihi lebar panel.
Tinggi jadual (%)
Tinggi jadual, dijelaskan sebagai peratusan panel penunjuk. Nilai lalai adalah 95, yang bermaksud jadual adalah sedikit pendek daripada tinggi panel. Jika nilai ini adalah 0, tinggi akan dilaraskan secara automatik untuk memuatkan kandungan jadual. Ambil maklum bahawa juka senarai simbol mengandungi bilangan simbol yang banyak, tinggi jadual mungkin melepasi tinggi panel.