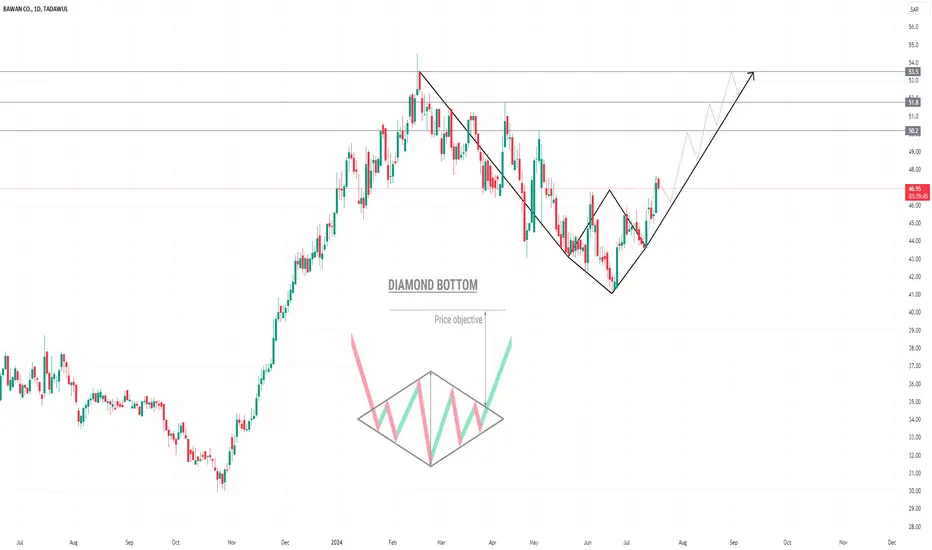
The technical chart of 1302 Bawan Company reveals a diamond pattern formation, which has recently experienced a breakout. The diamond pattern is characterized by a consolidation phase where prices initially form a narrowing range, followed by a breakout in either direction. In this case, the breakout has occurred, signaling a potential continuation of the previous trend or a reversal depending on the prevailing market conditions.
Currently, the trend is bullish following the breakout from the diamond pattern. Key resistance levels to monitor on the upside include 50.20, 51.80, and 53.50. These levels may act as barriers to further upward movement. For risk management purposes, a prudent approach would be to place a stop loss below 45, aligning with recent price support and the lower boundary of the diamond pattern.
Traders and investors may view the breakout from the diamond pattern as a bullish signal, suggesting potential further gains if the price continues to move above resistance levels. As always, monitoring price action and adjusting strategies in response to market dynamics are advisable.
Dagangan aktif
Penafian
Maklumat dan penerbitan adalah tidak bertujuan, dan tidak membentuk, nasihat atau cadangan kewangan, pelaburan, dagangan atau jenis lain yang diberikan atau disahkan oleh TradingView. Baca lebih dalam Terma Penggunaan.
Penafian
Maklumat dan penerbitan adalah tidak bertujuan, dan tidak membentuk, nasihat atau cadangan kewangan, pelaburan, dagangan atau jenis lain yang diberikan atau disahkan oleh TradingView. Baca lebih dalam Terma Penggunaan.