Introduction
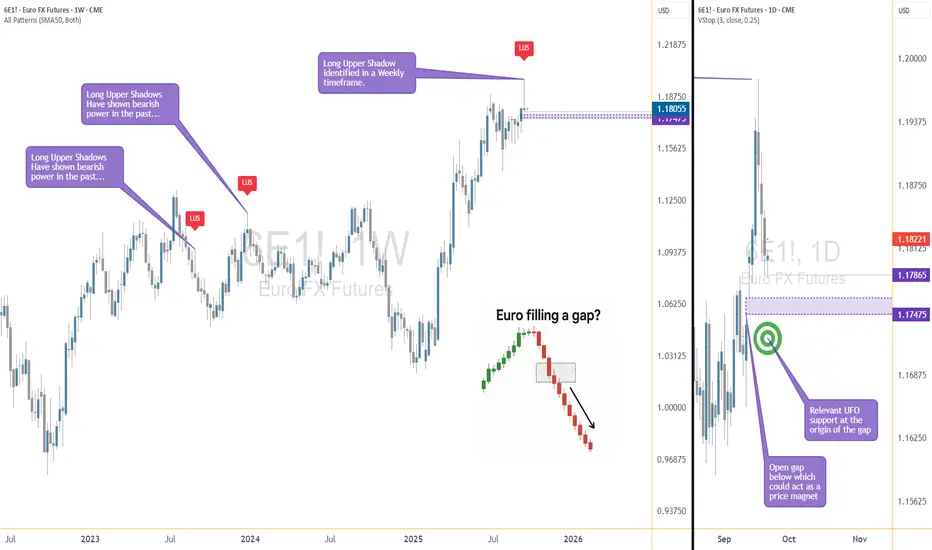
When analyzing futures markets, one of the most compelling signals arises when higher timeframe candlestick rejection aligns with lower timeframe price imbalances. That is exactly what we see in Euro FX Futures (6E, M6E). On the weekly chart, long upper shadows (LUS) have historically marked turning points, reflecting exhaustion of bullish pressure. On the daily chart, an open gap below current price offers a potential magnetic pull. Together, these elements provide a textbook technical case study of how price can align across timeframes.
This article explores the educational insights behind candlestick rejection and gap mechanics, then applies them to a concrete trading scenario in 6E and its micro equivalent, M6E.
Weekly Chart: The Long Upper Shadow (LUS)
Long Upper Shadows appear when a market tests higher levels but fails to sustain them, leaving sellers in control by the close. They are one of the clearest visual expressions of rejection.
In Euro FX Futures, past long upper shadows have preceded significant bearish moves. Each instance reflects an imbalance where buyers were unable to absorb selling pressure at higher prices. The most recent weekly candlestick shows another long upper shadow forming near resistance. For technically minded traders, this is an early warning sign of potential downside ahead.
Daily Chart: The Open Gap Below Price
Price gaps occur when markets open significantly away from the prior session’s close. In futures, gaps often act like magnets—price tends to revisit them over time as liquidity seeks balance.
Currently, Euro FX Futures show an unfilled gap just below the market. Historically, such gaps in 6E have attracted price action, especially when combined with bearish rejection signals from higher timeframes. The combination of a weekly LUS above and a daily gap below paints a picture of imbalance: rejection at the highs, unfinished business at the lows.
Trade Setup
A structured trade idea emerges from this technical alignment:
Risk caveat: Right below the gap origin lies a UFO support area. This means price may stall or reverse after the gap is filled. Being conservative with the target is wise—seeking deeper downside could run into structural support.
Contract Specs and Margin Notes
Understanding the contract structure is vital when applying risk management.
o Euro FX Futures (6E):
o Micro EUR/USD Futures (M6E):
Application: Traders with smaller accounts can use M6E to size positions more precisely, while larger participants may choose 6E for liquidity. Micros provide flexibility to scale in/out of trades while maintaining strict risk per trade.
Risk Management Essentials
Risk management is not about avoiding losses—it is about ensuring that any loss remains controlled relative to potential reward. This trade idea highlights three core principles:
Educational Takeaway
This setup demonstrates the power of multi-timeframe confluence. A weekly rejection signal provides context, while a daily gap gives tactical direction. Traders often gain an edge when higher timeframe sentiment (bearish rejection) aligns with lower timeframe imbalances (gap fill).
For students of price action, this is a reminder that candlestick patterns should never be taken in isolation. Instead, they should be validated by market structure, liquidity imbalances, or other confirming signals.
Conclusion
Euro FX Futures present a case study in how weekly rejection and daily gaps can combine to create a structured opportunity. While no outcome is certain, the confluence of signals here underscores the educational value of analyzing shadows and gaps together.
Traders can study this setup not only as a potential trade but also as a lesson in disciplined multi-timeframe analysis.
When charting futures, the data provided could be delayed. Traders working with the ticker symbols discussed in this idea may prefer to use CME Group real-time data plan on TradingView: tradingview.com/cme/ - This consideration is particularly important for shorter-term traders, whereas it may be less critical for those focused on longer-term trading strategies.
General Disclaimer:
The trade ideas presented herein are solely for illustrative purposes forming a part of a case study intended to demonstrate key principles in risk management within the context of the specific market scenarios discussed. These ideas are not to be interpreted as investment recommendations or financial advice. They do not endorse or promote any specific trading strategies, financial products, or services. The information provided is based on data believed to be reliable; however, its accuracy or completeness cannot be guaranteed. Trading in financial markets involves risks, including the potential loss of principal. Each individual should conduct their own research and consult with professional financial advisors before making any investment decisions. The author or publisher of this content bears no responsibility for any actions taken based on the information provided or for any resultant financial or other losses.
When analyzing futures markets, one of the most compelling signals arises when higher timeframe candlestick rejection aligns with lower timeframe price imbalances. That is exactly what we see in Euro FX Futures (6E, M6E). On the weekly chart, long upper shadows (LUS) have historically marked turning points, reflecting exhaustion of bullish pressure. On the daily chart, an open gap below current price offers a potential magnetic pull. Together, these elements provide a textbook technical case study of how price can align across timeframes.
This article explores the educational insights behind candlestick rejection and gap mechanics, then applies them to a concrete trading scenario in 6E and its micro equivalent, M6E.
Weekly Chart: The Long Upper Shadow (LUS)
Long Upper Shadows appear when a market tests higher levels but fails to sustain them, leaving sellers in control by the close. They are one of the clearest visual expressions of rejection.
In Euro FX Futures, past long upper shadows have preceded significant bearish moves. Each instance reflects an imbalance where buyers were unable to absorb selling pressure at higher prices. The most recent weekly candlestick shows another long upper shadow forming near resistance. For technically minded traders, this is an early warning sign of potential downside ahead.
Daily Chart: The Open Gap Below Price
Price gaps occur when markets open significantly away from the prior session’s close. In futures, gaps often act like magnets—price tends to revisit them over time as liquidity seeks balance.
Currently, Euro FX Futures show an unfilled gap just below the market. Historically, such gaps in 6E have attracted price action, especially when combined with bearish rejection signals from higher timeframes. The combination of a weekly LUS above and a daily gap below paints a picture of imbalance: rejection at the highs, unfinished business at the lows.
Trade Setup
A structured trade idea emerges from this technical alignment:
- Entry condition: Short position if 6E breaks below the prior day’s low at 1.17865. This ensures price is moving in line with bearish continuation before entry.
- Target: 1.17475, the origin of the open gap. This is where the “magnet effect” is expected to complete.
- Stop-loss: 1.18090, derived from a 2-day ATR calculation and adjusted to 25%. This keeps risk tight but accounts for minor noise.
- Reward-to-Risk Ratio: With entry near 1.17865, risk is around 22 ticks while potential reward is about 39 ticks, yielding a favorable R:R of almost 2:1.
Risk caveat: Right below the gap origin lies a UFO support area. This means price may stall or reverse after the gap is filled. Being conservative with the target is wise—seeking deeper downside could run into structural support.
Contract Specs and Margin Notes
Understanding the contract structure is vital when applying risk management.
o Euro FX Futures (6E):
- Contract size = €125,000
- Tick size = 0.00005 USD per euro = $6.25 per tick
- Initial margin (approximate, varies daily): ~$2,500–$3,000
o Micro EUR/USD Futures (M6E):
- Contract size = €12,500 (1/10th of 6E)
- Tick size = 0.0001 USD per euro = $1.25 per tick
- Initial margin (approximate, varies daily): ~$300–$400
Application: Traders with smaller accounts can use M6E to size positions more precisely, while larger participants may choose 6E for liquidity. Micros provide flexibility to scale in/out of trades while maintaining strict risk per trade.
Risk Management Essentials
Risk management is not about avoiding losses—it is about ensuring that any loss remains controlled relative to potential reward. This trade idea highlights three core principles:
- Stop placement by ATR: Volatility-based stops adjust naturally to current market conditions. Using 25% of a 2-day ATR prevents overexposure while respecting noise.
- Position sizing: Traders should calculate how many contracts (6E or M6E) align with their personal risk tolerance.
- Target discipline: While tempting to aim lower than the gap origin, technical evidence suggests price may encounter support there. Conservative targeting avoids overstaying a move.
Educational Takeaway
This setup demonstrates the power of multi-timeframe confluence. A weekly rejection signal provides context, while a daily gap gives tactical direction. Traders often gain an edge when higher timeframe sentiment (bearish rejection) aligns with lower timeframe imbalances (gap fill).
For students of price action, this is a reminder that candlestick patterns should never be taken in isolation. Instead, they should be validated by market structure, liquidity imbalances, or other confirming signals.
Conclusion
Euro FX Futures present a case study in how weekly rejection and daily gaps can combine to create a structured opportunity. While no outcome is certain, the confluence of signals here underscores the educational value of analyzing shadows and gaps together.
Traders can study this setup not only as a potential trade but also as a lesson in disciplined multi-timeframe analysis.
When charting futures, the data provided could be delayed. Traders working with the ticker symbols discussed in this idea may prefer to use CME Group real-time data plan on TradingView: tradingview.com/cme/ - This consideration is particularly important for shorter-term traders, whereas it may be less critical for those focused on longer-term trading strategies.
General Disclaimer:
The trade ideas presented herein are solely for illustrative purposes forming a part of a case study intended to demonstrate key principles in risk management within the context of the specific market scenarios discussed. These ideas are not to be interpreted as investment recommendations or financial advice. They do not endorse or promote any specific trading strategies, financial products, or services. The information provided is based on data believed to be reliable; however, its accuracy or completeness cannot be guaranteed. Trading in financial markets involves risks, including the potential loss of principal. Each individual should conduct their own research and consult with professional financial advisors before making any investment decisions. The author or publisher of this content bears no responsibility for any actions taken based on the information provided or for any resultant financial or other losses.
🌟 Take This Analysis Further with Our AI Scripts 🎯 | Discover How at tradewithufos.com 🚀 Choose a Subscription: Monthly ᴼᴿ Yearly ᴼᴿ Lifetime 🗓️ | Unlock Intelligent UFO Scripts Free 💡
Penerbitan berkaitan
Penafian
Maklumat dan penerbitan adalah tidak dimaksudkan untuk menjadi, dan tidak membentuk, nasihat untuk kewangan, pelaburan, perdagangan dan jenis-jenis lain atau cadangan yang dibekalkan atau disahkan oleh TradingView. Baca dengan lebih lanjut di Terma Penggunaan.