Smart Money Concepts (SMC) — especially demand zones, Fair Value Gaps (FVG), and market structure.
📊 1. Market Structure
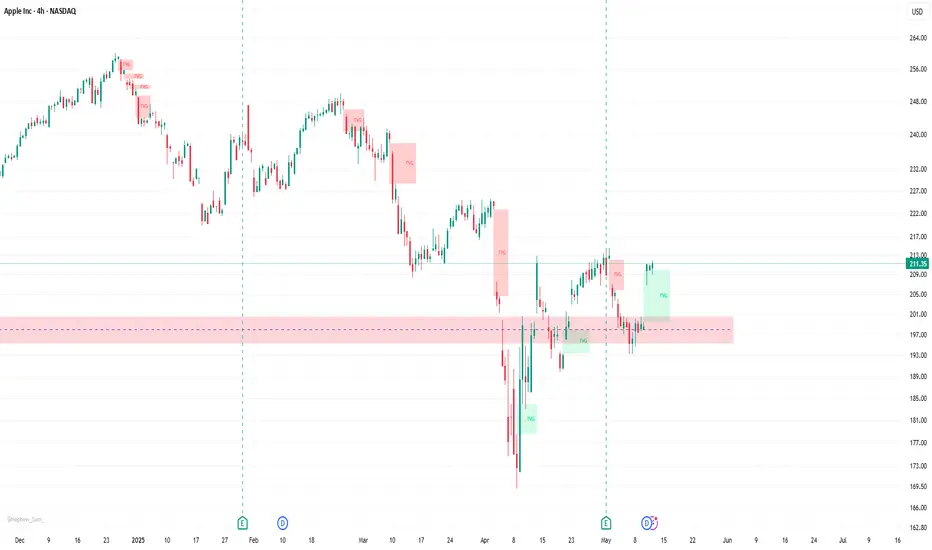
The chart shows a shift toward bullish structure after a significant downtrend earlier.
Price formed a higher low inside a strong demand zone (highlighted in pink), suggesting potential trend reversal.
The recent bullish impulse suggests a possible break of structure (BOS) or change of character (CHoCH).
🟩 2. Demand Zone
A major demand zone is highlighted in pink (around $197–$201).
Price reacted strongly from this zone, where multiple buy orders were triggered:
Buy 100 @ 211.36
Buy 100 @ 211.35
Buy 100 @ 211.30
Buy 100 @ 211.32
This zone likely represents institutional interest or an area of accumulation by smart money.
📐 3. Fair Value Gaps (FVG)
Several FVGs (imbalances) are marked on the chart:
Bearish FVGs formed during previous sell-offs (marked in red).
A recent bullish FVG (marked in green) has just formed and partially filled, indicating momentum continuation.
These gaps act as potential support/resistance levels and often attract price action to rebalance inefficiencies.
🎯 4. Targets & Risk Management
Take-Profit (TP) target: $249.07
This level is a previous high and likely premium zone based on SMC theory — where smart money exits.
Stop-Loss (SL): $192.98
Below the demand zone — reasonable invalidation point if price breaks structure and goes lower.
⚖️ 5. Risk-to-Reward Ratio (RRR)
Entry around $211.30 – $211.36
SL around $192.98 → ~18 points risk
TP at $249.07 → ~38 points reward
Risk-to-Reward ≈ 2.1:1 → This is a favorable RRR setup.
🔍 Conclusion
Current Bias: Bullish
Entry Justification: Strong reaction from demand zone + buy orders aligned with FVG
Outlook: Price may aim to fill higher imbalance and reach the premium target zone (~$249), as long as it holds above the demand zone
Invalidation: A break below $192.98 would invalidate the bullish setup
📊 1. Market Structure
The chart shows a shift toward bullish structure after a significant downtrend earlier.
Price formed a higher low inside a strong demand zone (highlighted in pink), suggesting potential trend reversal.
The recent bullish impulse suggests a possible break of structure (BOS) or change of character (CHoCH).
🟩 2. Demand Zone
A major demand zone is highlighted in pink (around $197–$201).
Price reacted strongly from this zone, where multiple buy orders were triggered:
Buy 100 @ 211.36
Buy 100 @ 211.35
Buy 100 @ 211.30
Buy 100 @ 211.32
This zone likely represents institutional interest or an area of accumulation by smart money.
📐 3. Fair Value Gaps (FVG)
Several FVGs (imbalances) are marked on the chart:
Bearish FVGs formed during previous sell-offs (marked in red).
A recent bullish FVG (marked in green) has just formed and partially filled, indicating momentum continuation.
These gaps act as potential support/resistance levels and often attract price action to rebalance inefficiencies.
🎯 4. Targets & Risk Management
Take-Profit (TP) target: $249.07
This level is a previous high and likely premium zone based on SMC theory — where smart money exits.
Stop-Loss (SL): $192.98
Below the demand zone — reasonable invalidation point if price breaks structure and goes lower.
⚖️ 5. Risk-to-Reward Ratio (RRR)
Entry around $211.30 – $211.36
SL around $192.98 → ~18 points risk
TP at $249.07 → ~38 points reward
Risk-to-Reward ≈ 2.1:1 → This is a favorable RRR setup.
🔍 Conclusion
Current Bias: Bullish
Entry Justification: Strong reaction from demand zone + buy orders aligned with FVG
Outlook: Price may aim to fill higher imbalance and reach the premium target zone (~$249), as long as it holds above the demand zone
Invalidation: A break below $192.98 would invalidate the bullish setup
Penafian
Maklumat dan penerbitan adalah tidak dimaksudkan untuk menjadi, dan tidak membentuk, nasihat untuk kewangan, pelaburan, perdagangan dan jenis-jenis lain atau cadangan yang dibekalkan atau disahkan oleh TradingView. Baca dengan lebih lanjut di Terma Penggunaan.
Penafian
Maklumat dan penerbitan adalah tidak dimaksudkan untuk menjadi, dan tidak membentuk, nasihat untuk kewangan, pelaburan, perdagangan dan jenis-jenis lain atau cadangan yang dibekalkan atau disahkan oleh TradingView. Baca dengan lebih lanjut di Terma Penggunaan.