🍎 AAPL Weekly Chart Analysis — Bearish Outlook
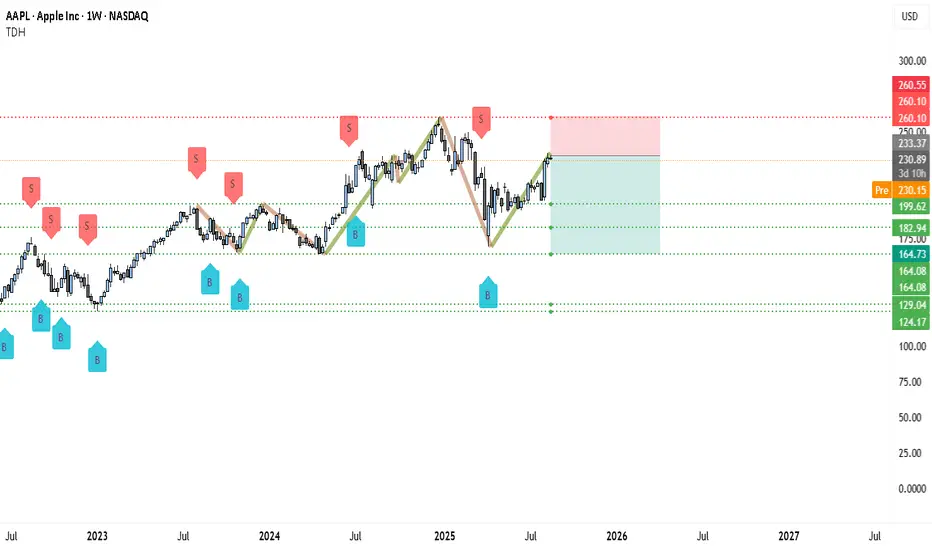
Apple (AAPL) is trading near $230–233 on the weekly chart after staging a rebound from early 2025 lows. The chart, however, shows a clear double-top pattern around the $260.10–260.55 resistance zone (red dashed line), which has repeatedly acted as a ceiling. Each test of this zone has been followed by sharp corrections, and the most recent “S” (sell) marker confirms this rejection area as a strong supply zone.
The latest rally has brought price back toward resistance, but structure-wise AAPL is printing lower highs and lower lows since mid-2024. The bounce into $230–233 looks more like a relief rally within a larger corrective phase rather than a fresh bullish trend.
________________________________________
🔎 Bearish Justifications
• Double/Triple Resistance Layer: $260 has capped price multiple times. Without a clear weekly close above it, bears remain in control.
• Trend Structure: From July 2024 peak to early 2025 lows, price made a decisive lower low. The current rally has failed to reclaim that structure.
• Volume Trap: Weekly candles show waning momentum on rallies—less aggressive buying versus prior uptrends.
• Clean Downside Ladder: The chart highlights green dotted support zones at $199 → $182 → $164 → $129 → $124. If $230–233 fails to hold, price could unwind quickly toward these levels.
________________________________________
🔴 AAPL Short Setup (Weekly Chart)
• Entry Zone: $230–233 rejection area (current price)
• Stop-Loss: Above $260.55 (strong invalidation level, beyond supply zone) ❌
• Target 1: $199 (psychological + technical support, book partial profits ✅)
• Target 2: $182.94 (major mid-term support, lock more gains 🔒)
• Target 3: $164.73 (deeper corrective target if selling accelerates 📉)
• Stretch Target: $129–124 if broader market weakness hits tech
________________________________________
⚠️ Risk & Trade Management
Given that this is a weekly timeframe setup, swings will be larg6e and volatile. Position sizing should be smaller than usual because stops and targets are wide. Booking partial profits at $199 and $182 is essential — this way, you reduce risk exposure and can let the remainder run. If AAPL surprisingly pushes above $260 and closes strong, the bearish thesis is invalid and shorts should exit rather than hold against trend.
✅ In summary, AAPL looks heavy under $260, with the current bounce likely a retracement rally rather than fresh bullish strength. Unless bulls can flip $260 into support, the chart favors a short bias with targets at $199 → $182 → $164.
Trade forex, indices, stocks and metals with up to US$100.000 in company's funding.
Complete a challenge to access funding or go for instant deposit.
Trading involves substantial risk. Not financial advice
Complete a challenge to access funding or go for instant deposit.
Trading involves substantial risk. Not financial advice
Penerbitan berkaitan
Penafian
Maklumat dan penerbitan adalah tidak dimaksudkan untuk menjadi, dan tidak membentuk, nasihat untuk kewangan, pelaburan, perdagangan dan jenis-jenis lain atau cadangan yang dibekalkan atau disahkan oleh TradingView. Baca dengan lebih lanjut di Terma Penggunaan.