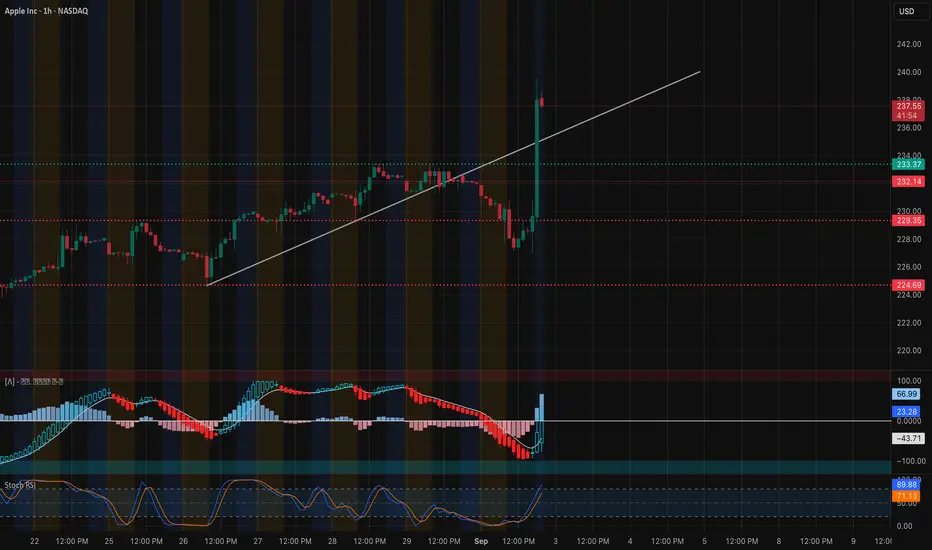
Apple exploded higher off the 227.5 – 228 support zone, staging a sharp rally that broke through short-term resistance and reclaimed momentum. The move was confirmed by a strong MACD bullish cross with expanding histogram, and Stoch RSI pushing deep into overbought, signaling strong momentum but also potential near-term exhaustion.
Price is now pressing into 237–238, a heavy resistance cluster from both prior supply and options positioning. This zone represents the immediate test for bulls. A clean breakout would open the path toward 240, and potentially 242.5, where the next resistance bands align.
On the downside, 232.5 – 233 is now first support. Below that, 230 and then 227.5 serve as key demand levels. Losing those would negate today’s breakout momentum and shift control back to sellers.
🔍 Options / GEX Confirmation

* Resistance:
* 237 (20% GEX concentration) → current rejection zone.
* 240 – 242.5 → stacked resistance confirmed by call positioning.
* Support:
* 233 – 232.5 (3rd call wall / structural support) → bulls must defend this to keep momentum.
* 230 → strong pivot zone.
* 227.5 → deep support and base of the breakout.
Options flow confirms exactly what the chart is showing: 237 is a key battleground, while 240–242.5 remains the ceiling until bulls prove control.
🎯 Trade Scenarios
* Bullish: Hold above 233 and break through 237 with volume → targets 240, then 242.5.
* Bearish: Failure at 237 and a drop back under 233 → downside targets 230 → 227.5.
Apple’s rebound was explosive, but the 237–238 zone is the real test. If buyers can push through, upside momentum extends toward 240–242.5. If not, watch for a pullback to 233 or even 230 before attempting higher.
Price is now pressing into 237–238, a heavy resistance cluster from both prior supply and options positioning. This zone represents the immediate test for bulls. A clean breakout would open the path toward 240, and potentially 242.5, where the next resistance bands align.
On the downside, 232.5 – 233 is now first support. Below that, 230 and then 227.5 serve as key demand levels. Losing those would negate today’s breakout momentum and shift control back to sellers.
🔍 Options / GEX Confirmation
* Resistance:
* 237 (20% GEX concentration) → current rejection zone.
* 240 – 242.5 → stacked resistance confirmed by call positioning.
* Support:
* 233 – 232.5 (3rd call wall / structural support) → bulls must defend this to keep momentum.
* 230 → strong pivot zone.
* 227.5 → deep support and base of the breakout.
Options flow confirms exactly what the chart is showing: 237 is a key battleground, while 240–242.5 remains the ceiling until bulls prove control.
🎯 Trade Scenarios
* Bullish: Hold above 233 and break through 237 with volume → targets 240, then 242.5.
* Bearish: Failure at 237 and a drop back under 233 → downside targets 230 → 227.5.
Apple’s rebound was explosive, but the 237–238 zone is the real test. If buyers can push through, upside momentum extends toward 240–242.5. If not, watch for a pullback to 233 or even 230 before attempting higher.
Penafian
The information and publications are not meant to be, and do not constitute, financial, investment, trading, or other types of advice or recommendations supplied or endorsed by TradingView. Read more in the Terms of Use.
Penafian
The information and publications are not meant to be, and do not constitute, financial, investment, trading, or other types of advice or recommendations supplied or endorsed by TradingView. Read more in the Terms of Use.