Hello everyone, I’m Cryptorphic.
For the past seven years, I’ve been sharing insightful charts and analysis.
Follow me for:
~ Unbiased analyses on trending altcoins.
~ Identifying altcoins with 10x-50x potential.
~ Futures trade setups.
~ Daily updates on Bitcoin and Ethereum.
~ High time frame (HTF) market bottom and top calls.
~ Short-term market movements.
~ Charts supported by critical fundamentals.
Now, let’s dive into this chart analysis:
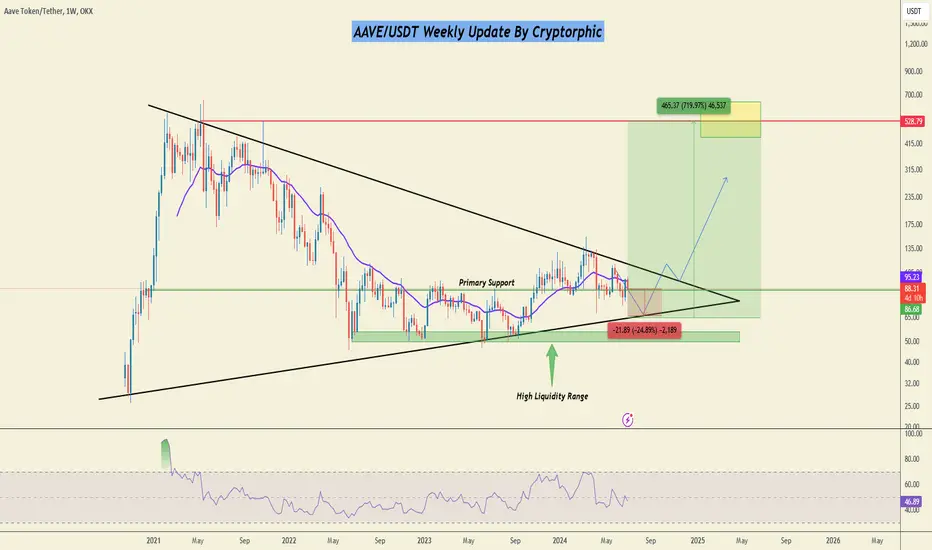
The AAVE/USDT weekly chart depicts a descending triangle pattern, which is typically a bearish continuation pattern. The current price is trading below the moving average, indicating a bearish trend. The RSI is neutral to slightly bearish.
If the price breaks below the horizontal support, a further decline to $65 could be anticipated. Conversely, a breakout above the downtrend resistance line could see the price targeting $530, representing a substantial potential upside in the upcoming bull run.
Key Observation:
~ Primary Support: $80 to $88.
~ Lower Support/Entry: $65.
~ High Liquidity Range: $50 to $55.
~ Resistance: $100.
~ Possible Rally: $240, $335, $412, $530.
DYOR. NFA.
Please hit the like button to support my content and share your thoughts in the comment section. Feel free to request any chart analysis you’d like to see!
Thank you!
#PEACE
For the past seven years, I’ve been sharing insightful charts and analysis.
Follow me for:
~ Unbiased analyses on trending altcoins.
~ Identifying altcoins with 10x-50x potential.
~ Futures trade setups.
~ Daily updates on Bitcoin and Ethereum.
~ High time frame (HTF) market bottom and top calls.
~ Short-term market movements.
~ Charts supported by critical fundamentals.
Now, let’s dive into this chart analysis:
The AAVE/USDT weekly chart depicts a descending triangle pattern, which is typically a bearish continuation pattern. The current price is trading below the moving average, indicating a bearish trend. The RSI is neutral to slightly bearish.
If the price breaks below the horizontal support, a further decline to $65 could be anticipated. Conversely, a breakout above the downtrend resistance line could see the price targeting $530, representing a substantial potential upside in the upcoming bull run.
Key Observation:
~ Primary Support: $80 to $88.
~ Lower Support/Entry: $65.
~ High Liquidity Range: $50 to $55.
~ Resistance: $100.
~ Possible Rally: $240, $335, $412, $530.
DYOR. NFA.
Please hit the like button to support my content and share your thoughts in the comment section. Feel free to request any chart analysis you’d like to see!
Thank you!
#PEACE
Daily Signals:- telegram.me/thecryptorphic
Best Exchange BITUNIX: bit.ly/JoinCryptorphic
BLOFIN - bit.ly/Cryptorphic
Binance: bit.ly/cryptorphic1000
ELITES: bit.ly/Join_elite
Best Exchange BITUNIX: bit.ly/JoinCryptorphic
BLOFIN - bit.ly/Cryptorphic
Binance: bit.ly/cryptorphic1000
ELITES: bit.ly/Join_elite
Penerbitan berkaitan
Penafian
Maklumat dan penerbitan adalah tidak dimaksudkan untuk menjadi, dan tidak membentuk, nasihat untuk kewangan, pelaburan, perdagangan dan jenis-jenis lain atau cadangan yang dibekalkan atau disahkan oleh TradingView. Baca dengan lebih lanjut di Terma Penggunaan.