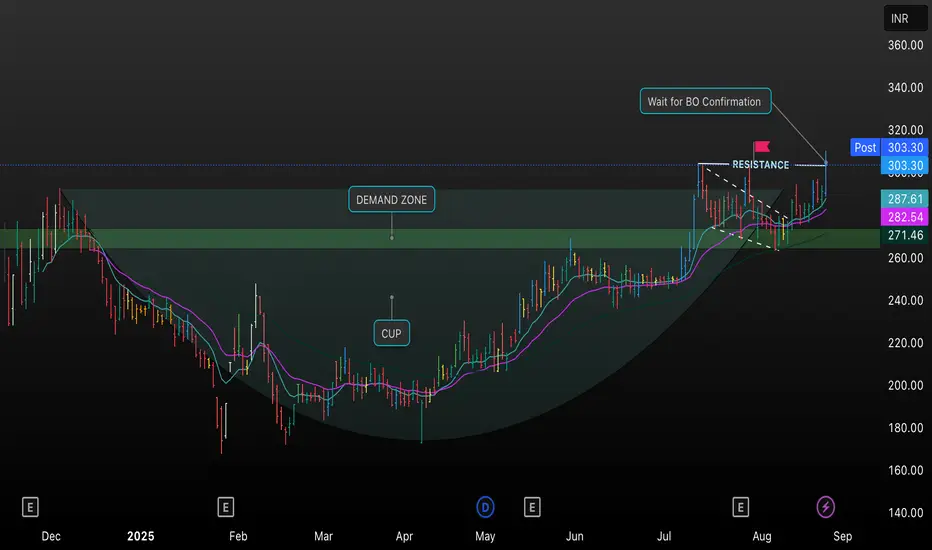
This TradingView chart analyzes ACME Solar, highlighting a classic Cup & Handle pattern forming since early 2025, with price action consolidating in a defined demand zone before recently breaking through resistance around INR 303.30.
Key elements include buying interest at support levels, the emergence of bullish momentum, and a breakout trigger that traders should confirm before entry. The setup suggests a potential trend reversal, with EMA overlays supporting the upward move while resistance acts as the next critical decision level.
Traders are advised to watch for sustained volume and closing above resistance for reliable breakout confirmation, as indicated on the chart.
Dagangan aktif
Out of tightness VCPPenafian
Maklumat dan penerbitan adalah tidak dimaksudkan untuk menjadi, dan tidak membentuk, nasihat untuk kewangan, pelaburan, perdagangan dan jenis-jenis lain atau cadangan yang dibekalkan atau disahkan oleh TradingView. Baca dengan lebih lanjut di Terma Penggunaan.
Penafian
Maklumat dan penerbitan adalah tidak dimaksudkan untuk menjadi, dan tidak membentuk, nasihat untuk kewangan, pelaburan, perdagangan dan jenis-jenis lain atau cadangan yang dibekalkan atau disahkan oleh TradingView. Baca dengan lebih lanjut di Terma Penggunaan.