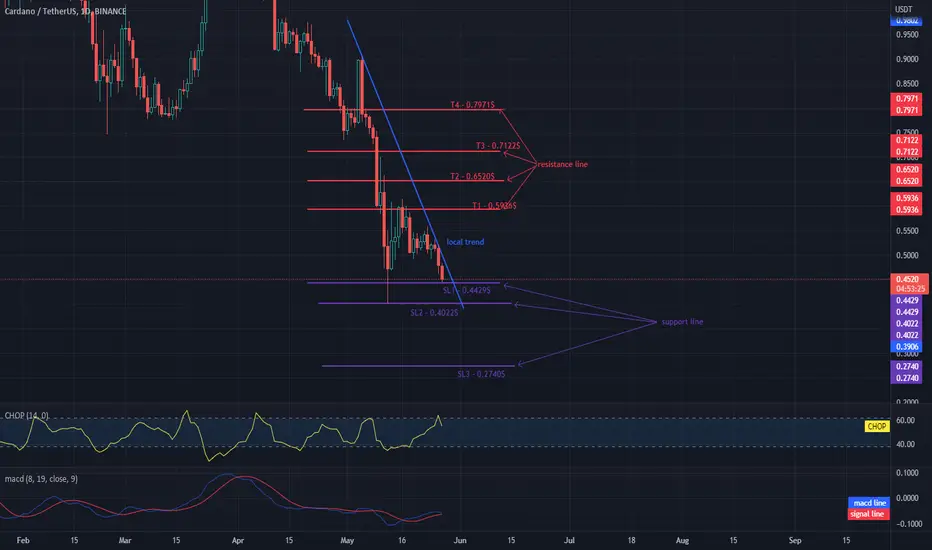
Hello everyone, let's take a look at the ADA to USDT chart on a 1 day time frame. As you can see, the price is moving below the local downtrend line.
Let's start with the designation of the support line and as you can see the first support in the near future is SL1 - $ 0.4429 which is currently in price, if the support breaks, the next one is SL2 - $ 0.4022 and SL3 - $ 0.2740.
Now let's move from the resistance line, as you can see, the first resistance is T1 - $ 0.5936, if you manage to break it, the next ones will be T2 - $ 0.6520 and T3 - $ 0.7122 and T4 - $ 0.7971.
Looking at the CHOP indicator, we can see that in the 1-day interval some energy has been used to reduce the price, but we still have a lot of energy that can be used in the coming days.
Penafian
Maklumat dan penerbitan adalah tidak bertujuan, dan tidak membentuk, nasihat atau cadangan kewangan, pelaburan, dagangan atau jenis lain yang diberikan atau disahkan oleh TradingView. Baca lebih dalam Terma Penggunaan.
Penafian
Maklumat dan penerbitan adalah tidak bertujuan, dan tidak membentuk, nasihat atau cadangan kewangan, pelaburan, dagangan atau jenis lain yang diberikan atau disahkan oleh TradingView. Baca lebih dalam Terma Penggunaan.