🚀 **ADA/USDT Weekly Analysis – Ready for Takeoff?** 📈
🔹 **📊 Long-Term Uptrend in Play**
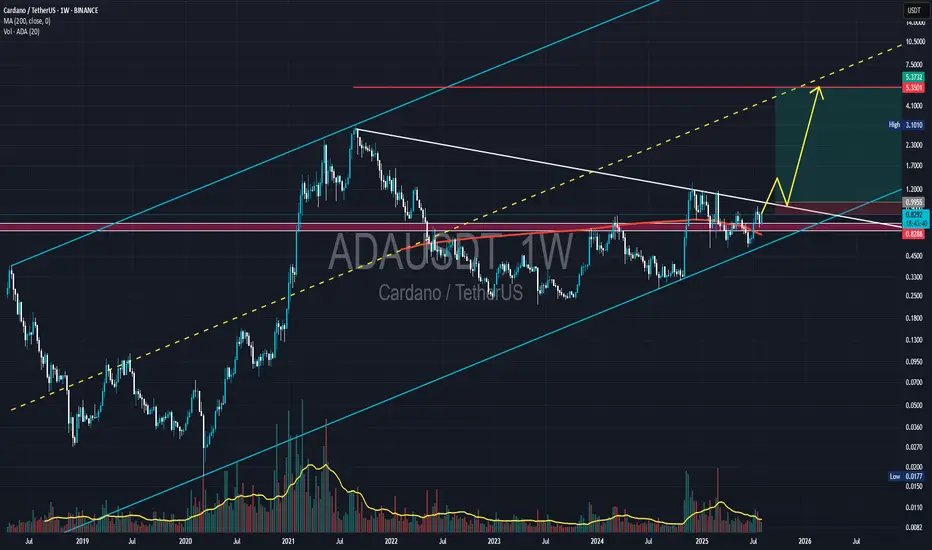
Cardano (ADA) has been respecting a long-term ascending channel since 2018. The structure suggests steady bullish momentum over the years.
🔹 **🔐 Key Levels to Watch**
- 🛡️ **Support:** $0.8288
- 🧱 **Resistance (ATH):** $3.1010
These levels are crucial. A breakout above resistance could ignite a powerful rally.
🔹 **⚔️ Trendline Battle Zone**
Price is approaching a key confluence:
- 🔻 Descending white trendline
- 🔺 Ascending yellow trendline
This intersection could act as a launchpad for the next move.
🔹 **📏 200-Week MA Reclaimed**
ADA is trading above the 200-week moving average (**$0.6159**), a bullish sign indicating strength and potential continuation.
🔹 **📊 Volume Surge**
Recent volume spikes above the average (yellow line) show growing interest and accumulation. Smart money might be positioning early.
🔹 **📈 Bullish Scenario**
If ADA holds above $0.8288, the path toward the all-time high at $3.1010 becomes technically viable.
🟡 The yellow arrow on the chart outlines this potential move.
---
📌 **Summary:**
ADA is at a technical crossroads. A breakout above the confluence zone and sustained strength above the 200-week MA could lead to a medium- to long-term bullish rally.
👀 Watch volume and price action closely around $0.8288.
📍 *This post is for educational purposes only – not financial advice.*
🔹 **📊 Long-Term Uptrend in Play**
Cardano (ADA) has been respecting a long-term ascending channel since 2018. The structure suggests steady bullish momentum over the years.
🔹 **🔐 Key Levels to Watch**
- 🛡️ **Support:** $0.8288
- 🧱 **Resistance (ATH):** $3.1010
These levels are crucial. A breakout above resistance could ignite a powerful rally.
🔹 **⚔️ Trendline Battle Zone**
Price is approaching a key confluence:
- 🔻 Descending white trendline
- 🔺 Ascending yellow trendline
This intersection could act as a launchpad for the next move.
🔹 **📏 200-Week MA Reclaimed**
ADA is trading above the 200-week moving average (**$0.6159**), a bullish sign indicating strength and potential continuation.
🔹 **📊 Volume Surge**
Recent volume spikes above the average (yellow line) show growing interest and accumulation. Smart money might be positioning early.
🔹 **📈 Bullish Scenario**
If ADA holds above $0.8288, the path toward the all-time high at $3.1010 becomes technically viable.
🟡 The yellow arrow on the chart outlines this potential move.
---
📌 **Summary:**
ADA is at a technical crossroads. A breakout above the confluence zone and sustained strength above the 200-week MA could lead to a medium- to long-term bullish rally.
👀 Watch volume and price action closely around $0.8288.
📍 *This post is for educational purposes only – not financial advice.*
Penafian
Maklumat dan penerbitan adalah tidak dimaksudkan untuk menjadi, dan tidak membentuk, nasihat untuk kewangan, pelaburan, perdagangan dan jenis-jenis lain atau cadangan yang dibekalkan atau disahkan oleh TradingView. Baca dengan lebih lanjut di Terma Penggunaan.
Penafian
Maklumat dan penerbitan adalah tidak dimaksudkan untuk menjadi, dan tidak membentuk, nasihat untuk kewangan, pelaburan, perdagangan dan jenis-jenis lain atau cadangan yang dibekalkan atau disahkan oleh TradingView. Baca dengan lebih lanjut di Terma Penggunaan.