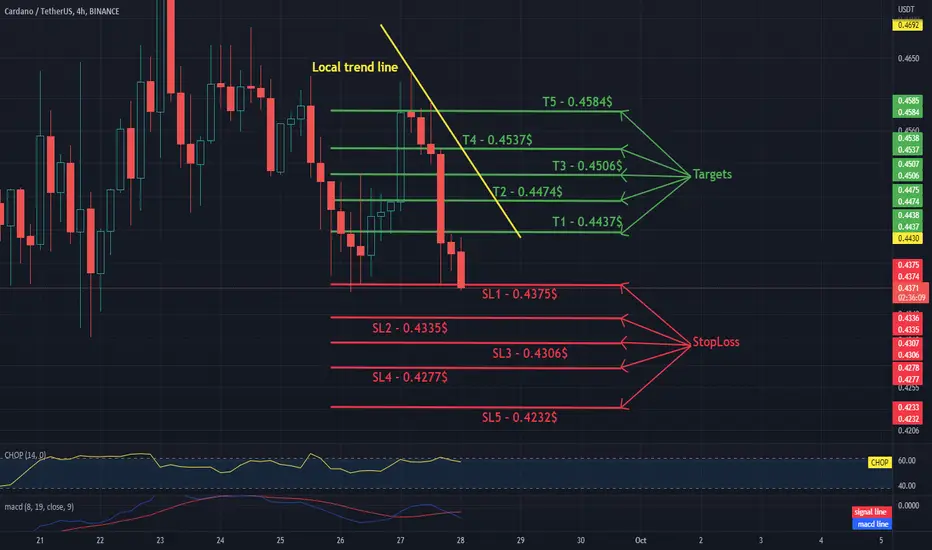
Hello everyone, let's take a look at the 4H ADA to USDT chart as you can see the price is moving below the local downtrend line.
Let's start by setting goals for the near future that we can consider:
T1 - $ 0.4437
T2 - $ 0.4474
T3 - $ 0.4506
T4 - $ 0.4537
and
T5 - $ 0.4584
Now let's move on to the stop loss in case of further market declines:
SL1 - $ 0.4375
SL2 - $ 0.4335
SL3 - $ 0.4306
SL4 - $ 0.4277
and
SL5 - $ 0.4232
Looking at the CHOP indicator, we can see that in the 4H range we have a lot of energy, while the MACD indicator shows a local downward trend.
Penafian
Maklumat dan penerbitan adalah tidak dimaksudkan untuk menjadi, dan tidak membentuk, nasihat untuk kewangan, pelaburan, perdagangan dan jenis-jenis lain atau cadangan yang dibekalkan atau disahkan oleh TradingView. Baca dengan lebih lanjut di Terma Penggunaan.
Penafian
Maklumat dan penerbitan adalah tidak dimaksudkan untuk menjadi, dan tidak membentuk, nasihat untuk kewangan, pelaburan, perdagangan dan jenis-jenis lain atau cadangan yang dibekalkan atau disahkan oleh TradingView. Baca dengan lebih lanjut di Terma Penggunaan.