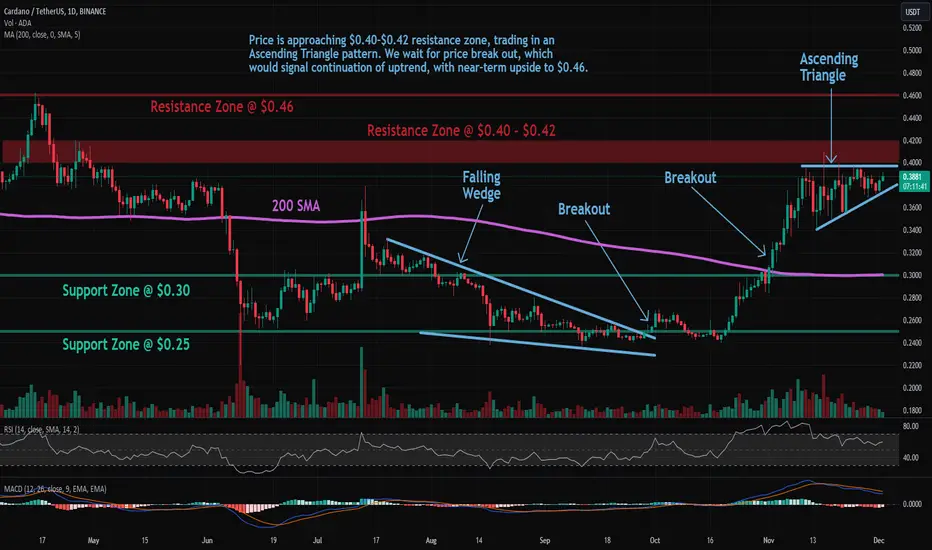
Trade setup: Price is approaching $0.40-$0.42 resistance zone, trading in an Ascending Triangle pattern. We wait for price break out, which would signal continuation of uptrend, with near-term upside to $0.46. Previously, price broke above 200-day moving average ($0.30), which confirmed a bullish trend reversal to an Uptrend.
Pattern: Ascending Triangle which is a continuation pattern (it typically breaks out in the direction of existing trend). Most traders wait for a breakout but Swing traders could trade between the trendlines (Buy at Support, Sell at Resistance) as long as the trendlines are still relatively far apart.
Trend: Uptrend across all time horizons (Short- Medium- and Long-Term).
Momentum is Mixed as MACD Line is below MACD Signal Line (Bearish) but RSI > 55 (Bullish).
Support and Resistance: Nearest Support Zone is $0.30 (previous resistance), then $0.25. The nearest Resistance Zone is $0.040 - $0.42, then $0.46.
Penafian
Maklumat dan penerbitan adalah tidak dimaksudkan untuk menjadi, dan tidak membentuk, nasihat untuk kewangan, pelaburan, perdagangan dan jenis-jenis lain atau cadangan yang dibekalkan atau disahkan oleh TradingView. Baca dengan lebih lanjut di Terma Penggunaan.
Penafian
Maklumat dan penerbitan adalah tidak dimaksudkan untuk menjadi, dan tidak membentuk, nasihat untuk kewangan, pelaburan, perdagangan dan jenis-jenis lain atau cadangan yang dibekalkan atau disahkan oleh TradingView. Baca dengan lebih lanjut di Terma Penggunaan.