Trade Alert
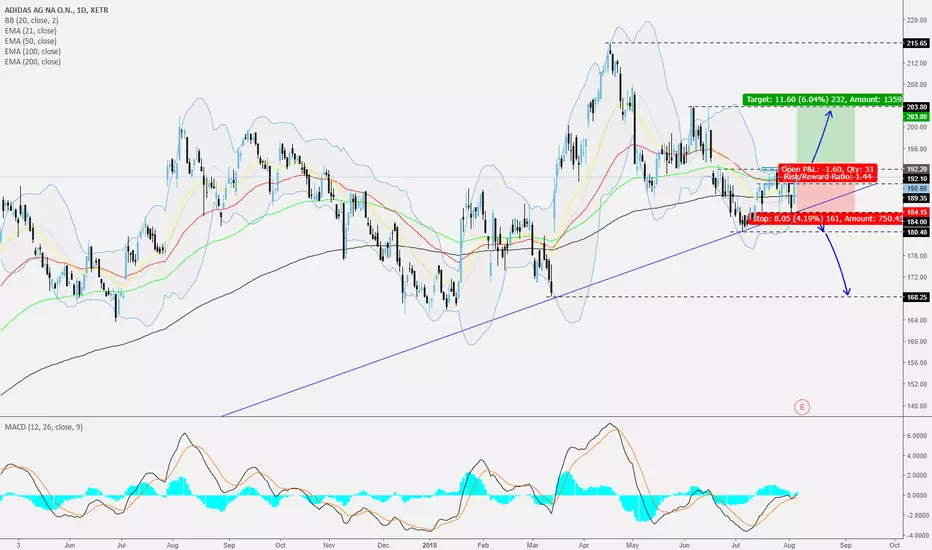
We can see that Adidas recently tested the long-term upwards moving trendline, taken from the lowest point of August 2015, from which it quickly rebounded. Also, the stock is aiming for the 192.10 resistance level, a break of which could set the stage for a potential move higher (Please see the chart for details).
Alternatively, for us to turn bearish on the stock, we would need to see a break and a close below the aforementioned upwards moving trendline. This way we could start targeting lower support levels (Please see the chart for details).
Always have your stop-loss in place.
Penafian
The information and publications are not meant to be, and do not constitute, financial, investment, trading, or other types of advice or recommendations supplied or endorsed by TradingView. Read more in the Terms of Use.
Penafian
The information and publications are not meant to be, and do not constitute, financial, investment, trading, or other types of advice or recommendations supplied or endorsed by TradingView. Read more in the Terms of Use.