🧠 Double Top Breakdown on  AER
AER
Ticker: AerCap Holdings N.V. (AER)
Timeframe: 1D (Daily Chart)
Pattern: Double Top
Strategy: Bearish Reversal
✍️ Analysis
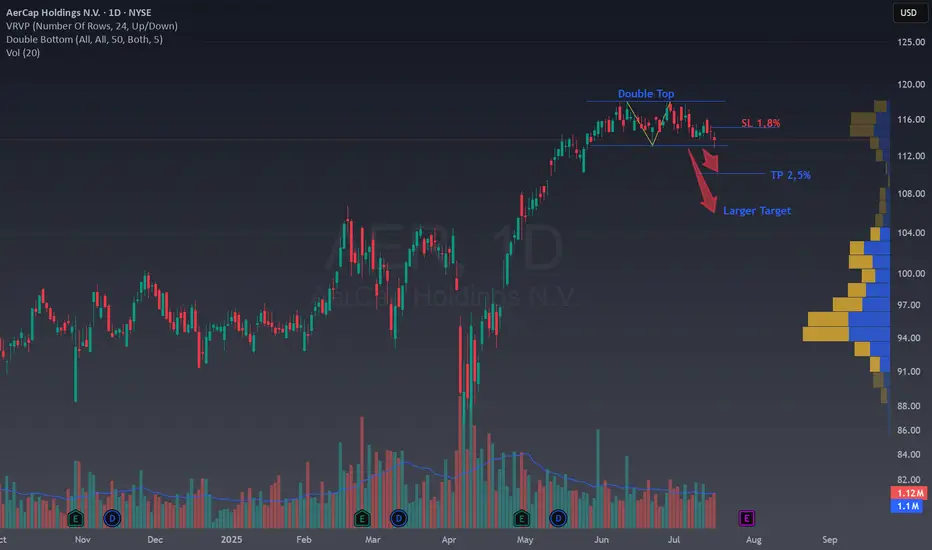
We’ve got a textbook Double Top forming after a strong bullish rally. Price failed to break above the $118 resistance twice, forming the classic M-shape. The neckline is around $113.50, almost broken.
This setup is supported by:
✅ Clean pattern structure
✅ Volume Profile (VPVR) shows a low-volume gap below current price
✅ Good Risk/Reward structure
🎯 Trade Setup
Entry: Below $113.50 (neckline break)
Stop Loss: Above $115.50 (1.8% risk)
Take Profit 1: Around $110 (2.5% target)
Larger TP target: $106 – matches VPVR high-volume node and pattern projection. It's also a Fibo retracement level of 38,2% of the rally.
📘 Educational Notes
This is a great example of how a Double Top can signal the end of a bullish trend (at least temporary) and the start of a pullback or reversal. The volume gap below may accelerate the move. Managing risk with a tight SL and scaling out at TP1 and TP2 is key here.
💬 What do you think? Are you seeing the same setup on your end?
👍 Hit the rocket if you found this useful and follow for more clean technical setups!
Ticker: AerCap Holdings N.V. (AER)
Timeframe: 1D (Daily Chart)
Pattern: Double Top
Strategy: Bearish Reversal
✍️ Analysis
We’ve got a textbook Double Top forming after a strong bullish rally. Price failed to break above the $118 resistance twice, forming the classic M-shape. The neckline is around $113.50, almost broken.
This setup is supported by:
✅ Clean pattern structure
✅ Volume Profile (VPVR) shows a low-volume gap below current price
✅ Good Risk/Reward structure
🎯 Trade Setup
Entry: Below $113.50 (neckline break)
Stop Loss: Above $115.50 (1.8% risk)
Take Profit 1: Around $110 (2.5% target)
Larger TP target: $106 – matches VPVR high-volume node and pattern projection. It's also a Fibo retracement level of 38,2% of the rally.
📘 Educational Notes
This is a great example of how a Double Top can signal the end of a bullish trend (at least temporary) and the start of a pullback or reversal. The volume gap below may accelerate the move. Managing risk with a tight SL and scaling out at TP1 and TP2 is key here.
💬 What do you think? Are you seeing the same setup on your end?
👍 Hit the rocket if you found this useful and follow for more clean technical setups!
Dagangan ditutup: sasaran tercapai
Both targets have been reached in just 2 weeks. A fast decline as expected.⚡ Trading is not about luck or patience. Is about skills and knowledge. ⚡
I share my ideas, returns and knowledge here:
📚 👉 topchartpatterns.substack.com/subscribe 👈📚
🤝 Business contact: info@topchartpatterns.com
I share my ideas, returns and knowledge here:
📚 👉 topchartpatterns.substack.com/subscribe 👈📚
🤝 Business contact: info@topchartpatterns.com
Penafian
Maklumat dan penerbitan adalah tidak bertujuan, dan tidak membentuk, nasihat atau cadangan kewangan, pelaburan, dagangan atau jenis lain yang diberikan atau disahkan oleh TradingView. Baca lebih dalam Terma Penggunaan.
⚡ Trading is not about luck or patience. Is about skills and knowledge. ⚡
I share my ideas, returns and knowledge here:
📚 👉 topchartpatterns.substack.com/subscribe 👈📚
🤝 Business contact: info@topchartpatterns.com
I share my ideas, returns and knowledge here:
📚 👉 topchartpatterns.substack.com/subscribe 👈📚
🤝 Business contact: info@topchartpatterns.com
Penafian
Maklumat dan penerbitan adalah tidak bertujuan, dan tidak membentuk, nasihat atau cadangan kewangan, pelaburan, dagangan atau jenis lain yang diberikan atau disahkan oleh TradingView. Baca lebih dalam Terma Penggunaan.