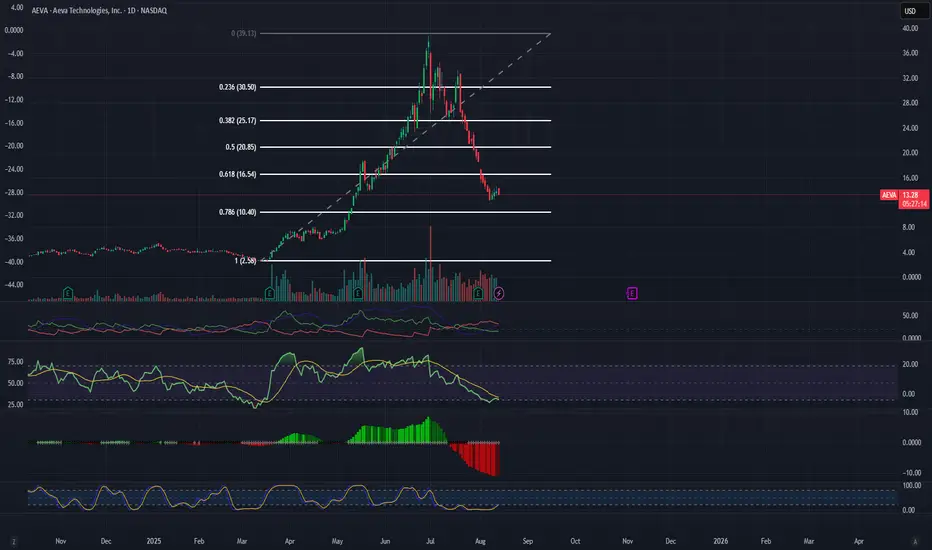
AEVA has experienced a major pullback from its highs, retracing deeply into the Fibonacci levels. On the weekly timeframe, a Cup & Handle structure is forming right at a key reversal zone. Recent price action and indicators suggest that the stock may be ready to change direction and start a new bullish leg.
Technical Highlights:
Pattern: Weekly Cup & Handle emerging after a deep correction.
Fibonacci Levels: Price is currently hovering between the 0.618 ($16.54) and 0.786 ($10.40) retracement zones – historically strong reversal areas.
Indicators:
MACD: Bearish momentum is slowing down, setting up for a potential bullish crossover.
RSI: Recovering from oversold levels, showing early signs of strength.
Stochastic: Turning upwards from the bottom, signaling momentum shift.
ADX: Suggests a weakening downtrend, leaving room for buyers to take control.
Volume: Recent spikes during upward sessions show renewed accumulation interest.
Fundamental Catalyst: Strong earnings report recently released, adding confidence to the technical setup.
Trade Plan:
Entry: Above $14.50 on confirmation of upward momentum.
Target 1: $16.54 (Fib 0.618)
Target 2: $20.85 (Fib 0.5)
Stop Loss: Close below $10.40 (Fib 0.786).
Summary:
AEVA is lining up a high-probability reversal trade: deep Fibonacci retracement, a forming Cup & Handle on the weekly, bullish momentum building, and a strong earnings catalyst. A breakout from current consolidation could ignite a substantial recovery rally.
Penafian
The information and publications are not meant to be, and do not constitute, financial, investment, trading, or other types of advice or recommendations supplied or endorsed by TradingView. Read more in the Terms of Use.
Penafian
The information and publications are not meant to be, and do not constitute, financial, investment, trading, or other types of advice or recommendations supplied or endorsed by TradingView. Read more in the Terms of Use.
