🟢 Consistent Bullish Reaction from Trendline Support
Key Observation:
🔁 Repeating 6-Week Pattern
🔮 Bullish Outlook
📌 Possible Price Projections for Bullish Trend
📈 Conclusion
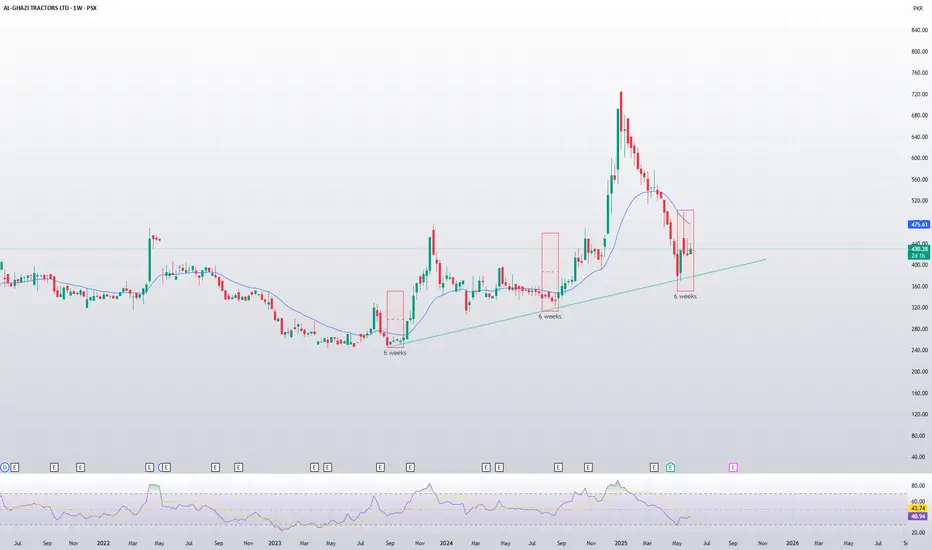
- Trendline Support: Price is respecting a strong ascending trendline that has been tested multiple times since 2023.
Key Observation:
- Each time price touches the trendline, it consolidates for exactly 6 weeks.
- After this 6-week consolidation, AGTL typically enters a strong bullish rally.
🔁 Repeating 6-Week Pattern
- First Zone: October 2023 — 6-week base → breakout rally.
- Second Zone: July 2024 — again 6-week accumulation → bullish trend resumes.
- Current Zone: May 2025 — AGTL touched the trendline again and has completed another 6-week base.
This is the third time this exact behavior is repeating, indicating a strong fractal pattern and high probability of a new uptrend starting soon.
🔮 Bullish Outlook
- If history repeats, AGTL is likely to start rallying soon, potentially leading to a new swing high over the coming weeks/months.
- The 6-week cycle provides a time-based edge to anticipate movement rather than reacting late.
📌 Possible Price Projections for Bullish Trend
These are historically grounded targets based on actual previous price movements following similar trendline+consolidation patterns.
- If AGTL follows the same 6-week base → rally pattern again:
- Short-term target: ~670 PKR (87%)
- Extended bull case: ~1030 PKR (188%)
📈 Conclusion
- AGTL is showing strong technical consistency:
- Each touch of the trendline has led to a 6-week accumulation followed by a bullish breakout.
Penafian
Maklumat dan penerbitan adalah tidak dimaksudkan untuk menjadi, dan tidak membentuk, nasihat untuk kewangan, pelaburan, perdagangan dan jenis-jenis lain atau cadangan yang dibekalkan atau disahkan oleh TradingView. Baca dengan lebih lanjut di Terma Penggunaan.
Penafian
Maklumat dan penerbitan adalah tidak dimaksudkan untuk menjadi, dan tidak membentuk, nasihat untuk kewangan, pelaburan, perdagangan dan jenis-jenis lain atau cadangan yang dibekalkan atau disahkan oleh TradingView. Baca dengan lebih lanjut di Terma Penggunaan.