05-JUL
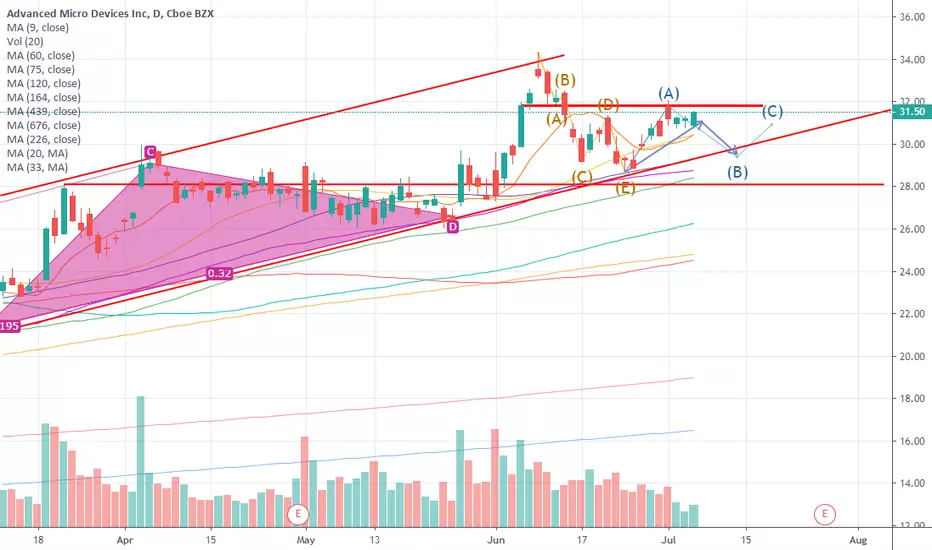
Price trend forecast timing analysis based on pretiming algorithm of Supply-Demand(S&D) strength.
Investing position: In Falling section of high risk & low profit
S&D strength Trend: In the midst of a rebounding trend of upward direction box pattern price flow marked by limited falls and upward fluctuations.
Downward trend coming soon.
Today's S&D strength Flow: Supply-Demand(S&D) strength flow appropriate to the current trend.
read more: pretiming.com/search?q=amd
D+1 Candlestick Color forecast: RED Candlestick
%D+1 Range forecast: 2.9% (HIGH) ~ 0.8% (LOW), 0.5% (CLOSE)
%AVG in case of rising: 3.1% (HIGH) ~ -1.0% (LOW), 1.7% (CLOSE)
%AVG in case of falling: 1.7% (HIGH) ~ -2.6% (LOW), -2.0% (CLOSE)
Nota
08-JULPrice trend forecast timing analysis based on pretiming algorithm of Supply-Demand(S&D) strength.
Investing position: In Falling section of high risk & low profit so far. But it would be in rising section tomorrow
S&D strength Trend: In the midst of a rebounding trend of upward direction box pattern price flow marked by limited falls and upward fluctuations.
Today's S&D strength Flow: Supply-Demand(S&D) strength flow appropriate to the current trend.
read more: pretiming.com/search?q=amd
D+1 Candlestick Color forecast: RED Candlestick
%D+1 Range forecast: 2.1% (HIGH) ~ 0.6% (LOW), 0.9% (CLOSE)
%AVG in case of rising: 3.1% (HIGH) ~ -1.0% (LOW), 1.7% (CLOSE)
%AVG in case of falling: 1.7% (HIGH) ~ -2.5% (LOW), -2.0% (CLOSE)
Penafian
Maklumat dan penerbitan adalah tidak bertujuan, dan tidak membentuk, nasihat atau cadangan kewangan, pelaburan, dagangan atau jenis lain yang diberikan atau disahkan oleh TradingView. Baca lebih dalam Terma Penggunaan.
Penafian
Maklumat dan penerbitan adalah tidak bertujuan, dan tidak membentuk, nasihat atau cadangan kewangan, pelaburan, dagangan atau jenis lain yang diberikan atau disahkan oleh TradingView. Baca lebih dalam Terma Penggunaan.