Hello traders and investors! Let’s see how AMD is doing today!
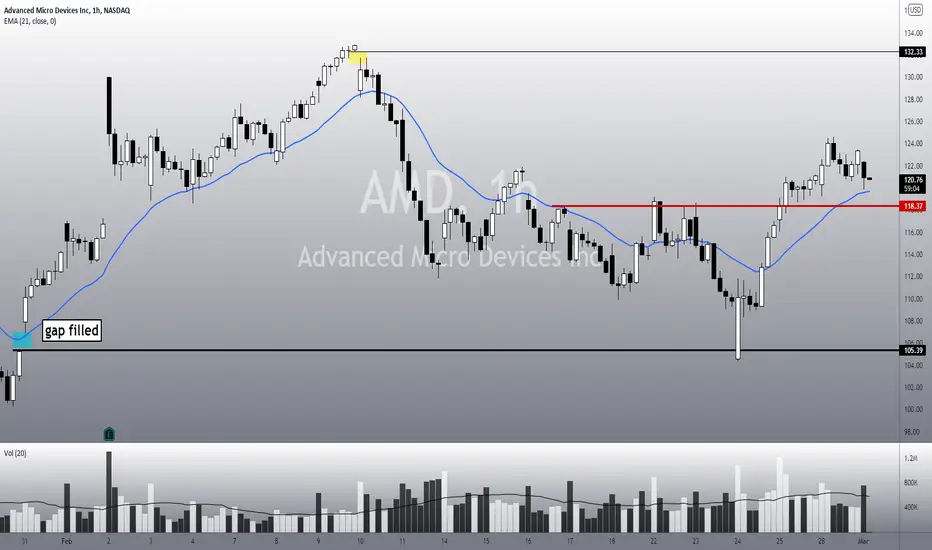
First, in the 1h chart, AMD filled the gap at $ 105, as we were already expecting, since it couldn’t trigger any bullish structure before, and now it is finally reacting.
It is curious to notice how technical analysis works amazingly well on some stocks. In the end, when the war was finally declared, AMD crashed just to fill our gap, and now it is going up as usual.
Now, we have a bull trend for the short-term, as we see higher highs/lows, and a pullback to the red line at $ 118 wouldn’t be scary at all. It must not lose this red line, though, otherwise AMD would need to do another bullish structure to remain bullish.
Our last gap at $ 132 is now a realistic target to aim.

In the daily chart, the trend is still bearish, but since AMD is breaking its 21 ema, we might have the beginning of a reversal for the mid-term, especially considering how strong the momentum in the 1h chart is.
I like the high volume, and it seems AMD wants to reverse. Again, let’s pay attention to the $ 118 area in the 1h chart, and wait for more bullish structures in the daily chart. I’ll keep you guys updated on this.
Remember to follow me to not miss any of my future analyses.
First, in the 1h chart, AMD filled the gap at $ 105, as we were already expecting, since it couldn’t trigger any bullish structure before, and now it is finally reacting.
It is curious to notice how technical analysis works amazingly well on some stocks. In the end, when the war was finally declared, AMD crashed just to fill our gap, and now it is going up as usual.
Now, we have a bull trend for the short-term, as we see higher highs/lows, and a pullback to the red line at $ 118 wouldn’t be scary at all. It must not lose this red line, though, otherwise AMD would need to do another bullish structure to remain bullish.
Our last gap at $ 132 is now a realistic target to aim.
In the daily chart, the trend is still bearish, but since AMD is breaking its 21 ema, we might have the beginning of a reversal for the mid-term, especially considering how strong the momentum in the 1h chart is.
I like the high volume, and it seems AMD wants to reverse. Again, let’s pay attention to the $ 118 area in the 1h chart, and wait for more bullish structures in the daily chart. I’ll keep you guys updated on this.
Remember to follow me to not miss any of my future analyses.
Penerbitan berkaitan
Penafian
Maklumat dan penerbitan adalah tidak dimaksudkan untuk menjadi, dan tidak membentuk, nasihat untuk kewangan, pelaburan, perdagangan dan jenis-jenis lain atau cadangan yang dibekalkan atau disahkan oleh TradingView. Baca dengan lebih lanjut di Terma Penggunaan.
Penerbitan berkaitan
Penafian
Maklumat dan penerbitan adalah tidak dimaksudkan untuk menjadi, dan tidak membentuk, nasihat untuk kewangan, pelaburan, perdagangan dan jenis-jenis lain atau cadangan yang dibekalkan atau disahkan oleh TradingView. Baca dengan lebih lanjut di Terma Penggunaan.
