📊 **Current Overview**
* The stock is trading at **\$19.40**, showing a daily drop of **6.10%**.
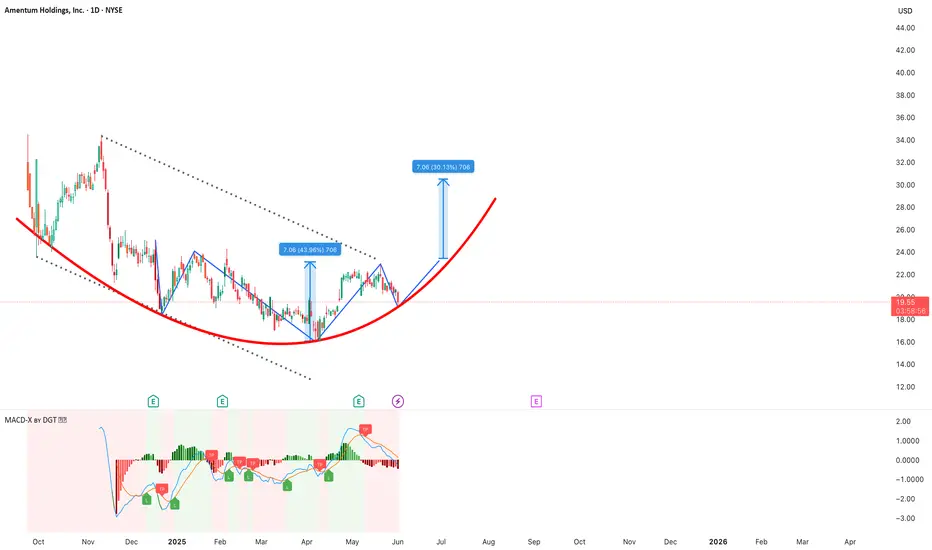
* A **rounded bottom (cup-shaped)** pattern is forming, often associated with a **bullish reversal**.
* The recent price action mirrors the earlier **mini-breakout** structure, suggesting a repeat pattern may be underway.
---
🔍 **Chart Patterns & Indicators**
🔷 **Head and Shoulders**
* The blue reverse head and shoulders setup is forming with right shoulder.
* This formation is usually broken with the same size of head (+43.96%).
* A similar move from the breakout level would target the **\$26–27 range**, representing a **30%+ gain**.
* If momentum continues, **\$30** is a realistic extension target.
🟥 **Rounded Bottom Formation**
* After the head and shoulders formation, the next is Cup and Handle that is very typical formation in small cap or new stocks in the market.
* The **curved red line** illustrates a classic **rounded bottom**, typically a **bullish pattern** that signals trend reversal.
* Price behavior suggests the stock is gradually shifting from a downtrend into a consolidation phase.
* It is early to talk about the target of this formation, but typically it is around **\$53**
📉 **Falling Wedge**
* The **dotted descending trendlines** frame a **falling wedge**, another **bullish reversal** signal.
* A breakout above this wedge could confirm the start of a new uptrend.
🟣 **MACD (Momentum Indicator)**
* The MACD has recently **crossed downward**, indicating short-term weakness.
* However, previous MACD behavior suggests possible **bullish divergence** if the price forms a higher low.
---
🎯 **Key Takeaways & Strategy**
* Amentum may be forming a **head and shoulders breakout pattern** inside a larger **rounded bottom**.
* If the price **finds support above \$18–19** and bounces, a move toward **\$26–30** is technically plausible.
* Watch for **MACD confirmation** and **volume spikes** to support any bullish breakout.
* The stock is trading at **\$19.40**, showing a daily drop of **6.10%**.
* A **rounded bottom (cup-shaped)** pattern is forming, often associated with a **bullish reversal**.
* The recent price action mirrors the earlier **mini-breakout** structure, suggesting a repeat pattern may be underway.
---
🔍 **Chart Patterns & Indicators**
🔷 **Head and Shoulders**
* The blue reverse head and shoulders setup is forming with right shoulder.
* This formation is usually broken with the same size of head (+43.96%).
* A similar move from the breakout level would target the **\$26–27 range**, representing a **30%+ gain**.
* If momentum continues, **\$30** is a realistic extension target.
🟥 **Rounded Bottom Formation**
* After the head and shoulders formation, the next is Cup and Handle that is very typical formation in small cap or new stocks in the market.
* The **curved red line** illustrates a classic **rounded bottom**, typically a **bullish pattern** that signals trend reversal.
* Price behavior suggests the stock is gradually shifting from a downtrend into a consolidation phase.
* It is early to talk about the target of this formation, but typically it is around **\$53**
📉 **Falling Wedge**
* The **dotted descending trendlines** frame a **falling wedge**, another **bullish reversal** signal.
* A breakout above this wedge could confirm the start of a new uptrend.
🟣 **MACD (Momentum Indicator)**
* The MACD has recently **crossed downward**, indicating short-term weakness.
* However, previous MACD behavior suggests possible **bullish divergence** if the price forms a higher low.
---
🎯 **Key Takeaways & Strategy**
* Amentum may be forming a **head and shoulders breakout pattern** inside a larger **rounded bottom**.
* If the price **finds support above \$18–19** and bounces, a move toward **\$26–30** is technically plausible.
* Watch for **MACD confirmation** and **volume spikes** to support any bullish breakout.
Dagangan ditutup secara manual
Buy 20Sell 25
Profit %25
I recommend closing this position completely, as it has not performed the expected price movement.
Penerbitan berkaitan
Penafian
Maklumat dan penerbitan adalah tidak dimaksudkan untuk menjadi, dan tidak membentuk, nasihat untuk kewangan, pelaburan, perdagangan dan jenis-jenis lain atau cadangan yang dibekalkan atau disahkan oleh TradingView. Baca dengan lebih lanjut di Terma Penggunaan.
Penerbitan berkaitan
Penafian
Maklumat dan penerbitan adalah tidak dimaksudkan untuk menjadi, dan tidak membentuk, nasihat untuk kewangan, pelaburan, perdagangan dan jenis-jenis lain atau cadangan yang dibekalkan atau disahkan oleh TradingView. Baca dengan lebih lanjut di Terma Penggunaan.