📊 Technical Analysis (TA) for AMZN
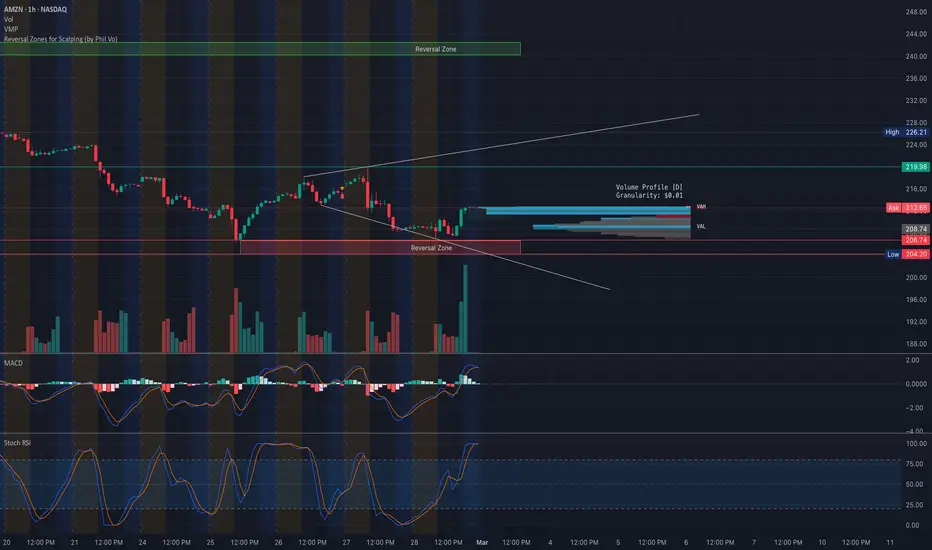
* Current Price Action: AMZN is attempting to recover from a downtrend, showing signs of a reversal after hitting the reversal zone near $204-$206. The price has broken out of a falling wedge, signaling a potential short-term upside.
* Key Levels to Watch:
* Resistance 1: $212.50 (Volume Profile POC) – A breakout could confirm bullish momentum.
* Resistance 2: $220 (2nd Call Wall) – Price may slow down or reject here.
* Major Resistance: $225-$230 – A strong resistance area and gamma wall.
* Support 1: $210 – If AMZN pulls back, this is the first key level to hold.
* Support 2: $205 (Put Support) – A breakdown below this would signal further downside risk.
* Critical Breakdown Level: $200 – Losing this level could trigger a larger sell-off.
📌 Indicators:
* MACD: Bullish crossover, indicating early momentum shift.
* Stochastic RSI: Overbought near 99, suggesting a possible short-term pullback.
🔎 Options Flow & GEX Analysis

* GEX (Gamma Exposure) Key Levels:
* 88.08% Call Resistance at $220 → Breaking above could fuel upside momentum.
* 71.12% 3rd Call Wall at $230 → A strong gamma resistance area.
* Highest Positive NetGEX / Call Resistance at $225 → Dealers could hedge against further upside.
* Put Wall Support at $205 → A strong support area from options positioning.
* 3rd Put Wall at $200 → Breaking this level could accelerate downside volatility.
📌 IV & Sentiment:
* IV Rank (IVR): 41.7 → Moderate implied volatility, options are reasonably priced.
* IVx Avg: 41.4 → Steady, indicating a stable options environment.
* Options Sentiment: Calls = 3.3% → Very low bullish bias in options flow.
📈 Trade Scenarios & Strategy
📌 Bullish Scenario (Breakout Play):
* Entry: Above $212.50 with strong volume.
* Target: $220, then $225.
* Stop Loss: Below $210.
📌 Bearish Scenario (Rejection & Breakdown):
* Entry: Below $210.
* Target: $205 or $200.
* Stop Loss: Above $212.50.
🔥 Final Thoughts & Suggestion
* AMZN is testing a key reversal zone. A breakout above $212.50 could push it toward $220+.
* If it fails to hold $210, expect a retest of $205-$200, which is a major support zone.
* Volume and options flow will be key – if gamma levels start unwinding, expect volatility to spike!
🚨 Disclaimer: This analysis is for educational purposes only. Trade responsibly and manage risk! 🚨
* Current Price Action: AMZN is attempting to recover from a downtrend, showing signs of a reversal after hitting the reversal zone near $204-$206. The price has broken out of a falling wedge, signaling a potential short-term upside.
* Key Levels to Watch:
* Resistance 1: $212.50 (Volume Profile POC) – A breakout could confirm bullish momentum.
* Resistance 2: $220 (2nd Call Wall) – Price may slow down or reject here.
* Major Resistance: $225-$230 – A strong resistance area and gamma wall.
* Support 1: $210 – If AMZN pulls back, this is the first key level to hold.
* Support 2: $205 (Put Support) – A breakdown below this would signal further downside risk.
* Critical Breakdown Level: $200 – Losing this level could trigger a larger sell-off.
📌 Indicators:
* MACD: Bullish crossover, indicating early momentum shift.
* Stochastic RSI: Overbought near 99, suggesting a possible short-term pullback.
🔎 Options Flow & GEX Analysis
* GEX (Gamma Exposure) Key Levels:
* 88.08% Call Resistance at $220 → Breaking above could fuel upside momentum.
* 71.12% 3rd Call Wall at $230 → A strong gamma resistance area.
* Highest Positive NetGEX / Call Resistance at $225 → Dealers could hedge against further upside.
* Put Wall Support at $205 → A strong support area from options positioning.
* 3rd Put Wall at $200 → Breaking this level could accelerate downside volatility.
📌 IV & Sentiment:
* IV Rank (IVR): 41.7 → Moderate implied volatility, options are reasonably priced.
* IVx Avg: 41.4 → Steady, indicating a stable options environment.
* Options Sentiment: Calls = 3.3% → Very low bullish bias in options flow.
📈 Trade Scenarios & Strategy
📌 Bullish Scenario (Breakout Play):
* Entry: Above $212.50 with strong volume.
* Target: $220, then $225.
* Stop Loss: Below $210.
📌 Bearish Scenario (Rejection & Breakdown):
* Entry: Below $210.
* Target: $205 or $200.
* Stop Loss: Above $212.50.
🔥 Final Thoughts & Suggestion
* AMZN is testing a key reversal zone. A breakout above $212.50 could push it toward $220+.
* If it fails to hold $210, expect a retest of $205-$200, which is a major support zone.
* Volume and options flow will be key – if gamma levels start unwinding, expect volatility to spike!
🚨 Disclaimer: This analysis is for educational purposes only. Trade responsibly and manage risk! 🚨
Penafian
Maklumat dan penerbitan adalah tidak dimaksudkan untuk menjadi, dan tidak membentuk, nasihat untuk kewangan, pelaburan, perdagangan dan jenis-jenis lain atau cadangan yang dibekalkan atau disahkan oleh TradingView. Baca dengan lebih lanjut di Terma Penggunaan.
Penafian
Maklumat dan penerbitan adalah tidak dimaksudkan untuk menjadi, dan tidak membentuk, nasihat untuk kewangan, pelaburan, perdagangan dan jenis-jenis lain atau cadangan yang dibekalkan atau disahkan oleh TradingView. Baca dengan lebih lanjut di Terma Penggunaan.