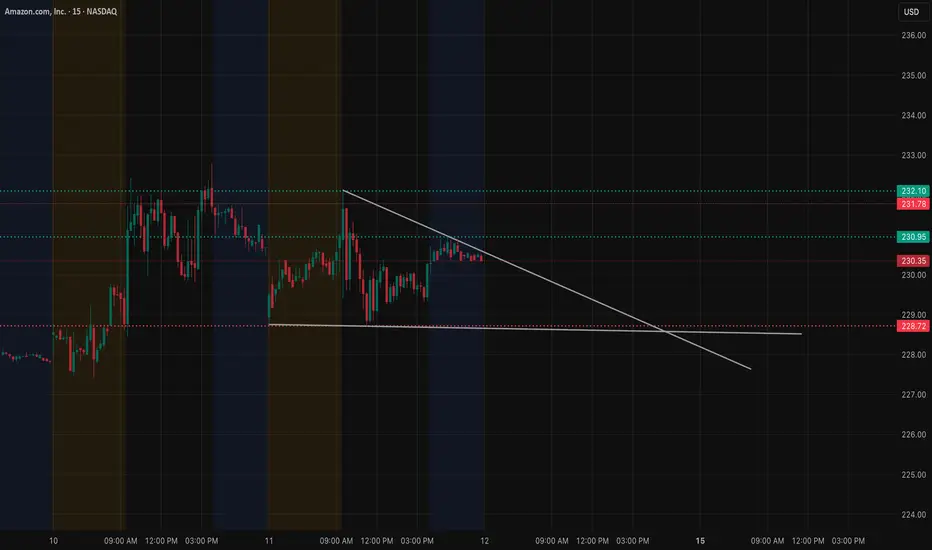
AMZN has been trading in a contracting structure on the 15-minute timeframe, respecting a downward trendline that has repeatedly rejected price. Each attempt to push through the 230.50–231 zone has been met with selling, keeping AMZN stuck under this tightening resistance. The price action has formed a clean triangle compression: lower highs from the trendline and a flat demand shelf around 228.50–229.
The reaction around 228.50 is especially important. This level has acted as a base multiple times across the last two sessions, and buyers consistently stepped in to defend it. If AMZN loses this level, the structure breaks and volatility opens up quickly.
Inside this compression, the candles continue to shrink—classic behavior before a breakout or breakdown. AMZN doesn’t have much room left. The market will likely choose direction early.
Now looking at the options landscape from GEX chart below, the GEX levels line up with the structural pressure points almost perfectly.

The strongest positive gamma resistance sits between 232–234. This aligns with the upper green zone shown on the chart. When price approaches these high positive-gamma regions, dealer hedging tends to limit extension, which explains why AMZN stalls every time it tries to climb into 231–232. It’s where momentum repeatedly fades.
If AMZN does break above the trendline and establishes support above 231, the hedging pressure that capped price begins to unwind. That creates room for AMZN to make a controlled move toward 232.5 first, and if volatility expands, 234 becomes achievable.
Below price, negative gamma begins to appear just under 228. The first key pocket centers around 227.5–226. This area aligns exactly with the flat support zone from the 15-minute chart. If AMZN loses 228.50 and slips into this negative gamma pocket, dealer hedging accelerates volatility instead of containing it. That opens the door for a deeper move toward 225, which also appears as a defined support zone on both price structure and GEX levels.
When price structure and GEX positioning both point to the same inflection zones, the setup becomes much clearer.
For Dec 12, AMZN’s path depends on how it resolves this triangle:
• Clearing the trendline and holding above 231 shifts momentum toward 232.5 and potentially 234
• Rejection at the trendline keeps AMZN inside the compression, likely leading to more chop
• Losing 228.50 turns structure bearish and aligns with negative gamma flow toward 227.5–226
• Losing 226 exposes the deeper target near 225
AMZN has been coiling for two sessions. The next breakout or breakdown should be directional.
This analysis is for educational purposes only and not financial advice.
The reaction around 228.50 is especially important. This level has acted as a base multiple times across the last two sessions, and buyers consistently stepped in to defend it. If AMZN loses this level, the structure breaks and volatility opens up quickly.
Inside this compression, the candles continue to shrink—classic behavior before a breakout or breakdown. AMZN doesn’t have much room left. The market will likely choose direction early.
Now looking at the options landscape from GEX chart below, the GEX levels line up with the structural pressure points almost perfectly.
The strongest positive gamma resistance sits between 232–234. This aligns with the upper green zone shown on the chart. When price approaches these high positive-gamma regions, dealer hedging tends to limit extension, which explains why AMZN stalls every time it tries to climb into 231–232. It’s where momentum repeatedly fades.
If AMZN does break above the trendline and establishes support above 231, the hedging pressure that capped price begins to unwind. That creates room for AMZN to make a controlled move toward 232.5 first, and if volatility expands, 234 becomes achievable.
Below price, negative gamma begins to appear just under 228. The first key pocket centers around 227.5–226. This area aligns exactly with the flat support zone from the 15-minute chart. If AMZN loses 228.50 and slips into this negative gamma pocket, dealer hedging accelerates volatility instead of containing it. That opens the door for a deeper move toward 225, which also appears as a defined support zone on both price structure and GEX levels.
When price structure and GEX positioning both point to the same inflection zones, the setup becomes much clearer.
For Dec 12, AMZN’s path depends on how it resolves this triangle:
• Clearing the trendline and holding above 231 shifts momentum toward 232.5 and potentially 234
• Rejection at the trendline keeps AMZN inside the compression, likely leading to more chop
• Losing 228.50 turns structure bearish and aligns with negative gamma flow toward 227.5–226
• Losing 226 exposes the deeper target near 225
AMZN has been coiling for two sessions. The next breakout or breakdown should be directional.
This analysis is for educational purposes only and not financial advice.
Penafian
Maklumat dan penerbitan adalah tidak bertujuan, dan tidak membentuk, nasihat atau cadangan kewangan, pelaburan, dagangan atau jenis lain yang diberikan atau disahkan oleh TradingView. Baca lebih dalam Terma Penggunaan.
Penafian
Maklumat dan penerbitan adalah tidak bertujuan, dan tidak membentuk, nasihat atau cadangan kewangan, pelaburan, dagangan atau jenis lain yang diberikan atau disahkan oleh TradingView. Baca lebih dalam Terma Penggunaan.