## Amazon (AMZN) Swing Trade Analysis
**Timeframe: 4H Chart (as per your screenshot, May 2, 2025)**
---
### **Technical Overview**
#### **1. Price Structure**
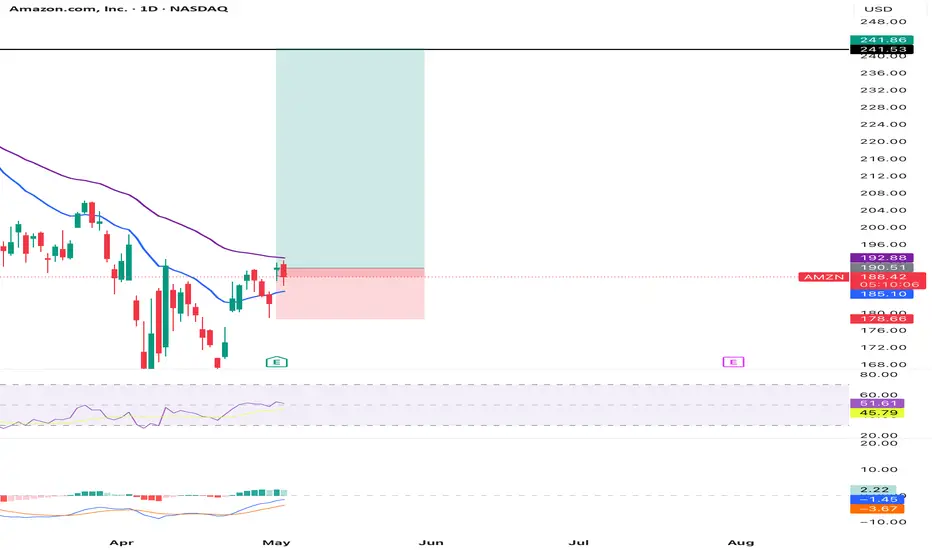
- **Trend:** The chart shows a recent reversal from a downtrend, with price making higher lows and attempting to break resistance around $190–$192.
- **Support:** Strong support is visible near $178.66 and a major support at $162.49.
- **Resistance/Target:** The green zone targets the $241.53–$241.86 area, which is a previous supply/resistance zone.
#### **2. Indicators**
- **RSI (Relative Strength Index):**
- Currently around 57–58, which is neutral-bullish and not overbought.
- Indicates there’s still room for upside before becoming overbought (>70).
- **MACD:**
- Bullish crossover recently, with the MACD line above the signal line and positive histogram.
- Suggests momentum is shifting to the upside.
#### **3. Risk/Reward**
- **Entry:** Around $189.67 (current price).
- **Stop Loss:** Below $178.66 (recent swing low/support).
- **Target:** $241.53–$241.86 (previous resistance).
- **Risk/Reward Ratio:**
- Risk: ~$11 (from $189.67 to $178.66)
- Reward: ~$52 (from $189.67 to $241.53)
- **R:R ≈ 1:4.7** - Excellent for swing trading.
#### **4. Volume & Volatility**
- Amazon is highly liquid, ensuring good fills and manageable slippage.
- The volatility is suitable for swing trading, with clear price swings and defined levels.
---
### **Why AMZN is Suitable for Swing Trading Now**
- **Clear Reversal Structure:** The downtrend has paused, and higher lows are forming-a classic swing setup.
- **Defined Support/Resistance:** Well-established levels allow for precise stop and target placement.
- **Strong Risk/Reward:** The setup offers a high R:R ratio, which is ideal for swing trades.
- **Momentum Confirmation:** Both RSI and MACD support a potential bullish move.
- **No Immediate Overbought Signal:** RSI is not yet overbought, so there’s room for the trade to develop.
- **Earnings Passed:** The last earnings event is behind, reducing the risk of surprise volatility.
---
### **Potential Risks**
- **If price fails to break $192–$195 resistance, a pullback to support ($178.66) is possible.**
- **Broader market weakness or negative news could invalidate the setup.**
- **Always use a stop loss as planned.**
---
## **Conclusion & Recommendation**
**Yes, AMZN is a strong candidate for a swing trade at this moment.**
- The technicals, risk/reward, and liquidity all align for a textbook swing setup.
- Enter above $190 with a stop below $178.66 and target $241+.
- Monitor for confirmation of breakout above $192–$195 for added conviction.
**(As always, manage your position size and risk according to your prop firm’s rules!)**
---
**Would you like a similar analysis for any other stock?**
Sources
[1] image.jpg pplx-res.cloudinary.com/image/upload/v1746196364/user_uploads/QytwVOsiIHqXhQX/image.jpg
**Timeframe: 4H Chart (as per your screenshot, May 2, 2025)**
---
### **Technical Overview**
#### **1. Price Structure**
- **Trend:** The chart shows a recent reversal from a downtrend, with price making higher lows and attempting to break resistance around $190–$192.
- **Support:** Strong support is visible near $178.66 and a major support at $162.49.
- **Resistance/Target:** The green zone targets the $241.53–$241.86 area, which is a previous supply/resistance zone.
#### **2. Indicators**
- **RSI (Relative Strength Index):**
- Currently around 57–58, which is neutral-bullish and not overbought.
- Indicates there’s still room for upside before becoming overbought (>70).
- **MACD:**
- Bullish crossover recently, with the MACD line above the signal line and positive histogram.
- Suggests momentum is shifting to the upside.
#### **3. Risk/Reward**
- **Entry:** Around $189.67 (current price).
- **Stop Loss:** Below $178.66 (recent swing low/support).
- **Target:** $241.53–$241.86 (previous resistance).
- **Risk/Reward Ratio:**
- Risk: ~$11 (from $189.67 to $178.66)
- Reward: ~$52 (from $189.67 to $241.53)
- **R:R ≈ 1:4.7** - Excellent for swing trading.
#### **4. Volume & Volatility**
- Amazon is highly liquid, ensuring good fills and manageable slippage.
- The volatility is suitable for swing trading, with clear price swings and defined levels.
---
### **Why AMZN is Suitable for Swing Trading Now**
- **Clear Reversal Structure:** The downtrend has paused, and higher lows are forming-a classic swing setup.
- **Defined Support/Resistance:** Well-established levels allow for precise stop and target placement.
- **Strong Risk/Reward:** The setup offers a high R:R ratio, which is ideal for swing trades.
- **Momentum Confirmation:** Both RSI and MACD support a potential bullish move.
- **No Immediate Overbought Signal:** RSI is not yet overbought, so there’s room for the trade to develop.
- **Earnings Passed:** The last earnings event is behind, reducing the risk of surprise volatility.
---
### **Potential Risks**
- **If price fails to break $192–$195 resistance, a pullback to support ($178.66) is possible.**
- **Broader market weakness or negative news could invalidate the setup.**
- **Always use a stop loss as planned.**
---
## **Conclusion & Recommendation**
**Yes, AMZN is a strong candidate for a swing trade at this moment.**
- The technicals, risk/reward, and liquidity all align for a textbook swing setup.
- Enter above $190 with a stop below $178.66 and target $241+.
- Monitor for confirmation of breakout above $192–$195 for added conviction.
**(As always, manage your position size and risk according to your prop firm’s rules!)**
---
**Would you like a similar analysis for any other stock?**
Sources
[1] image.jpg pplx-res.cloudinary.com/image/upload/v1746196364/user_uploads/QytwVOsiIHqXhQX/image.jpg
Penafian
Maklumat dan penerbitan adalah tidak dimaksudkan untuk menjadi, dan tidak membentuk, nasihat untuk kewangan, pelaburan, perdagangan dan jenis-jenis lain atau cadangan yang dibekalkan atau disahkan oleh TradingView. Baca dengan lebih lanjut di Terma Penggunaan.
Penafian
Maklumat dan penerbitan adalah tidak dimaksudkan untuk menjadi, dan tidak membentuk, nasihat untuk kewangan, pelaburan, perdagangan dan jenis-jenis lain atau cadangan yang dibekalkan atau disahkan oleh TradingView. Baca dengan lebih lanjut di Terma Penggunaan.